Market next move ⚠️ Disruption & Counterpoints:
1. Labeling Error – "Bullish" in a Bearish Trend:
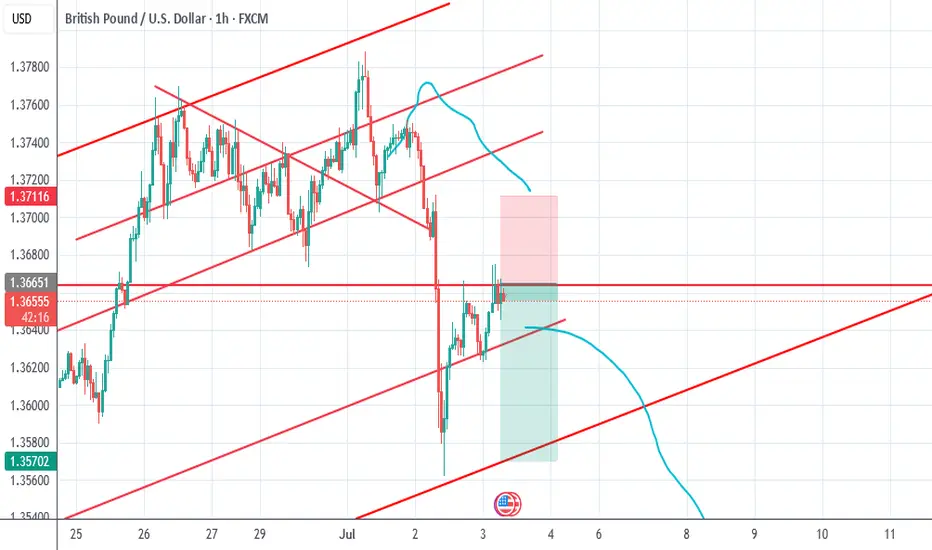
The chart clearly shows a strong downtrend starting after the peak on June 28.
Despite this, the word "Bullish" is used alongside a downward zigzag, which is misleading. This is not a bullish structure — it's a bearish continuation pattern or possibly a bear flag, which suggests further downside.
Using “Bullish” here may confuse traders into thinking a reversal is expected, while the actual trend favors further decline.
2. No Confirmed Reversal Pattern:
There's no double bottom, inverse head and shoulders, or any bullish candlestick formation (e.g., engulfing or hammer) to indicate a likely bullish reversal.
Without strong reversal signals, expecting a bullish move here lacks technical support.
3. Target Box Ambiguity:
The “Target” box is not clearly justified. There are no Fibonacci levels, previous support zones, or measured move explanations backing it.
A target should be based on a technical level — such as the bottom of a previous range, a support zone, or a projection from a pattern.
GBPUSD_SPT trade ideas

#GBPUSD: A strong bullish move incoming, comment your views The price has shown a possible price divergence, which could lead to a long-term move to 1.37. We expect the US dollar to weaken, which will likely push the price of GBPUSD to our target. Key economic data will be released later today and tomorrow, which could shape the price pattern.
Good luck and trade safely!
Team Setupsfx_

GBP/USD Short Idea Analysis : GBP/USD is approaching a critical resistance zone between 1.37850 and 1.38800 on the daily timeframe, presenting a potential short opportunity based on technical and fundamental factors.
Technical Analysis:
Price Action: The 1.37850–1.38800 zone aligns with prior highs and a strong resistance area, likely to trigger rejection or a bearish reversal pattern (e.g., double top or bearish engulfing).
Support/Target: Initial support at 1.3700, with a deeper target at 1.3600 if bearish momentum builds.
Indicators: RSI is approaching overbought territory (near 70), signaling potential exhaustion. MACD shows slowing bullish momentum, supporting a short bias.
Fibonacci: The 1.37850–1.38800 zone coincides with the 76.4%–88.6% Fibonacci retracement of the prior downmove, reinforcing resistance.
Fundamental Context:
UK economic data (e.g., weaker retail sales or PMI) suggests GBP vulnerability. Meanwhile, USD strength is bolstered by hawkish Fed expectations and resilient US economic indicators.
Risks: A breakout above 1.3900 could invalidate the setup. Monitor BoE rhetoric and US data releases for sudden shifts.
Conclusion: The 1.37850–1.38800 resistance zone offers a high-probability short setup for GBP/USD, supported by technical resistance and USD-favorable fundamentals. Use strict risk management due to potential volatility.

GBPUSD – Pound Stumbles on Political Risk and NFP FearGBPUSD – Pound Stumbles on Political Risk and NFP Fear: Reversal or Breakdown?
🧭 MACRO SNAPSHOT – All Eyes on UK Politics and US Jobs
The British Pound came under renewed pressure on Wednesday, losing nearly 0.8% intraday, driven largely by escalating political uncertainty in the UK. Concerns over early elections, party leadership instability, and fiscal doubts have weighed on GBP sentiment.
Meanwhile, the US Dollar remains supported ahead of the June Non-Farm Payrolls (NFP) release. With recent labor data showing signs of weakness (ADP: -33K), today’s NFP is expected to shape short-term Fed expectations. A weak report may cap USD gains and provide a rebound opportunity for GBP – but risk is two-sided.
📊 TECHNICAL STRUCTURE – H4 Chart Insights:
Trend Channel: GBPUSD is still trading within an ascending channel, but recent rejection at 1.3769 raises caution.
EMA Signals: Price has broken below EMA 13 and 34, showing momentum loss. EMA 89 is the next possible support near 1.3570.
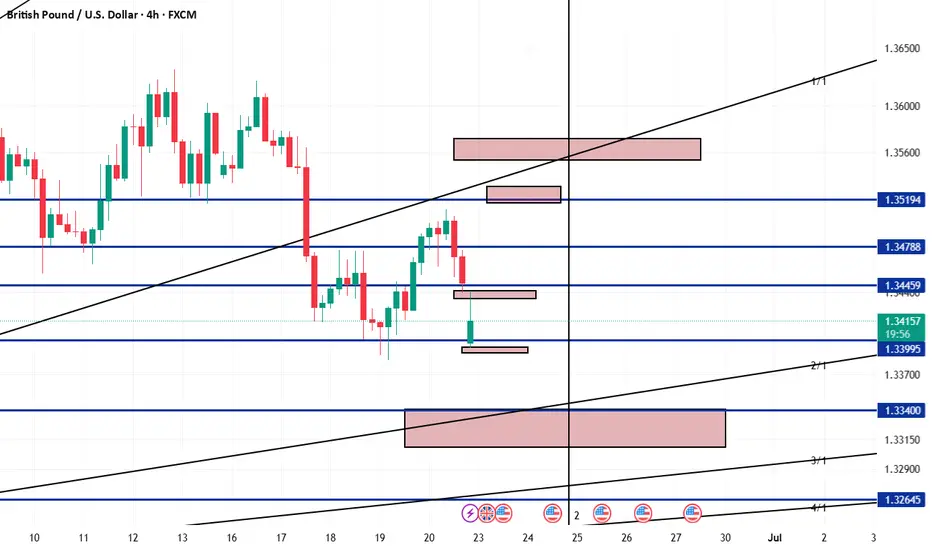
Fibonacci Zones:
0.382: 1.3543
0.5: 1.3466
0.618: 1.3390
Key Levels to Watch:
Resistance: 1.3681 – 1.3769
Support: 1.3570 – 1.3450 (golden pocket)
The price is likely to test the midline or lower bound of the channel before resuming a move higher, assuming macro tailwinds don’t intensify GBP selling.
🎯 TRADE PLAN:
🔵 Buy Setup (Reversal from Demand Zone):
Entry: 1.3450 – 1.3460
SL: 1.3390
TP: 1.3570 → 1.3680 → 1.3760
Bias: Counter-trend rebound from golden pocket & ascending trendline
🔴 Sell Setup (Short-term pullback):
Entry: 1.3680 – 1.3700
SL: 1.3765
TP: 1.3570 → 1.3450
Bias: Fade weak bullish momentum near prior high resistance
📌 Risk Context:
Today’s US NFP report is high-impact – expect volatility spikes and spread widening. UK political headlines could cause gaps or sharp reversals. Traders are advised to reduce size or wait for clear rejection/confirmation candles before entry.

GBPUSD 30m – Elliott Wave + AO ConfirmationPrice is currently testing the 1.36277 zone. I’m closely monitoring for a break of structure below this level. If it breaks, I’ll be watching for a pullback setup to short, ideally aligning with BBMA/EMA confluence.
The wave structure looks clean:
• ✅ Wave (1), (2), (3), and (4) are completed.
• ✅ AO histogram also confirms momentum waves (1) to (4), with the current move likely to complete Wave (5) to the downside.
• 🔻 Wave (4) retraced into the previous imbalance zone and respected resistance, giving further confluence for bearish continuation.
Looking to target below 1.3500 for Wave (5) completion.
Key Levels to Watch:
• 🔑 Break below 1.36277 = Bearish confirmation
• 🎯 Potential TP Zone: 1.3450 – 1.3425
• 🚫 Invalidation if price closes above 1.3700 with momentum
Let’s see how price reacts at this key level 👀
#GBPUSD #ElliottWave #AO #PriceAction #BreakOfStructure #TradingView

GBPUSD📌 GBPUSD – Scenario-Based Plan
The first level I’ve marked is a short-term zone.
If we get a strong buy signal there with good R/R, I’ll enter and trail aggressively.
The second level is a stronger demand zone and a better area for potential long setups.
❗️Remember: These are just scenarios — not predictions.
We stay ready for whatever the market delivers.

GBPUSD: The Big Short Opportunity?(Breakout Confirmation Needed)🚨 GBP/USD BANK HEIST ALERT: The Bearish Robbery Plan (Swing/Day Trade) 🚨
🔥 Steal Pips Like a Pro – Thief Trading Strategy Inside! 🔥
🌟 GREETINGS, MARKET PIRATES! 🌟
🤑 To all the Money Makers, Risk Takers & Midnight Breakers!
Based on our 🔥Thief Trading Style🔥 (a deadly mix of technical + fundamental + intermarket analysis), we’re plotting a massive bearish heist on GBP/USD ("The Cable").
This is not financial advice—just a strategic robbery plan for those who dare to trade smart.
📉 THE HEIST STRATEGY (SHORT ENTRY FOCUS)
🎯 Target Zone: 1.32300 (or escape earlier if the market turns)
⚡ High-Risk, High-Reward Play: Oversold market, consolidation, trend reversal setup.
💣 Trap Level: Where bullish traders get wrecked.
🔑 ENTRY RULES:
"The Heist is ON!" – Wait for breakout confirmation at 1.33800 before striking.
Sell Stop Orders below breakout MA OR Sell Limit Orders (15-30 min timeframe).
Retest Entry? Ideal if price retraces to recent low/high before dropping.
📌 ALERT SETUP: Don’t miss the breakout—set a chart alert!
🛑 STOP LOSS (Risk Management):
Thief SL at 1.34800 (Swing/Day Trade basis – 3H period).
🚨 Pro Tip: "Yo, rebels! You can place SL wherever you want… but if you ignore this level, don’t cry later. Your risk, your rules."
🎯 PROFIT TARGET:
First Take-Profit: 1.32300 (or bail earlier if momentum fades).
Scalpers: Ride the short side only. Use trailing SL to lock profits.
📰 FUNDAMENTAL BACKUP (Why This Heist Works)
Before executing, check:
✅ COT Report (Are big players dumping GBP?)
✅ Macro News (UK vs. USD economic strength)
✅ Intermarket Analysis (DXY, Bonds, Equities correlation)
✅ Sentiment & Seasonality (Is the crowd too bullish?)
⚠️ WARNING: NEWS & VOLATILITY ALERTS
Avoid new trades during high-impact news (unless you love gambling).
Use trailing stops to protect profits if the market flips.
💥 BOOST THIS HEIST! 💥
🚀 Like & Share to strengthen our Thief Trading Squad!
💸 More heists = More profits. Stay tuned for the next robbery plan!
🤑 See you on the profitable side, bandits! 🏴☠️
🔴 DISCLAIMER: This is entertainment, not financial advice. Trade at your own risk.
#Forex #GBPUSD #TradingStrategy #ThiefTrading #BankHeist #SwingTrading #DayTrading
💬 COMMENT BELOW: Are you joining the heist or waiting for a better setup? 🚨👇

GBPUSD | 26.06.2025SELL 1.37400 | STOP 1.38200 | TAKE 1.36400 | After consolidation around the medium-term highs, a corrective downward movement is likely and price consolidation under the level of 1.37000.

GBPUSDTake trade at a strong green candle and sell as per technical analysis. Profit should be as per price action
Bearish reversal off pullback resistance?The Cable (GBP/USD) is reacting off the pivot and could drop to the 1st support which is a pullback support.
Pivot: 1.3632
1st Support: 1.3533
1st Resistance: 1.2711
Risk Warning:
Trading Forex and CFDs carries a high level of risk to your capital and you should only trade with money you can afford to lose. Trading Forex and CFDs may not be suitable for all investors, so please ensure that you fully understand the risks involved and seek independent advice if necessary.
Disclaimer:
The above opinions given constitute general market commentary, and do not constitute the opinion or advice of IC Markets or any form of personal or investment advice.
Any opinions, news, research, analyses, prices, other information, or links to third-party sites contained on this website are provided on an "as-is" basis, are intended only to be informative, is not an advice nor a recommendation, nor research, or a record of our trading prices, or an offer of, or solicitation for a transaction in any financial instrument and thus should not be treated as such. The information provided does not involve any specific investment objectives, financial situation and needs of any specific person who may receive it. Please be aware, that past performance is not a reliable indicator of future performance and/or results. Past Performance or Forward-looking scenarios based upon the reasonable beliefs of the third-party provider are not a guarantee of future performance. Actual results may differ materially from those anticipated in forward-looking or past performance statements. IC Markets makes no representation or warranty and assumes no liability as to the accuracy or completeness of the information provided, nor any loss arising from any investment based on a recommendation, forecast or any information supplied by any third-party.

GBP/USD could drop 300 pips to 1.3443!1). Market sentiment is at 1.3443. 2). Wave 5 overbought! 3). Price Volume is dropping. 4). Banks are selling! 5). Price is hitting a lot of resistance at the 200% fib level!

GBP/USD Tactical Shift: Long Closed, Short Bias ActivatedAfter successfully capturing the upside move on GBP/USD, price has now reached a key resistance zone where bullish momentum appears to be fading. The recent price action shows signs of exhaustion, with lower highs forming near the top and a noticeable slowdown in buying pressure.
This shift in structure suggests a potential reversal opportunity. I'm now positioning for a short setup, anticipating a corrective move as sellers begin to step in. The risk is clearly defined above the recent highs, with downside targets aligned with previous reaction zones and intraday support levels.
This transition from long to short reflects a dynamic response to evolving market conditions—focused, disciplined, and opportunity-driven.

GBPUSD GBPUSD has completed its bullish leg, reaching our previously identified target zone.
Current price action indicates potential exhaustion, and we are now actively monitoring for a short setup, targeting the 1.37200 level, which aligns with a minor inefficiency and previous structural support turned resistance.
This move is supported by overextended intraday momentum on the 15-minute chart, along with bearish divergence forming against key price levels — suggesting a potential retracement phase.
Risk Management Strategy:
Entry: Upon confirmation of a bearish setup (e.g., rejection from a lower high or failure to break recent highs with strength).
Stop-Loss: Placed above the most recent swing high or invalidation level, ensuring protection against false breakouts.
Target: 1.37200, offering a favorable risk-to-reward ratio of at least 1:2.
We’ll continue to monitor price behavior closely and adjust if momentum shifts or invalidation levels are breached.

GU-Tue-01/07/25 TDA-Strong resistance area approaching 1.37500Analysis done directly on the chart
Follow for more, possible live trades update!
I often share my live trades in Tradingview public chat in London session, stay tuned!
Timing!
You might ask yourself why sometimes your
trade idea was good but still ended up hitting your sl before it moves to your direction.
The reason is simple: Timing.
price is just not ready to push at that time
and needed extra liquidity and structure before it finally has the force to push.
Understanding when the market is ready is one of the most difficult thing for a trader to do but with experience you start to understand better and improve.
If you like the way I present and analyze, make sure to boost,
share and follow me for more future posts, ideas and useful informations.
Active in London session!
Not financial advice, DYOR.
Market Flow Strategy
Mister Y

GU-Mon-30/06/25 TDA-Good support 1.37000&Good resistance 1.37500Analysis done directly on the chart
Follow for more, possible live trades update!
I often share my live trades in Tradingview public chat in London session, stay tuned!
The reality of life is that if you don't work for yourself,
you'll never achieve what you want.
Don't expect things to come, work for it, act on it.
Notice the difference between DOers and Dreamers.
Comment down below what do you think!
Active in London session!
Not financial advice, DYOR.
Market Flow Strategy
Mister Y

Bullish rise off pullback support?The Cable (GBP/USD) is falling towards the pivot which is a pullback support and could bounce to the 1st resistance.
Pivot: 1.3503
1st Support: 1.3455
1st Resistance: 1.3616
Risk Warning:
Trading Forex and CFDs carries a high level of risk to your capital and you should only trade with money you can afford to lose. Trading Forex and CFDs may not be suitable for all investors, so please ensure that you fully understand the risks involved and seek independent advice if necessary.
Disclaimer:
The above opinions given constitute general market commentary, and do not constitute the opinion or advice of IC Markets or any form of personal or investment advice.
Any opinions, news, research, analyses, prices, other information, or links to third-party sites contained on this website are provided on an "as-is" basis, are intended only to be informative, is not an advice nor a recommendation, nor research, or a record of our trading prices, or an offer of, or solicitation for a transaction in any financial instrument and thus should not be treated as such. The information provided does not involve any specific investment objectives, financial situation and needs of any specific person who may receive it. Please be aware, that past performance is not a reliable indicator of future performance and/or results. Past Performance or Forward-looking scenarios based upon the reasonable beliefs of the third-party provider are not a guarantee of future performance. Actual results may differ materially from those anticipated in forward-looking or past performance statements. IC Markets makes no representation or warranty and assumes no liability as to the accuracy or completeness of the information provided, nor any loss arising from any investment based on a recommendation, forecast or any information supplied by any third-party.

GBPUSD AnalaysisGBPUSD Analaysis on 4H frame According to my own analysis strategy
Selling Zones :
1.35150 - 1.35300
1.35530 - 1.35720
buying zones
1.33427 - 1.33080
Possible GBPUSD LONG TradeTargeting bullish imbalance Order block for a long trade.
Expecting a sweep of the 4H CRT, then a reaction from the bullish order block.

Riding the Wave or Facing a Pullback? Key Levels to WatchGBPUSD: Riding the Wave or Facing a Pullback? Key Levels to Watch!
Hello TradingView Community!
The GBPUSD pair is currently under the spotlight, experiencing significant movements driven by a mix of market sentiment and economic indicators.
🌍 Fundamental Snapshot: GBP's Lift vs. Underlying Pressures
The British Pound has seen a notable surge, climbing near 1.3765 against the US Dollar. This uplift is primarily fueled by market hopes for an imminent announcement of Fed Chair Powell's successor by President Trump, hinting at potential future dovish shifts in Fed policy. Such speculation could dampen USD's strength, benefiting GBPUSD.
However, the outlook isn't entirely clear-cut for the Pound. Fed Chair Powell has cautioned that tariff-induced inflation might prove persistent, adding a layer of complexity to the broader USD sentiment. Domestically, UK employers are reportedly planning workforce reductions to offset rising social security contributions, which could weigh on the GBP.
In essence, GBPUSD is benefiting from potential USD weakness linked to Fed policy expectations, but traders should remain vigilant about internal economic pressures within the UK.
📊 GBPUSD Technical Analysis (H4/M30 Chart):
Our technical analysis of the GBPUSD chart (image_b6d4de.png) reveals a clear uptrend, marked by consistent higher highs and higher lows. The EMAs are also in a bullish alignment, reinforcing this upward momentum.
Key Resistance (Potential Sell Zone): We identify significant resistance at 1.38366. This level could attract selling pressure, suggesting a potential price reversal or consolidation after hitting this mark.
Key Support Levels (Potential Buy Zones):
Initial support lies at 1.36648.
A stronger support area is at 1.36158. These levels could act as bounce points after any corrective moves.
🎯 GBPUSD Trading Plan:
BUY Zone 1 (Near Current Support):
Entry: Consider entries around 1.36648.
SL: 1.36500 (just below support).
TP: Target incremental gains towards 1.36800, 1.37000, 1.37200, 1.37400, 1.37600, 1.37800, 1.38000, and potentially 1.38300 (just shy of major resistance).
BUY Zone 2 (Stronger Support):
Entry: Look for entries around 1.36158.
SL: 1.36000 (below strong support).
TP: Target incremental gains towards 1.36300, 1.36500, 1.36700, 1.37000, 1.37300, 1.37600, 1.38000, and 1.38300.
SELL Zone (At Resistance):
Entry: Consider short entries around 1.38366.
SL: 1.38500 (just above resistance).
TP: Target incremental declines towards 1.38200, 1.38000, 1.37800, 1.37500, 1.37200, 1.37000, 1.36800, and 1.36648 (targeting support).
⚠️ Key Factors to Monitor:
Fed Leadership News: Any official announcement regarding the Fed Chair succession will trigger significant USD volatility.
UK Economic Data: Upcoming reports on employment, inflation, and GDP will directly impact the Pound.
BoE Statements: Monetary policy stances from the Bank of England.
US Inflation/Employment Data: Continues to influence overall USD strength.
Trade wisely and always prioritize robust risk management! Wishing everyone a successful trading day!

Bullish bouce off major support?GBP/USD has bounced off the support level which is an overlap support that lines up with the 38.2% Fibonacci retracement and could rise from this level to our take profit.
Pivot: 1.3609
Why we like it:
There is an overlap support level which lines up with the 38.2% Fibonacci retracement.
Stop loss: 1.3534
Why we like it:
There is a pullback support that is slightly above the 61.8% Fibonacci retracement.
Take profit: 1.3750
Why we like it:
There is a pullback resistance.
Enjoying your TradingView experience? Review us!
Please be advised that the information presented on TradingView is provided to Vantage (‘Vantage Global Limited’, ‘we’) by a third-party provider (‘Everest Fortune Group’). Please be reminded that you are solely responsible for the trading decisions on your account. There is a very high degree of risk involved in trading. Any information and/or content is intended entirely for research, educational and informational purposes only and does not constitute investment or consultation advice or investment strategy. The information is not tailored to the investment needs of any specific person and therefore does not involve a consideration of any of the investment objectives, financial situation or needs of any viewer that may receive it. Kindly also note that past performance is not a reliable indicator of future results. Actual results may differ materially from those anticipated in forward-looking or past performance statements. We assume no liability as to the accuracy or completeness of any of the information and/or content provided herein and the Company cannot be held responsible for any omission, mistake nor for any loss or damage including without limitation to any loss of profit which may arise from reliance on any information supplied by Everest Fortune Group.

GBP/USD Short Setup – Rising Wedge BreakdownGBP/USD Short Setup – Rising Wedge Breakdown
Timeframe: 2H
The pair has formed a rising wedge pattern, typically a bearish reversal signal. Price has now broken below the lower trendline, suggesting a potential downside move.
Setup Details:
Entry: ~$1.3717 (post-breakout)
Stop Loss: ~$1.3826 (above recent highs)
Target Zone: $1.3477 to $1.3407
Technical Analysis:
Rising wedge pattern breakdown confirmed
Supertrend indicator has flipped bearish
Momentum divergence visible on lower timeframes (not shown)
Fundamental Context:
GBP remains under pressure due to weak UK economic data and ongoing BoE rate cut expectations
USD strength backed by persistent inflation concerns and hawkish Fed tone
Bias: Bearish (Short-Term Swing Trade)
Look for potential retests of broken support for confirmation. Manage risk accordingly as volatility may increase ahead of upcoming macro events

GBPUSD - Bullish Channel (TCB Strategy)📈 GBPUSD – Falling Wedge Breakout Within Bullish Channel (TCB Strategy)
Type: Trend → Countertrend → Breakout
Timeframe: 1H
Status: Trade Running
🔍 Analysis Summary:
GBPUSD is respecting a strong ascending channel, with a recent correction forming a textbook falling wedge pattern. Price has now broken out of the wedge with bullish momentum during the NY session, signaling a potential continuation toward the upper boundary of the channel.
This setup aligns perfectly with my TCB Strategy:
Trend: Bullish market structure intact
Countertrend: Falling wedge correction
Breakout: Clean bullish breakout above wedge resistance
🧠 Trade Plan:
Entry (EP1): 1.37350 (Breakout entry)
SL: 1.36850 (below wedge low)
TP1: 1.37600
TP2: 1.38200 (channel top)
🛠️ Checklist Score: ✅ 100%
All criteria met, including session timing, structure confluence, breakout candle quality, and risk-reward profile.
📌 Watching how price reacts around 1.37600. Clean break above that could open the path to 1.38200+.
Follow for updates.
#GBPUSD #ForexAnalysis #TCBStrategy #BreakoutSetup #FallingWedge #PriceAction

GBPUSD will have minor downtrend and continue go highAt lower timeframe, GBPUSD already gave rejection.
Wait until retracement is over and breakout at lower timeframe. Then, we can see GBPUSD go higher as possible
