gbpusdThere is a high probability of a reversal within the specified range
The daily trend line at the ceiling has also caused the price to reverse
The sell order has a higher probability of success than the specified targets
The risk to reward is excellent
GBPUSD_SPT trade ideas

Market next target 🔁 Disruption of the Current Bullish Analysis
1. Resistance Rejection Likelihood
The chart suggests a breakout above resistance will turn the red box into support.
Disruption: The price is currently at a key resistance zone, and multiple rejections in this area previously suggest selling pressure.
We could see a double top formation or a false breakout trapping bulls.
Look for wicks or long upper shadows indicating weakness.
2. Volume Divergence
Recent bullish candles show declining or inconsistent volume.
Disruption: A strong bullish breakout requires rising volume. If volume doesn't confirm price action, this move may lack conviction and reverse sharply.
3. Overbought Conditions
After a strong uptrend, RSI or Stochastic indicators (not shown, but implied) could be entering overbought territory.
Disruption: This suggests limited upside and a potential for mean reversion or correction.
4. Bearish Candlestick Pattern Watch
Watch closely for a bearish engulfing, shooting star, or evening star at this resistance zone.
Disruption: Any bearish reversal pattern here would strongly contradict the bullish breakout thesis.

GBP/USD Surges to Three-Year Highs- PCE on tapSterling held slope resistance for more than three-weeks with a defense of support this week attempting to mark an outside-weekly reversal candle. The advance is testing resistance today at the 2022 swing high near 1.3749 and the focus is on the weekly close with respect to this pivot zone.
Initial weekly support now rests with the June opening-range highs near 1.3633 and is backed by the 78.6 % retracement of the 2021 decline at 1.3414. Broader bullish invalidation now raised to the April high-week close (HWC) at 1.3270- losses below this threshold would suggest a more significant high is in place / a larger reversal is underway towards the 2023 HWC at 1.3092.
A breach / weekly close above 1.3749 is needed to keep the immediate advance viable with subsequent resistance objectives eyed at the 61.8% extension of the 2022 advance at 1.4003 and the 2021 HWC at 1.4158- both levels of interest for possible topside exhaustion / price inflection IF reached.
Bottom line: A breakout of the monthly opening-range takes GBP/USD into initial resistance at the 2022 swing highs with weekly momentum pressing into overbought territory today. From at trading standpoint, a good zone to reduce portions of long-exposure / raise protective stops- losses would need to be limited to 1.3632 IF price is heading higher on this stretch with a close above 1.3749 needed to mark uptrend resumption.
-MB

GBP/USDPrice action trading is a methodology in financial markets where traders make decisions based on the actual price movements of an asset over time, rather than relying heavily on technical indicators or fundamental analysis. It involves observing and interpreting patterns and trends in price charts to predict future price movements.

Short to Long Waiting for the market to reach the poi and wait for reaction to short to the bullish poi
GBP/USD BEARS ARE STRONG HERE|SHORT
Hello, Friends!
GBP/USD pair is in the uptrend because previous week’s candle is green, while the price is clearly rising on the 3H timeframe. And after the retest of the resistance line above I believe we will see a move down towards the target below at 1.358 because the pair overbought due to its proximity to the upper BB band and a bearish correction is likely.
Disclosure: I am part of Trade Nation's Influencer program and receive a monthly fee for using their TradingView charts in my analysis.
✅LIKE AND COMMENT MY IDEAS✅

High-Reward GBPUSD Setup: Entry 1.3598, TP 1.3867, SL 1.3478The GBP/USD pair has recently shown a clean bullish breakout from a short-term consolidation zone. Price has decisively moved above the 1.3478–1.3480 support-turned-resistance level, which previously acted as a ceiling within a rising channel. This breakout is meaningful—it comes after a retracement toward the lower boundary of the ascending structure, suggesting that buyers are once again gaining control.
The recent bullish candle has closed strong and full-bodied, indicating momentum. Historically, as you mentioned, GBPUSD tends to follow through for a few sessions once a bullish breakout begins. This is visible in prior moves throughout March and April, where an initial spike was often followed by two or three additional bullish candles. That behavior adds confluence to this setup.
Moreover, there is a clear path for price to move toward the long-term resistance near 1.3867, which aligns well with prior supply zones and the upper boundary of historical price reactions.
📈 Trade Idea
• Entry: 1.3598 (current price after breakout confirmation)
• Stop Loss: 1.3478 (just below the support flip and last swing low)
• Take Profit: 1.3867 (next major resistance level)
• Risk–Reward Ratio: ~2.24:1
This setup offers a clean bullish continuation pattern with room to run. If the pair maintains its current momentum, reaching the target in the next few trading days is entirely plausible. Any daily close above 1.3600 with volume would further validate the trend.

Cable looking for a new high with Ending DiagonalCable found some support in the last 24 hours and it looks like we may still see a retest of the high, so apparently this 5th wave is still in progress but unfolding with an ending diagonal with subwave five on the way up to 1.37–1.38, which could be the key resistance for this reversal pattern. So despite some recovery that is happening right now, we still think that the impulse from January is in late stages, which is also confirmed by divergence on the RSI and overlapping price action that clearly suggests that bulls are losing strength up here.
GH

Major resistance ahead?GBP/USD is rising towards the resistance level which is an overlap resistance and could reverse from this level to our take profit.
Entry: 1.3535
Why we like it:
There is an overlap resistance level.
Stop loss: 1.3449
Why we like it:
There is a pullback resistance level that lines up with the 161.8% Fibonacci extension.
Take profit: 1.3449
Why we like it:
There is a pullback support level.
Enjoying your TradingView experience? Review us!
Please be advised that the information presented on TradingView is provided to Vantage (‘Vantage Global Limited’, ‘we’) by a third-party provider (‘Everest Fortune Group’). Please be reminded that you are solely responsible for the trading decisions on your account. There is a very high degree of risk involved in trading. Any information and/or content is intended entirely for research, educational and informational purposes only and does not constitute investment or consultation advice or investment strategy. The information is not tailored to the investment needs of any specific person and therefore does not involve a consideration of any of the investment objectives, financial situation or needs of any viewer that may receive it. Kindly also note that past performance is not a reliable indicator of future results. Actual results may differ materially from those anticipated in forward-looking or past performance statements. We assume no liability as to the accuracy or completeness of any of the information and/or content provided herein and the Company cannot be held responsible for any omission, mistake nor for any loss or damage including without limitation to any loss of profit which may arise from reliance on any information supplied by Everest Fortune Group.

Market Analysis: GBP/USD Dips Below SupportMarket Analysis: GBP/USD Dips Below Support
GBP/USD started a fresh decline below the 1.3620 zone.
Important Takeaways for GBP/USD Analysis Today
- The British Pound started another decline from the 1.3620 resistance zone.
- There was a break below a connecting bullish trend line with support at 1.3460 on the hourly chart of GBP/USD at FXOpen.
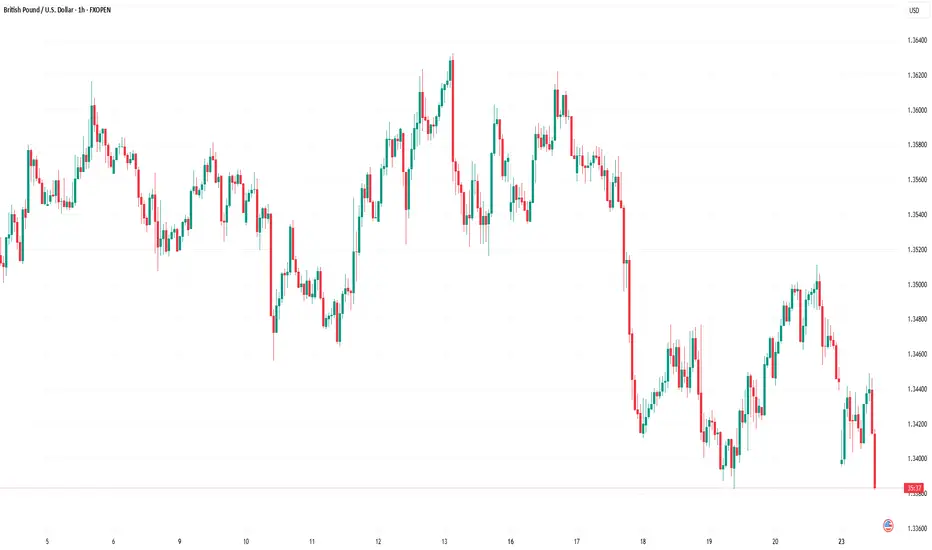
GBP/USD Technical Analysis
On the hourly chart of GBP/USD at FXOpen, the pair struggled to continue higher above the 1.3620 resistance zone. The British Pound started a fresh decline and traded below the 1.3550 support zone against the US Dollar, as discussed in the previous analysis.
The pair even traded below 1.3500 and the 50-hour simple moving average. Finally, the bulls appeared near the 1.3380 level. There was a recovery wave above the 1.3450 level and the 23.6% Fib retracement level of the downward move from the 1.3622 swing high to the 1.3382 low.
However, the bears were active near the 1.3500 zone and the 50% Fib retracement level. As a result, there was a fresh bearish reaction below a connecting bullish trend line with support at 1.3460.
Initial support on the GBP/USD chart sits at 1.3380. The next major support is at 1.3350, below which there is a risk of another sharp decline. In the stated case, the pair could drop toward 1.3200.
Immediate resistance on the upside is near 1.3440. The first major resistance is near the 1.3500 zone. The main hurdle sits at 1.3530. A close above the 1.3530 resistance might spark a steady upward move. The next major resistance is near the 1.3565 zone. Any more gains could lead the pair toward the 1.3620 resistance in the near term.
This article represents the opinion of the Companies operating under the FXOpen brand only. It is not to be construed as an offer, solicitation, or recommendation with respect to products and services provided by the Companies operating under the FXOpen brand, nor is it to be considered financial advice.
Bullish bounce?The Cable (GBP/USD) is falling towards the pivot and could bounce to the 1st resistance.
Pivot: 1.3328
1st Support: 1.3133
1st Resistance: 1.3636
Risk Warning:
Trading Forex and CFDs carries a high level of risk to your capital and you should only trade with money you can afford to lose. Trading Forex and CFDs may not be suitable for all investors, so please ensure that you fully understand the risks involved and seek independent advice if necessary.
Disclaimer:
The above opinions given constitute general market commentary, and do not constitute the opinion or advice of IC Markets or any form of personal or investment advice.
Any opinions, news, research, analyses, prices, other information, or links to third-party sites contained on this website are provided on an "as-is" basis, are intended only to be informative, is not an advice nor a recommendation, nor research, or a record of our trading prices, or an offer of, or solicitation for a transaction in any financial instrument and thus should not be treated as such. The information provided does not involve any specific investment objectives, financial situation and needs of any specific person who may receive it. Please be aware, that past performance is not a reliable indicator of future performance and/or results. Past Performance or Forward-looking scenarios based upon the reasonable beliefs of the third-party provider are not a guarantee of future performance. Actual results may differ materially from those anticipated in forward-looking or past performance statements. IC Markets makes no representation or warranty and assumes no liability as to the accuracy or completeness of the information provided, nor any loss arising from any investment based on a recommendation, forecast or any information supplied by any third-party.

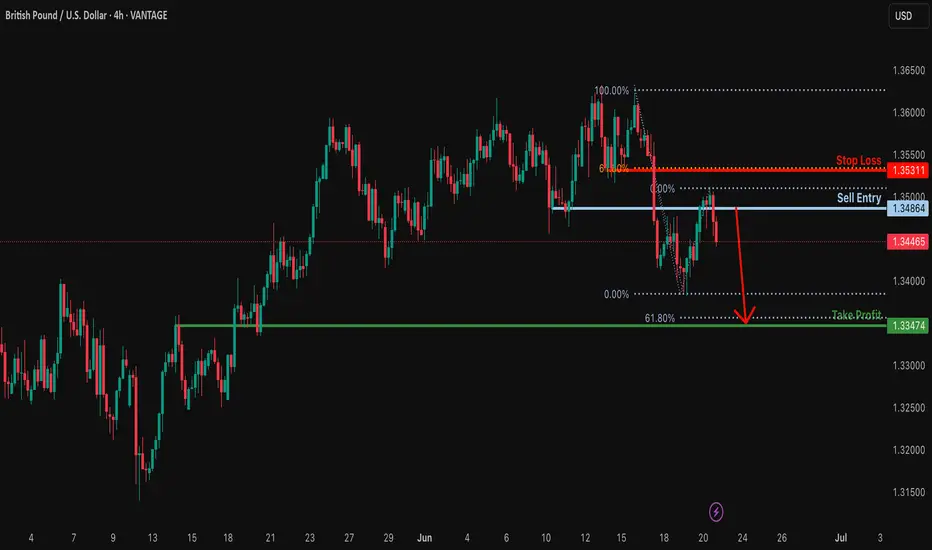
Bearish drop off pullback resistance?GBP/USD has rejected off the resistance level which is a pullback resistance and could drop from this level to our take profit.
Entry: 1.3486
Why we like it:
There is a pullback resistance level.
Stop loss: 1.3531
Why we like it:
There is a pullback resistance level that aligns with the 61.8% Fibonacci retracement.
Take profit: 1.3347
Why we like it:
There is a pullback support level that lines up with the 61.8% Fibonacci projection.
Enjoying your TradingView experience? Review us!
Please be advised that the information presented on TradingView is provided to Vantage (‘Vantage Global Limited’, ‘we’) by a third-party provider (‘Everest Fortune Group’). Please be reminded that you are solely responsible for the trading decisions on your account. There is a very high degree of risk involved in trading. Any information and/or content is intended entirely for research, educational and informational purposes only and does not constitute investment or consultation advice or investment strategy. The information is not tailored to the investment needs of any specific person and therefore does not involve a consideration of any of the investment objectives, financial situation or needs of any viewer that may receive it. Kindly also note that past performance is not a reliable indicator of future results. Actual results may differ materially from those anticipated in forward-looking or past performance statements. We assume no liability as to the accuracy or completeness of any of the information and/or content provided herein and the Company cannot be held responsible for any omission, mistake nor for any loss or damage including without limitation to any loss of profit which may arise from reliance on any information supplied by Everest Fortune Group.
GBPUSD UPTRENDIn short words - Donald trump is crashing America Economy. I can see GBPUSD touching 1.40000 remember I said this!
^ is your fundements today.
Use technical charting to find your pricing. I found mine in this chart.

BUY GBPUSDFOMC moved the greenback positively yesterday by alot of pips, we anticipate a decent bullish move since price action touched an area of strong resistance basing on historical data.

GBPUSD SHORTAdded to the position as a clear head and shoulders has formed on the lower time frame. Expecting price to move lower from here.
GBPUSD InsightHello to all subscribers.
Please feel free to share your personal opinions in the comments. Don’t forget to hit the booster and subscribe.
Key Points
- NATO’s 32 member countries have agreed to increase defense spending to 5% of GDP by 2035, as requested by U.S. President Trump.
- Federal Reserve Chair Jerome Powell, speaking before the Senate, stated that the Fed is "in a position to wait" and noted it is difficult to predict how tariffs will impact inflation.
- The Fed has decided to ease the Supplementary Leverage Ratio (SLR) regulation that applied to major banks. With the regulatory easing, large banks are expected to increase their purchases of U.S. Treasuries, which could lead to lower bond yields.
Key Economic Events This Week
+ June 26: U.S. Q1 GDP
+ June 27: U.S. May Personal Consumption Expenditures (PCE) Price Index
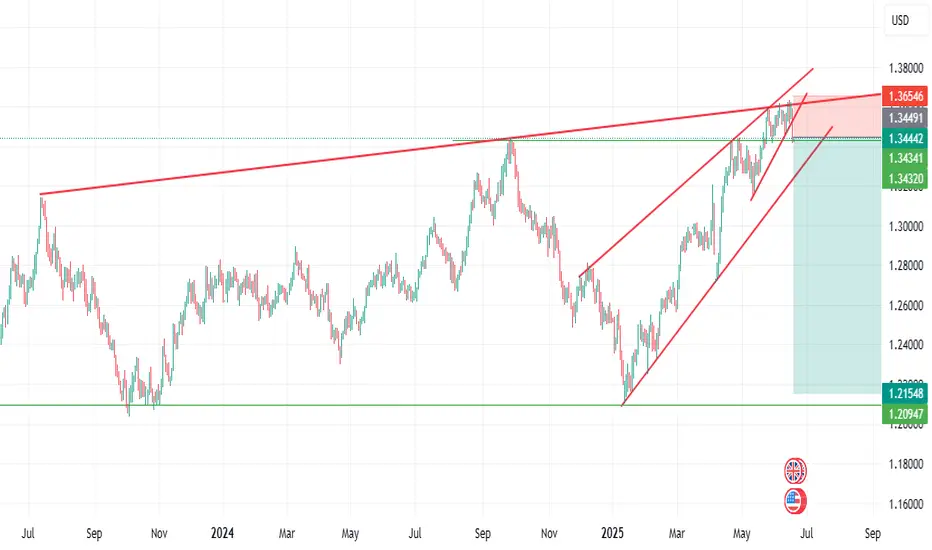
GBPUSD Chart Analysis
Although the pair pulled back after encountering resistance from the trendline, it successfully rebounded from the 1.34000 level and climbed to 1.37000. After breaking through the resistance this time, it is now likely to rise toward the upper trendline. The projected high is expected to be around the 1.40000 level.

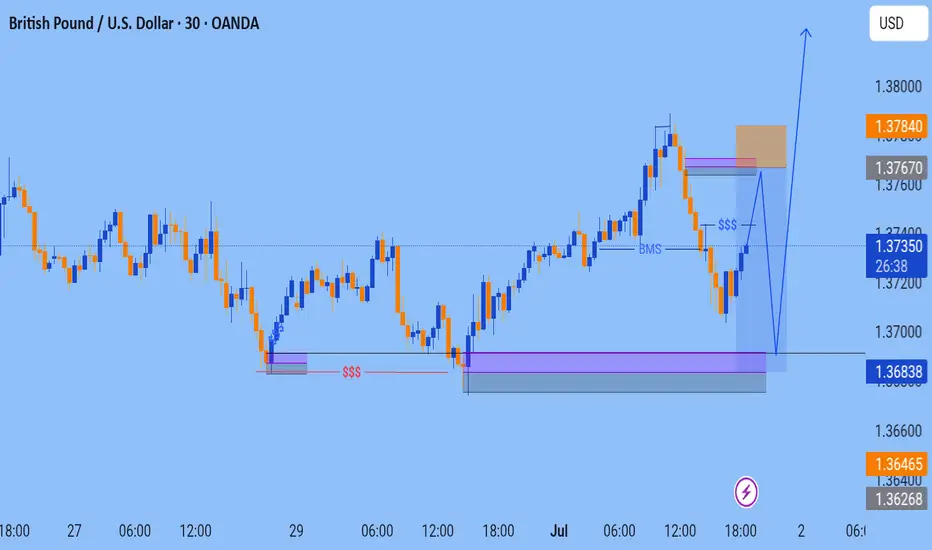
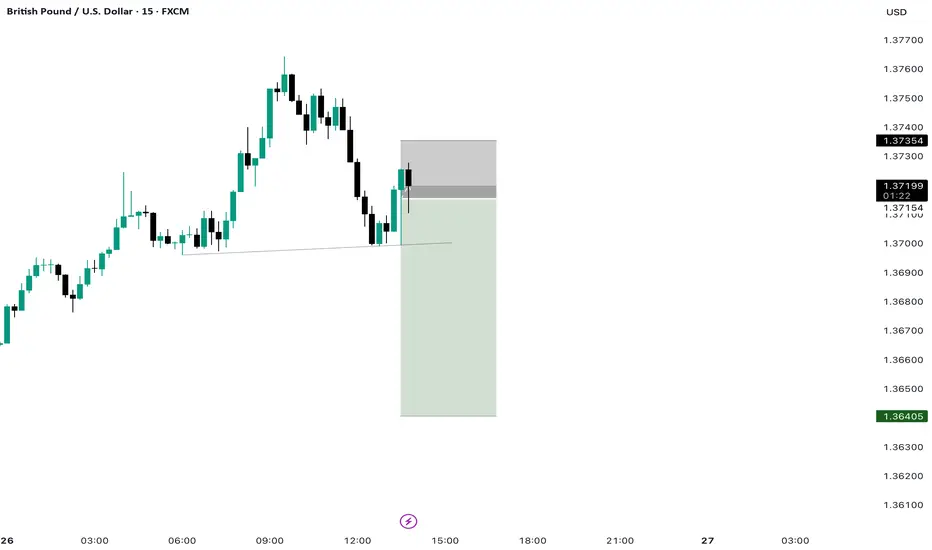
GBPUSD GBPUSD is currently exhibiting short-term bearish momentum, targeting the fresh demand zone at 1.36416.
This level aligns with a key order block that could act as a pivot for the next bullish leg.
As long as price holds above this zone, we anticipate a potential bullish reversal from 1.36416 on the 15-minute timeframe. We’ll be monitoring for confirmation and continuation to the upside from that level.

GBPUSD – Bullish Structure Holds, Waiting for a Clean RetestGBPUSD recently bounced strongly from the ascending trendline and hit resistance at 1.36300. The price is now slightly correcting, with a high probability of retesting the 1.35000 support zone – an area of FVG and technical confluence.
The bullish structure remains intact as long as price holds above this level. Positive UK Services PMI data further supports the medium-term uptrend.
Are you waiting for the pullback to jump in?

GBPUSD SHORT GBP/USD looks overextended and rejecting the 1.3750 level. At the same time, DXY is bouncing from the 97.00 support. This could suggest a possible pullback in GBP/USD.

GBPUSD Breakout and Potential RetraceHey Traders, in today's trading session we are monitoring GBPUSD for a buying opportunity around 1.35900 zone, GBPUSD was trading in a downtrend and successfully managed to break it out. Currently is in a correction phase in which it is approaching the retrace area at 1.35900 support and resistance area.
Trade safe, Joe.

GBPUSD.UK 10-Year Gilt Yield and Interest Rate
UK 10-Year Gilt Yield: The yield stands at 4.48% as of June 25, 2025, after touching a recent high of 4.73%. This elevated yield reflects persistent inflation and cautious market expectations for Bank of England policy.
Bank of England Interest Rate: The current policy rate is 4.25%. Markets expect potential cuts in August and November, possibly bringing the rate to 3.75% by year-end, but the BoE remains cautious due to inflation still above target.
The US dollar is at multi-year lows, pressured by political uncertainty around the Fed, rising expectations for rate cuts, and a broad shift in global risk sentiment away from the dollar
Investors remain cautious due to fiscal policy worries, including the impact of US government spending and debt levels, as well as geopolitical risks.
The market currently prices in two 25-basis-point Federal Reserve rate cuts by the end of 2025, likely in September and December, which influences bond yields.
The 10-year yield is a key benchmark for mortgage rates, corporate borrowing costs, and is often considered the "risk-free rate" in financial valuations
The US10Y stands at 4.29%-4.33%
and interest rate remains 4.25-4.5%
The 10-year yield remains a critical indicator of US economic health, inflation expectations, and monetary policy stance.
#GBPUSD

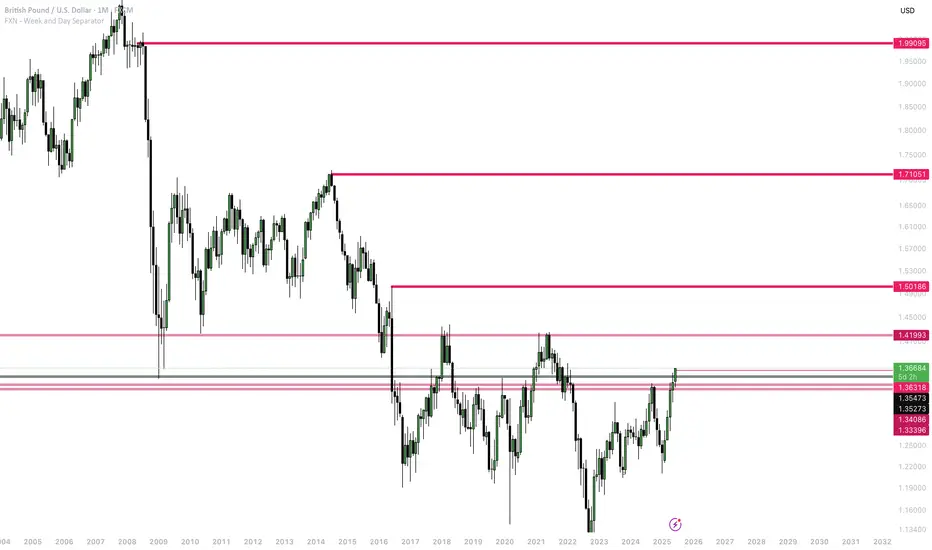
GBPUSD For A Long BuyDerived from the somewhat correlated nature of the EURUSD to the GBPUSD
Current level of resistance is 1.41993 (current buying objective)
Previous resistance 1.36318, now support. Price aiming for 1.41993.
Mid-term resistance level: 1.50186
Long-term resistance levels are 1.71051 and 1.99095
Mid-term and long-term levels will hold provided price breaks through the 1.41993 level, and the bullish bias remains the same.
GBPUSD is bearishFrom the chart, you will see that gbpusd is a long term bearish trade.
Reason;
1, In the bigger picture of the chart, you can an uptrend confirmation after the third touch
2, in the smaller picture you will see an ascending triangle
Wait for second trendline breakout for more confirmation and entry