GBP/USD BEARS ARE STRONG HERE|SHORT
Hello, Friends!
We are going short on the GBP/USD with the target of 1.344 level, because the pair is overbought and will soon hit the resistance line above. We deduced the overbought condition from the price being near to the upper BB band. However, we should use low risk here because the 1W TF is green and gives us a counter-signal.
Disclosure: I am part of Trade Nation's Influencer program and receive a monthly fee for using their TradingView charts in my analysis.
✅LIKE AND COMMENT MY IDEAS✅
GBPUSD_SPT trade ideas

Technical + Fundamental Alignment: GBPUSD Short in PlayGBPUSD ( FX:GBPUSD ) is moving near the Resistance zone($1.354-$1,350) and has managed to break the Support line .
In terms of Elliott Wave theory , it seems that GBPUSD has completed the Zigzag Correction(ABC/5-3-5) , we can expect the next five bearish waves .
--------------------------------------------------------
Fundamental Analysis
1-Weak UK Economic Data:
Recent reports including Retail Sales, Industrial Output, and PMIs have come in below expectations.
Labour market is softening, and wage growth is decelerating.
2-Dovish Expectations for BoE:
With inflation cooling down, the Bank of England is expected to hold or even cut rates soon, reducing support for the pound.
3-Stronger USD Outlook
Despite some weaker U.S. data, the Fed maintains a hawkish stance. U.S. retail sales and inflation still support the dollar overall.
4-UK Political Risk
Upcoming UK elections on July 4 are adding uncertainty and downside risk to GBP.
--------------------------------------------------------
I expect GBPUSD to attack at least the Support lines based on the above explanation.
Targets: 1.3
1)1.3353 USD =>Risk-To-Reward: 1.51
2)1.3315 USD =>Risk-To-Reward: 2.00
Note: Stop Loss(SL): 1.3549 USD
Please respect each other's ideas and express them politely if you agree or disagree.
British Pound / U.S Dollar Analyze (GBPUSD), 1-hour time frame.
Be sure to follow the updated ideas.
Do not forget to put a Stop loss for your positions (For every position you want to open).
Please follow your strategy and updates; this is just my Idea, and I will gladly see your ideas in this post.
Please do not forget the ✅' like '✅ button 🙏😊 & Share it with your friends; thanks, and Trade safe.

GBP/USD Robbery: Can You Grab the Cash Before the Cops Arrive?🚨 GBP/USD "The Cable" forex bank Heist Alert: The Bullish Breakout Robbery Plan (Swing & Scalp Strategy) 🚨
🌟 Hi! Hola! Ola! Bonjour! Hallo! Marhaba! 🌟
Attention Money Makers & Market Robbers! 🤑💰💸
Based on the 🔥Thief Trading Style🔥, here’s our master plan to loot the GBP/USD "The Cable" forex bank. Follow the strategy on the chart—focusing on LONG entries—and escape near the high-risk Red Zone. This area is overbought, consolidating, and a potential reversal trap where bears lurk. 🏆 Take profits fast—you’ve earned it! 💪
🎯 Heist Entries:
📈 Entry 1: "The Breakout Heist!" – Wait for Resistance (1.36200) to break, then strike! Bullish profits await.
📈 Entry 2: "Big Players’ Pullback!" – Jump in at 1.34000+ buy above at any price for a safer steal.
🔔 Pro Tip: Set a chart alert to catch the breakout instantly!
🛑 Stop Loss Rules:
*"Yo, listen! 🗣️ If you’re entering with a buy-stop, DON’T set your SL until AFTER the breakout. Place it at the nearest swing low (3H timeframe) or wherever your risk allows—but remember, rebels risk more! 🔥"*
🏴☠️ Target: 1.37500
🧲 Scalpers: Only play LONG! Use trailing SL to lock in profits. Big wallets? Go all in. Small stacks? Join the swing heist!
📊 Market Pulse:
The GBP/USD "The Cable" is neutral but primed for bullish momentum. Watch:
Fundamentals (COT, Macro, Geopolitics)
Sentiment & Intermarket Trends
Positioning & Future Targets & Overall score
📌 Check our bioo linkks for deep analysis! 🔗🌍
⚠️ Trading Alert:
News = Volatility! Protect your loot:
Avoid new trades during major news
Use trailing stops to secure profits
💥 Boost This Heist!
Hit 👍 & 🔄 to strengthen our robbery crew! Let’s dominate the market daily with the Thief Trading Style. 🚀💵
Stay tuned—another heist drops soon! 🎯🐱👤

GBPUSD 1H | Bearish Divergence GBPUSD has reached a critical technical zone where multiple confluences are signaling a downside correction:
✅ Bearish Divergence spotted on RSI at the top, indicating momentum exhaustion.
✅ Price got rejected from a strong Daily Supply Zone, showing clear institutional selling pressure.
✅ On the LTF (Lower Timeframe), structure has shifted — new Lower Highs (LH) and Lower Lows (LL) are now printing, confirming a short-term bearish trend change.
✅ Price also broke the LTF trendline and is retesting, adding further bearish confluence.
📊 Bias:
Expecting a corrective move to the downside with targets around previous liquidity zones:
⚠️ Market is still sensitive to USD fundamentals this week, so watch key news events for volatility spikes.
🔔 Wait for proper confirmations and manage risk accordingly.

GBPUSD I Montly CLS I KL WOB I Model 1Hey, Market Warriors, here is another outlook on this instrument
If you’ve been following me, you already know every setup you see is built around a CLS Footprint, a Key Level, Liquidity and a specific execution model.
If you haven't followed me yet, start now.
My trading system is completely mechanical — designed to remove emotions, opinions, and impulsive decisions. No messy diagonal lines. No random drawings. Just clarity, structure, and execution.
🧩 What is CLS?
CLS is real smart money — the combined power of major investment banks and central banks moving over 6.5 trillion dollars a day. Understanding their operations is key to markets.
✅ Understanding the behavior of CLS allows you to position yourself with the giants during the market manipulations — leading to buying lows and selling highs - cleaner entries, clearer exits, and consistent profits.
📍 Model 1
is right after the manipulation of the CLS candle when CIOD occurs, and we are targeting 50% of the CLS range. H4 CLS ranges supported by HTF go straight to the opposing range.
"Adapt what is useful, reject what is useless, and add what is specifically your own."
— David Perk aka Dave FX Hunter ⚔️
👍 Hit like if you find this analysis helpful, and don't hesitate to comment with your opinions, charts or any questions.

GU-Thu-26/06/25 TDA-GU rallying higher in NY-Asian session!Analysis done directly on the chart
Follow for more, possible live trades update!
I often share my live trades in Tradingview public chat in London session, stay tuned!
Losses are part of the game. We are risk takers,
we take losses but it's important to know how to
manage them properly. Not every day, every session
is good to trade. Being a good trader means valuing
more risk management over profits.
Active in London session!
Not financial advice, DYOR.
Market Flow Strategy
Mister Y

GBPUSD Changing from bullish to bearish market We had a clear break of structure on the support and currently had a retest on our 0.5 and 0.6 zone, market is ready to go bearish.

GBP_USD WILL KEEP GROWING|LONG|
✅GBP_USD broke the key structure level of 1.3620
While trading in an local uptrend
Which makes me bullish biased
And I think that after the retest of the broken level is complete
A rebound and bullish continuation will follow
LONG🚀
✅Like and subscribe to never miss a new idea!✅
Disclosure: I am part of Trade Nation's Influencer program and receive a monthly fee for using their TradingView charts in my analysis.

GBPUSD is in the Selling DirectionHello Traders
In This Chart GBPUSD HOURLY Forex Forecast By FOREX PLANET
today GBPUSD analysis 👆
🟢This Chart includes_ (GBPUSD market update)
🟢What is The Next Opportunity on GBPUSD Market
🟢how to Enter to the Valid Entry With Assurance Profit
This CHART is For Trader's that Want to Improve Their Technical Analysis Skills and Their Trading By Understanding How To Analyze The Market Using Multiple Timeframes and Understanding The Bigger Picture on the Charts

Short trade
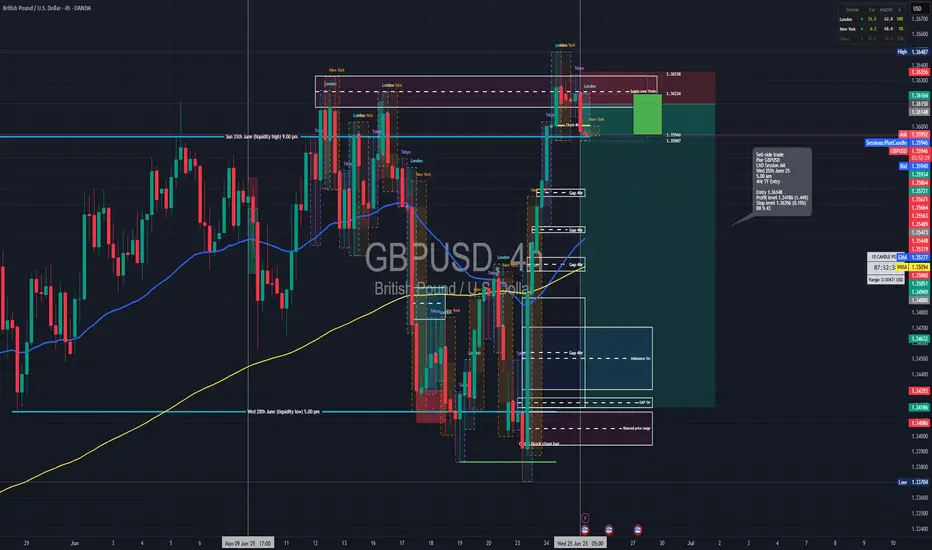
🔻 Trade Journal Entry – Sell-side Trade
📍 Pair: GBPUSD
📅 Date: Wednesday, June 25, 2025
🕒 Time: 5:00 AM (London Session AM)
⏱ Time Frame: 4 Hour
📉 Direction: Sell-side
📊 Trade Breakdown:
Metric Value
Entry Price 1.36148
Profit Level 1.34186 (−1.44%)
Stop Loss 1.36356 (+0.15%)
Risk-Reward
Ratio 9.43 : 1
🧠 Context / Trade Notes:
4HR OB Rejection in Premium Zone:
Entry taken off a confirmed bearish order block after price tapped into a premium zone at the top of the internal range.
London Session Liquidity Sweep:
Trade captured the classic London stop-hunt above a short-term high, initiating a sell-off and confirming smart money movement.
Sell GBPUSDGBPUSD looking to go short from the resistance. This resistance has proven a strong barrier for price as observed. Sells here with the stop loss just hovering above 1,365

GBPUSD LONGS Price is forming higher highs and higher lows on the 15-minute timeframe, while 70% of retail traders remain positioned short

GBPUSD is bearishFrom the chart, you will see that gbpusd is a long term bearish trade.
Reason;
1, In the bigger picture of the chart, you can an uptrend confirmation after the third touch
2, in the smaller picture you will see an ascending triangle
Wait for second trendline breakout for more confirmation and entry
GBPUSD is in the Selling DirectionHello Traders
In This Chart GBPUSD HOURLY Forex Forecast By FOREX PLANET
today GBPUSD analysis 👆
🟢This Chart includes_ (GBPUSD market update)
🟢What is The Next Opportunity on GBPUSD Market
🟢how to Enter to the Valid Entry With Assurance Profit
This CHART is For Trader's that Want to Improve Their Technical Analysis Skills and Their Trading By Understanding How To Analyze The Market Using Multiple Timeframes and Understanding The Bigger Picture on the Charts

GBPUSD Price Action Analysis | Sell Setup Below 1.36106In this GBPUSD market overview, we break down recent price action following yesterday’s strong bullish rally from the momentum low. The session was highly emotional across major forex pairs, which is typical when a major wave structure reaches its end. This often results from incomplete auctions on one side of the market, causing order flow imbalances that drive sharp price movements.
The key price level we're watching on GBPUSD is 1.36326. Price approached this zone with momentum, and the rejection at 1.36267 triggered a classic TCP (Trend Changing Pattern), followed by a single upside break, confirming exhaustion at the highs.
📉 Sell Setup:
According to the Waves of Success execution model, the best short entry is below 1.36106, in alignment with the prevailing bearish structure.
⚠️ Alternative Scenario:
We are not looking for long setups on GBPUSD at this time — our bias remains bearish unless significant structure changes occur.
This analysis combines wave structure, trend confirmation patterns, and institutional price levels for a professional, risk-managed approach.
🔑 Key Levels:
Resistance: 1.36326
Rejection High: 1.36267
Sell Trigger: 1.36106

GU-Wed-25/06/25 TDA-GU consolidating now!Analysis done directly on the chart
Follow for more, possible live trades update!
I often share my live trades in Tradingview public chat in London session, stay tuned!
Market is fractal, what happens in higher timeframe.
It repeats on lower timeframe but with more noise.
The lower timeframe we go the more technical
analysis is required as price in general is not
subjected to fundamental news as the higher
timeframe does. (Even though fundamental analysis,
is essential no matter what timeframe you trade)
Active in London session!
Not financial advice, DYOR.
Market Flow Strategy
Mister Y

GBPUSD SellDaily Cycle. Price should continue lower as a lot of liquidity as been built on the low. First TP is Asia low.

GBPUSD: The Bearish Setup Remains IntactGBPUSD: The Bearish Setup Remains Intact
From our previous analysis we can see that GBPUSD remains bearish despite not having broken down yet.
The war is not affecting the strength of the US dollar and may perhaps become stronger at a time when we expected the US dollar to show slight weakness given that the war could become more serious.
However, as I have explained before, this is not the first time that the US has been involved in a war.
You may watch the analysis for further details
Thank you and Good Luck!
❤️PS: Please support with a like or comment if you find this analysis useful for your trading day❤️
Disclosure: I am part of Trade Nation's Influencer program and receive a monthly fee for using their TradingView charts in my analysis.

Nothing more beautiful than thisgbpusd has shown an uptrend for the past few months, did you get the picture?
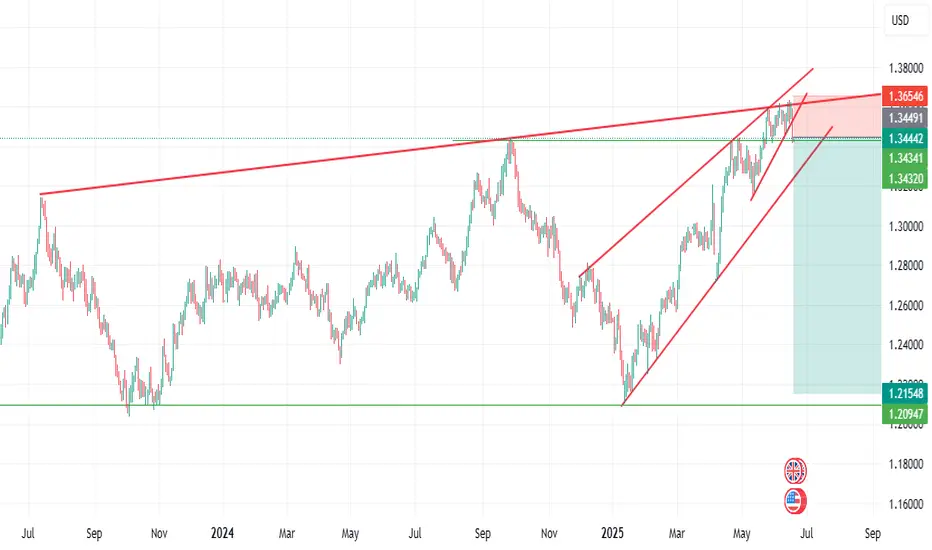
GBP/USD Cable Launch from Fibo SupportThe Fibonacci level at 1.3414 has put in some work on GBP/USD over the past year. In Q3 of 2024 it held the highs over a two week period, leading into the sell-off in Q4. And then in April of this year, it once again held the highs, but this time, the pullback was brief and buyers were able to power through a month later.
And now, over the past two weeks, this has been support for the pair, coming into play after the FOMC rate decision last week and now leading to a push up to fresh multi-year highs.
The currently weekly candle is showing as a bullish engulf and this highlights a market that's tough to chase. But, shorter-term, there's higher-low support potential at both 1.3593 and 1.3500, which could function as support on shorter-term approaches in the pair. - js

GBPUSD Technical Analysis! SELL!
My dear friends,
GBPUSD looks like it will make a good move, and here are the details:
The market is trading on 1.3622 pivot level.
Bias - Bearish
Technical Indicators: Supper Trend generates a clear short signal while Pivot Point HL is currently determining the overall Bearish trend of the market.
Goal - 1.3558
Recommended Stop Loss - 1.3653
About Used Indicators:
Pivot points are a great way to identify areas of support and resistance, but they work best when combined with other kinds of technical analysis
Disclosure: I am part of Trade Nation's Influencer program and receive a monthly fee for using their TradingView charts in my analysis.
———————————
WISH YOU ALL LUCK

GBPUSD ShortElite Live Analysis – GBPUSD
Market Structure: Price has tapped into the Daily Market Structure zone.
Price Action: Current structure and price action indicate signs of a potential reversal.
Strategy: This setup follows a Structure-to-Structure approach.
Targets:
Lower liquidity pools below price
Main target: retest of the Daily Market Structure zone

GBPUSD: Bearish After Opening 🇬🇧🇺🇸
There is a high chance that GBPUSD will drop after the market opening.
I see a strong bearish confirmation after a test of a recently broken trend line.
The price formed a head & shoulders pattern and violated its neckline
on an hourly time frame.
Goal - 1.3425
❤️Please, support my work with like, thank you!❤️
I am part of Trade Nation's Influencer program and receive a monthly fee for using their TradingView charts in my analysis.
