AMD trade ideas
AMD analysis What I’m seeing here is that the price made a false breakout below the 200 EMA, just like it did in the previous move back in early 2023. It dipped below, tricked a lot of people, then snapped back up strong.
Now it’s kind of repeating that same behavior another fake break below the 200 EMA and a bounce If history repeats we might see a similar upside move from here.
Just my personal view — not financial advice. Markets are unpredictable, so always be cautious.

AMD DAILY CHART NEEDS A WAVE 5 NORTH TO COMPLETE THE MOTIVE WAVECharts like the 27.8% Fib level even more than the 61.8 Golden Ratio! Also, the Bank Liquidity shown by the Golden line indicator is selling, so it's likely a market manipulation north on retail candles, creating a Bull-Trap on wave 5 before the drop! Since it's very risky at the moment to go Long, we're going Short at 127!

AMD Shorts?Already out of the intraday positions. Looking at this for possible short opportunity. The technicals are there to support the setup even though indices are bullish. Risk free on this trade and will take partials along the way, doesn't need to hit full TP. Indices retracements can favor this trade.

AMDWell, price made it into the box as I had forecasted. Is the pattern done for now to the upside? We cannot say yet, but if it does move higher, we should be looking to the 1.618 @ $126.16 for a reaction. I think another high to the 1.618 would fit great into the pattern after some slight consolidation to lower MACD. If we can do that before making another high, we would be carving out some neg div to help push price down for minor B.
Once we do in fact have a top in place for minor A, I will draw some fibs to help track the move lower. As of now, I am seeing the $85-$92 area for B to drop to.
Eventually, I see this pattern up in the $150-$180 range for the (B) wave completion. It will be some time before (B) completes though. (A) took 13 months to complete. If (B) follows suit that means it won't be done until around April-May 2026.
Let me know if you have any questions.

What is Opening Range Breakout (ORB)Hello mates today i want to share an Educational post about Opening range breakout a very common and old strategy used by many traders and it's still pretty effective. I hope you will read the complete post and like my publication too friends.
So let's understand about Opening Range Breakout below-::
⚡Introduction to Opening Range Breakout-::
In the world of trading timing can be everything. One of the strategies that traders use to capitalize on market movements at the start of the trading day is the Opening Range Breakout (ORB). This technique is particularly popular among day traders because it leverages the market's early volatility to make quick profits. In this article we'll dive deep into what ORB is, how it works, and how traders can effectively use it.
⚡What is the Opening Range-::
The "opening range" refers to the price range established during the first few minutes of a trading session. This range is defined by the high and low prices observed within this period. Depending on the trader's preference and the asset being traded, this range can be set over different time intervals, commonly 5, 15, or 30 minutes.
⚡Understanding the Breakout-::
A breakout occurs when the price moves outside the opening range, either above the high or below the low. This movement indicates a potential direction for the day's trend. The idea behind the ORB strategy is that the price, once it breaks out of this range, is likely to continue moving in that direction, giving traders a chance to enter a position early in the day and ride the trend.
⚡Why Use ORB-::
1.Early Market Volatility-: The market often shows significant volatility at the opening bell, driven by overnight news, earnings reports, and economic data. This creates opportunities for sharp price movements.
2.Defined Risk and Reward-: Since the opening range is defined, traders can set clear entry, stop-loss, and take-profit levels, making risk management straightforward.
3.Capturing Early Trends-: ORB allows traders to capture trends early, often before the broader market catches on. This can lead to significant profits in a short period.
⚡How to Implement the ORB Strategy-::
1-Identify the Opening Range-: At the start of the trading session, observe the price action and note the high and low points within your chosen time frame (e.g., the first 15 minutes).
2-Set Breakout Levels-: Once the opening range is established, these levels (the high and low) become your breakout levels.
3-Place Orders-::
Long Position-: If the price breaks above the high of the opening range, enter a long position (buy).
Short Position-: If the price breaks below the low of the opening range, enter a short position (sell).
4-Set Stop-Loss-: A common approach is to place a stop-loss just inside the opening range. For example, if you enter a long position, your stop-loss might be slightly below the high of the range.
5-Set Profit Targets-: Profit targets can be set based on a fixed ratio (e.g., 2:1 risk/reward ratio), or by trailing the stop-loss as the price moves in your favor.
⚡Factors to Consider for ORB Success-::
1-Market Conditions-: ORB tends to work best in markets with high liquidity and volatility. Stocks with news catalysts, or major indices, are often good candidates.
2-Time Frame Selection-: The choice of the opening range time frame is critical. Shorter time frames (e.g., 5 minutes) might offer more frequent signals, but they can also lead to more false breakouts. Longer time frames (e.g., 30 minutes) may provide more reliable signals but fewer opportunities.
3-Volume Confirmation-: It's often wise to confirm breakouts with an increase in volume, which can indicate the strength of the move.
4-Avoiding False Breakouts-: Not every breakout leads to a sustained move. To avoid false breakouts, some traders wait for a retest of the breakout level or use additional technical indicators, such as moving averages or momentum oscillators, to confirm the trend.
⚡Example of ORB in Action-::
Let’s consider a stock that has an opening range of 100 to 105 in the first 15 minutes of trading. Here’s how a trader might approach this:
Breakout Above 105-: The trader places a buy order at 105.10 (a little above the breakout level) and sets a stop-loss at 104.50 (just below the high of the opening range). The profit target might be set at 107.20, assuming a 2:1 reward-to-risk ratio.
Breakout Below 100-: Alternatively, if the stock breaks below 100, the trader could short the stock at 99.90 with a stop-loss at 100.50 and a profit target at 97.80.
⚡Advantages of ORB-::
Clarity-: The strategy provides clear entry and exit points, reducing guesswork.
Structure-: It imposes discipline by setting predefined rules for trading.
Simplicity-: ORB is relatively simple to understand and execute, making it accessible to traders of all experience levels.
⚡Challenges and Limitations-::
False Breakouts-: These can lead to losses if not managed carefully.
Whipsaws-: In highly volatile markets, prices might break the range multiple times, leading to potential whipsaws.
Over-Reliance on Opening Range-: Solely relying on the opening range might ignore broader market context or trends from previous days.
⚡Conclusion-::
The Opening Range Breakout strategy is a powerful tool in a trader's arsenal, particularly for those who thrive on early market action. While it offers a structured approach to capturing trends, success with ORB requires discipline, proper risk management, and an understanding of market conditions. By combining ORB with other strategies or indicators, traders can increase their chances of capturing profitable moves while minimizing risks.
Whether you’re a seasoned trader or just starting, mastering the ORB strategy can provide you with the edge needed to navigate the fast-paced world of day trading.
Thanks for reading the post, I hope you will like the information shared above and like my idea too.
Best Regards- Amit

AMD BIAS UPSIDE with $80 Support18 May 2025
AMD – Watching for Bullish Confirmation
We’re closely monitoring AMD as it approaches the 200-day moving average on the weekly chart. A break above this level would signal a confirmed shift back to a bullish trend.
Previously, when AMD dropped below $100, it took six weeks to reclaim that level—a strong bullish signal. That false breakdown offered a great entry opportunity for those who accumulated below $100.
If you missed that move, consider watching for a slight pullback in the coming trading days to potentially enter. As long as AMD holds above the recent low around $80, our bias remains firmly to the upside.
Strategy: Wait for confirmation above the weekly 200MA or accumulate on pullbacks while $80 holds as support.

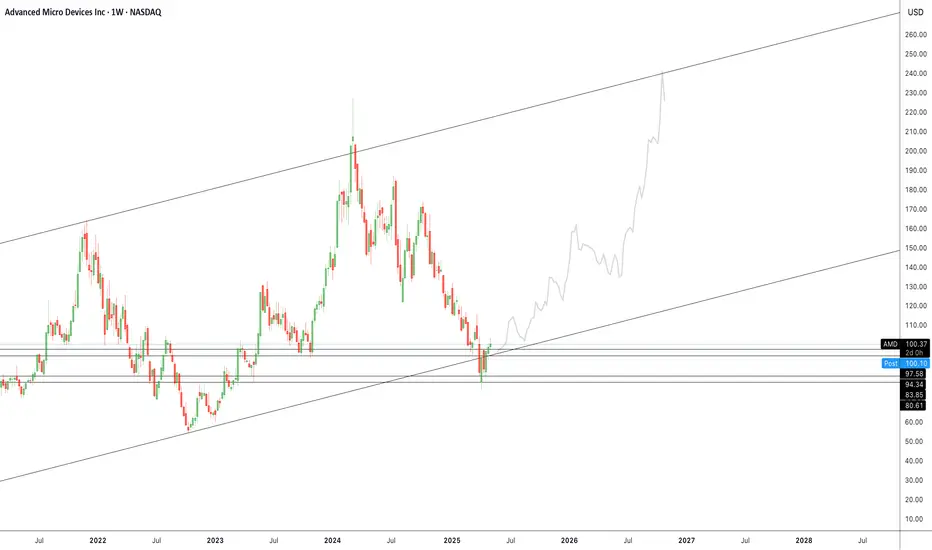
AMD Break-out above this level means new ATH at $300.Advanced Micro Devices (AMD) is on a recovery attempt following the April 07 2025 bottom, which is technically a Higher Low on the 3.5-year Channel Up. This week it broke above the first Resistance level of this attempt, the 1W MA200 (orange trend-line), which is key as it had 2 rejections since February 18 2025.
However the biggest Resistance test is right above it and consists of a strong Cluster of the 1D MA200 (green trend-line), the 1W MA50 (blue trend-line) and the Lower Highs trend-line from the All Time High (ATH).
The previous Bullish Leg of the Channel Up (started on October 10 2022), consolidated for 1 month once it broke above this Resistance Cluster (blue circle) and then marched towards the pattern's Higher High, which was naturally a Higher High.
The similarities between the Legs are striking, the Bearish Legs (both declined by -66.86%) were confirmed by 1W MACD Bearish Cross and the Bullish Legs by a Bullish Cross, which the 1W MACD just completed last week.
This is a major confirmation and technically the earliest for a long-term Buy. Assuming again that the symmetry will continue to hold on this emerging Bullish Leg, we can expect it rise by +318.17% as well. Based on that, our long-term Target on AMD is $300.
-------------------------------------------------------------------------------
** Please LIKE 👍, FOLLOW ✅, SHARE 🙌 and COMMENT ✍ if you enjoy this idea! Also share your ideas and charts in the comments section below! This is best way to keep it relevant, support us, keep the content here free and allow the idea to reach as many people as possible. **
-------------------------------------------------------------------------------
💸💸💸💸💸💸
👇 👇 👇 👇 👇 👇

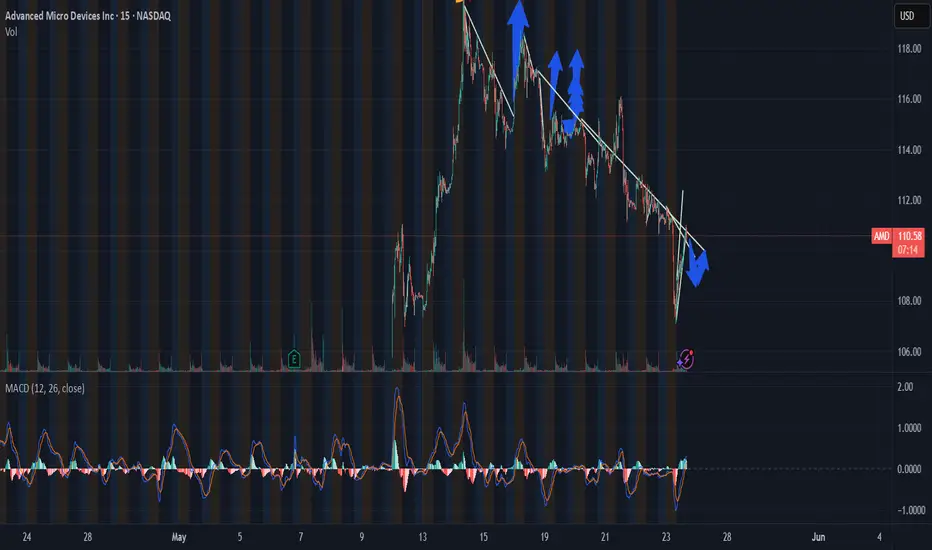
AMD – time to wait for a better priceAfter a strong rally to the $113–114 level, NASDAQ:AMD is showing signs of a pullback. The 4H chart suggests a potential correction to the $105 area, representing a -7.8% move. Watching for price action near the lower Bollinger Band and support zones as potential re-entry points.

AMD CALLSValuation is now ~25x forward earnings (down from >30x).
CEO Lisa Su reported a strong Q1 2025 with double-digit revenue growth and a 50% gross margin.
Investment view: AMD is a solid value play in the rapidly growing AI hardware market.
CHOCH
Retesting a Breakerblock / Breakout.
$140 Target.

Let's talk about buying, FOMO, time line ,etcTo put things in context, the time frame you are looking to LONG a stock is important. If you are trading, be it day trading or swing trade for a few months then the entry price becomes more important.
In this chart, we can see that the price action has yet to breakout from the bearish trend line which means that could be a retracement coming up OR it could continue to rally and break out from it. So, we wait and not anticipate the market moves.
Let not the fear of missing out pressure you into buying. WHY? Say I am right/lucky and the price did retrace to say somewhere 103.16 but your longed at 117. That is a paper loss that you need to stare at daily , perhaps more than once. Now, if you are crystal clear why you go LONG on this counter, then fine! Short term , the market is a casino and longer term, it is a weighing machine ( I dunno who said that)
Therefore, the pre-investment HOMEWORK becomes essential than the clicking BUY button which takes less than 30seconds to execute. Now you see why some brokers have near instantaneous funds transfer and not 2-3 working days. This pause or window period is much like you going shopping and was so adamant to get that new dress/device/shoes whatever it is. Then you realised you have to rush off to somewhere and reminded yourself to come back hours/days later.
During this cooling period, your mind starts to rationalise or justify the reasons for buying. Have you done enough research? Is there a better company to buy? Is the price right ? Will I need the cash for something else ? And that should be the way especially if you are a responsible family man with 1 wife and 2 kids to take care of.
IT is hard, trust me to not be attached to a company, actually is the perceived profits making opportunity rather than the actual company itself. Be it Amazon or Dazon, if the company generates 20% profits for you every year, you would be biased and stay close to finding out as much as possible to accelerate your profits again.
FOMO - one of the worst thing that can happen in investment or trading .But FOMO happens everywhere . See the upcoming Christmas Sale, closing down sale, buy 2 get 1 free, exclusive membership, etc . All these advertisements have the effect of FOMO on consumers and the majority falls for it , never mind if they have now move to ONLINE model to entice you since Social media is now the norm.
So, let's wait a while...........take a deep breath , no rush ...........

AMD – The Underdog Nobody’s Ready For (Yet).NASDAQ:AMD just cleared $104 after-hours and it's still wildly underestimated. While the world chases headlines, AlphaPulse signals are quietly lighting up on what could be one of the biggest tech runners of the summer.
📈 $115? Just the warm-up. Real upside is MUCH higher.
Why AMD Could Explode This Summer:
RSI (14): Steady at ~66 — momentum building, not overbought. Room to run.
MACD: Clean bullish crossover just confirmed on daily and weekly — early stage trend ignition.
Volume Profile: Huge void above $116 → $126 = fast move zone once we clear $115.
200D MA: Reclaimed with conviction — bull cycle reinstated.
Fib Extension: 1.618 points to $131–$135 range from previous pivot base.
Options Flow: Institutional sweeps hitting $120+ calls — whales are positioning.
AlphaPulse Squeeze Signal: Triggered on daily & 4H. Coiled tight → ready to detonate.
Underdog Setup: Nvidia hogs the spotlight, but AMD has lower float, better consolidation, and is lagging = catch-up potential.
AlphaPulse Bot Fired:
"💥 Coil Break: AMD $111.5"
"🚨 Summer Momentum Mode Activated"
"🎯 Upside Target Range = $115 → $131"
📍 Target #1: $115
📍 Target #2: $125
📍 Summer Target: $131+
🛡️ Stop Loss: $102.50
⏱️ Time Horizon: 1–6 weeks swing
As always safe Trades

$NVDA In, $AAPL Out – AI Supercycle May Be Just Starting🚨 JUST IN: NASDAQ:NVDA surpasses NASDAQ:AAPL to become the second-largest company in the world, right behind $MSFT.
And if that wasn’t enough:
Trump calls Nvidia’s Huang "my friend"
Hints that Nvidia replaces Apple as his go-to tech ally
Meanwhile, Bloomberg reports Nvidia could ship 500,000 AI chips yearly to the UAE until 2027 under revised export rules.
Jensen Huang also confirmed Saudi Arabia is building massive GPU factories, describing them as “energy in, intelligence out” systems.
⚠️ The market may be waking up to the reality that AI is not as cyclical as many feared.
🔍 On the chart:
NASDAQ:NVDA broke to a higher high (HH)
NASDAQ:AMD testing lower high (LH) breakdown resistance
Could AMD follow Nvidia’s breakout? The setup is there.

$AMD - Work In Progress! Analysis and Targets - 05/14/2025JUST IN:
NASDAQ:AMD announced a new $6 Billion share buyback program, bringing its total buyback plan up to 10B
NASDAQ:AMD technically completed a complex correction structure at $76.48. New upswing is underway to expected targets!
Cheers 😊👍

AMD Earnings About To PrintTechnical Analysis NASDAQ:AMD
RSI: 🟡 Near overbought but showing strength
MACD: 🟢 Bullish crossover in progress
Support: $96.84 → $93.64 → $90.00
Resistance: $100.75 → $101.72 → $103.96
Key Level to Watch: $100.75 (immediate resistance)
💰 Earnings Play
🎯 Trade Signal: BUY
✅ Justification
Recent uptrend confirmed by bullish MACD crossover with price action above key short-term MAs. Strong momentum heading into earnings with positive sentiment from analysts.
⚠️ Risk Management
Stop Loss: $93.64 (-5.2%)
Expected Range: $93.64 to $103.96
Best AI Generated Signals.
Stay Alpha

AMD: full reversal is now the most likely scenarioAMD price action sends a clear message: the bearish trend since March 2024 is over. A full reversal toward higher prices is now the most likely scenario, as long as it holds above the 103–105 zone.

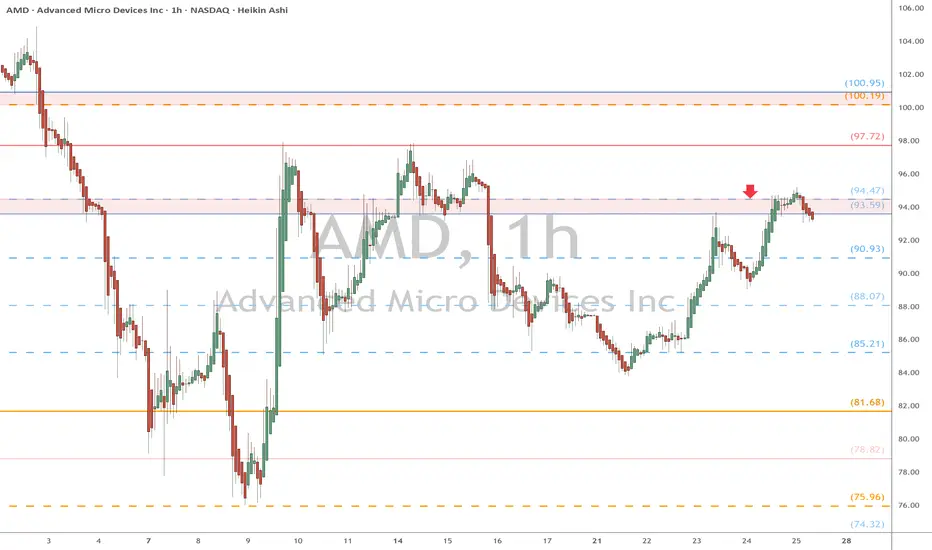
AMD watch $93.59-94.47: Key resistance to Tariff Recovery wave AMD trying to recover along with the general chip sector.
Currently testing a key resistance zone at $93.59-94.47
Pullback from here expectable, Break would show strength.
$AMD Tradespoon - Long Entry $98.99Description: Tradespoon model generated long signal for NASDAQ:AMD . Predicted range: $98.99–$102.65. Trend: -1.61%. NASDAQ:AMD

AMD UpdatePrice has managed to slowly continue grinding higher towards the target box. I have no reason at this time to believe it won't make it into the target area. MACD is slowly building bearish divergence setting up a move lower in the near future.
The question is what comes after this move higher. Is it the minor A of intermediate (B), or is it just another wave 4 of C of (A)? Unfortunately, we won't know for some time, I think. The key details to answer this question will come during the next move lower.
Should we still be in (A), then we will be visiting the $60's during the next move lower. If we're in (B) already, then the $82-$95 area will be our target depending on how high this current move takes us. Patience my friends. This job takes patience. AMD, IMHO, just isn't a good investment currently. Is there money to be made? Absolutely, but at what risk? When the pattern becomes this muddy and iffy, I stay out on the sidelines. There are plenty of other avenues to trade. Currently, I am watching Coinbase and Tesla the most. Coinbase, if I am right, will have a BIG opportunity coming up in the next few weeks. I'm talking $100+ PER share. Why would I waste my time taking undue risks on a shaky pattern? If you use common sense, it is a no brainer.

$AMDNASDAQ:AMD has solid chips and strong data center growth, but competition is heating up fast. Valuation looks pricey I expect a healthy pullback to attract more investors in the second half of 2025. Time to stay sharp and patient.

"AMD at a Crossroad: Order Block Pressure vs Buyer Strength"
🔍 AMD Multi-Timeframe Trend Analysis – From 15m to Daily Confirmation
✅ 4H Timeframe – Bullish but Near Completion
On the 4-hour chart, AMD has shown a strong uptrend, with clear reaccumulation zones on both AO and RSI.
However, price is now approaching a Cloud Zone, suggesting the 4H structure is likely nearing completion.
Despite this, momentum remains strong—RSI is above 50 and AO is still in green territory → buyers are not exhausted yet.
🔁 Cross-Check with 15-Minute Chart: Is the 4H Reversing?
To validate a possible 4H reversal, we move to the 15-minute chart.
Here, price action is currently in a sideways bullish structure, and the Confirmation Trigger (ChoCH) has not been broken to the downside.
This tells us:
🔹 No major bearish reversal yet
🔹 Market is consolidating, likely preparing for a decision.
🔍 Daily Timeframe – Still Bullish, But Facing Volume-Based Resistance
On the daily chart:
AMD is clearly bullish and in a reaccumulation phase.
But it is now confronting a major order block, aligned with volume-based resistance, right at the Confirmation ChoCH level of the daily chart.
⚠️ Key Trigger Zones to Watch:
📈 If price holds above the daily Confirmation Zone (~$109) → the bullish trend continues.
🤔 If price stays below this zone → expect continued sideways action.
🔻 If price breaks below $99 → this may trigger a full bearish shift, opening the door to further downside momentum.
✅ Final Outlook:
4H trend is nearing exhaustion but not yet broken.
15m chart is still bullish-sideways → no confirmed reversal yet.
Daily trend remains bullish but order block pressure is real.
💡 Use ChoCH Confirmations + AO/RSI alignment on 15m and 4H to validate your entries.

Advanced Micro Devices (AMD): Trend Reversal + AI Compute DemandOverview Summary
Advanced Micro Devices NASDAQ:AMD is testing a structurally critical support zone following a prolonged correction from all-time highs. While short-term price action reflects macro uncertainty, long-term positioning across AI, data centers, and gaming chips sets AMD up for an asymmetric risk/reward play—especially as we head into a new semiconductor investment super-cycle.
Key Drivers of the Thesis
Fundamentals & Financial Positioning
Revenue: $22.7B (TTM), down YoY due to cyclical headwinds in PC and gaming sectors.
Gross Margin: Healthy at 47%, reflecting resilience in high-margin data center and embedded segments.
Cash & Liquidity: $5.8B in cash with manageable debt, giving AMD dry powder to continue R\&D and M\&A without over-leveraging.
Valuation: P/E 39, slightly elevated, but forward P/E compresses into the 20s on 2025 estimates as AI revenue kicks in.
Guidance: Focused on high-growth verticals—AI, HPC (high-performance computing), and adaptive SoCs.
Industry & Competitive Landscape
Tailwinds: Global AI boom, sovereign chip independence (U.S. Chips Act), hyper-scaled demand.
Competition: NVIDIA dominates GPU/AI inference, but AMD’s MI300X (AI accelerator) has gained traction with Microsoft and Meta.
Moat: Advanced chip architecture (Zen 5 roadmap), Xilinx acquisition, and new FPGA/AI product launches.
Risk: Intel rebounds, and Arm-based chip innovation is catching up. However, AMD remains competitively priced and positioned between Intel (volume) and NVIDIA (premium AI).
Trade Setup (If Support Holds)
Entry Zone: $90.00–$100.00
Target 1: $150.00
Target 2: $220.00
Invalidation: Weekly Close Below $80.00
Technical Analysis (Refer to Chart)
Long-Term Channel: AMD is currently bouncing from the lower trend-line of a multi-year ascending channel.
Demand Zones: Strong confluence around $80–$94 (historical support + psychological + FVG fill zone).
Volume Profile: Heavy accumulation volume around $90–100—likely smart money positioning.
Forecast Path: If this zone holds, AMD could revisit prior highs ($150), with $180–200 as a mid-term target and long-term possibility towards $250+ with broader tech rally continuation.
Market Sentiment & Macro Factors
U.S. Interest Rates: Peak rate environment could signal risk-on appetite ahead, benefitting tech.
AI Capital Flows: Institutional investors are rotating into semiconductor enablers of AI infrastructure—AMD is a clear beneficiary.
Global Supply Chain Stability: Any future China–Taiwan tensions could raise AMD’s premium due to U.S.-based diversification.
Risks & Challenges to Monitor
AI revenue upside may already be partially priced in short term.
Fierce pricing pressure from NVIDIA, Intel’s foundry expansion, and custom silicon from Apple/Google.
Continued weakness in PC market segment may drag performance despite data center tailwinds.
Technical invalidation below $80 would suggest structure weakness or macro risk-off phase.
Final Take
AMD offers a fundamentally sound, technically discounted, and thematically aligned play for investors looking to gain exposure to AI, HPC, and the broader semiconductor growth thesis. With structurally significant support aligning with longer-term mega trends, this is a forward-thinking asymmetric setup with intelligent risk controls and multi-year upside potential.
Amd Break Above $104 Long To The MoonI Know A lot of people Dont Like AMD lol But it Might Just Be there< Ready To Breakout!!!
Earnings And If Spy Holds and runs This Forcast Is Very Well in The Books for it
📈 AlphaPulse Multi-Timeframe Forecast: NASDAQ:AMD
📍 Current Price: $100.59
🔍 Active Patterns: True S/R Zone, Channel Upside Breakout, Overbought Channel Position
🔀 Recent Crosses: Bullish 8/21 EMA Cross
🌐 Market Structure:
• Primary Trend: Mixed/Slightly Bearish
• Trading Bias: Bullish (49.2% confidence)
• Ideal Timeframe: weekly (Strength: 8)
🎯 Bullish Price Targets:
• Conservative: $113.15 (+12.48%)
• Primary Target: $125.70 (+24.97%)
• Aggressive: $138.26 (+37.45%)
• Expected Duration: 2-4 weeks
📊 Technical Position:
• Weekly: Consolidation
• Daily: Bearish Consolidation
• Intraday: Range Bound
🔑 Key Levels:
• Strong Support: $98.80
• Strong Resistance: $101.72
• Risk/Reward Ratio: 1:0.6
📈 Current Market Action:
• Weekly: Strong Downward Movement (-19.3%)
• Daily: Strong Upward Movement (+20.3%)
• 5min: Strong Upward Movement (+20.3%)
⚠️ Signal strength: 49.2% - 1 historical patterns analyzed
Safe Trades As Always
