AAPL Eyeing Gamma Reversal Zone – Will Bulls Defend the Pullback🍎 Technical Analysis (TA) – Intraday Setup
Current Price Zone: ~$221.39
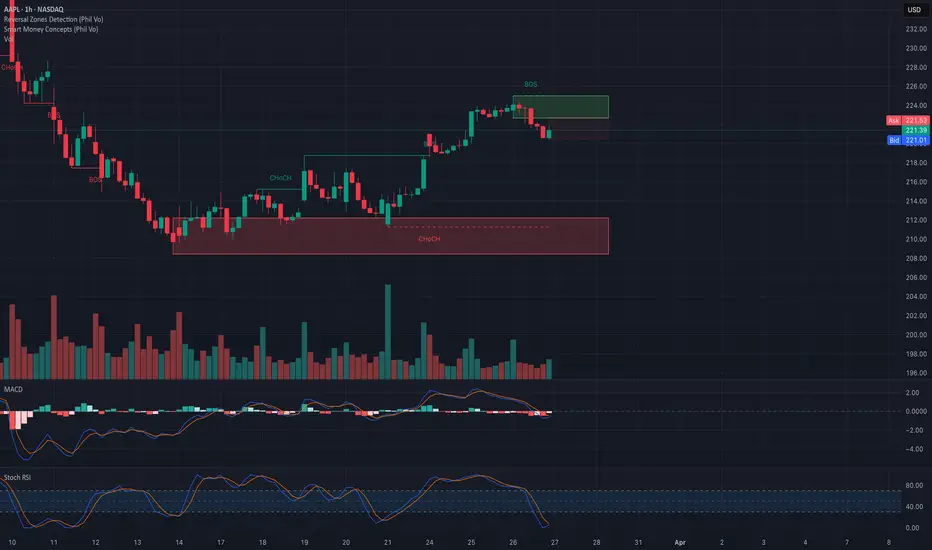
* AAPL recently broke structure to the upside (BOS) after a clean reversal from the CHoCH zone near 210–213.
* Price tapped the supply zone at 225–227.5 (aligned with GEX call resistance) and is now retracing.
* This pullback is happening in low volume, hinting at a possible reload phase.
Indicators:
* MACD: Bearish crossover, but fading momentum — potential for a bullish crossover soon.
* Stoch RSI: Oversold and curling, signaling potential bounce opportunity.
🔐 Key Zones
Support Levels:
* 217.5 → HVL support zone, critical gamma level.
* 215 → Strong PUT support zone; multiple touches + GEX protection.
* 210 → 2nd PUT wall and base of previous accumulation.
Resistance Levels:
* 225 → CALL resistance (Highest NetGEX + Gamma Wall)
* 227.5 → 2nd CALL Wall
* 230 → Extended target / 3rd CALL Wall
🧠 GEX & Options Flow (TanukiTrade)
* GEX Sentiment: 🟢🟢🟢 — Bullish
* IVR: 39.1
* IVx avg: 30
* PUT$%: 14.7% → Dealers are likely hedged long → may support dips
* Gamma Wall: 225 → Key resistance (calls dominate here)
* HVL Cluster: 217.5 → strong likelihood of pin or bounce at this level
📌 This sets up a Gamma Pin Scenario between 215 and 225, with room to breakout if buyers step in early.
🛠️ Trade Scenarios
📈 Bullish Setup – Bounce at 217.5–215
* If AAPL reclaims 220+ after defending HVL, expect push to retest resistance.
* Entry: On reclaim of 222 with volume
* Target 1: 225
* Target 2: 227.5
* Target 3: 230
* Stop-Loss: Below 215
* Options Play:
* Buy Apr 12 $225 Calls
* OR Bull Call Spread: Buy $222.5 / Sell $230 Calls for a defined risk
📉 Bearish Setup – Breakdown Below 215
* Would indicate bulls failed to defend demand zone.
* Entry: On clean break of 215 with selling volume
* Target 1: 210
* Target 2: 208
* Stop-Loss: Above 218
* Options Play:
* Buy Apr 12 $210 Puts
* Bear Put Spread: Buy $215 / Sell $210
🧭 Final Thoughts & Bias
* Bias: Leaning Bullish above 217.5 — structure still supports higher low formation.
* If 217.5 breaks, watch 215 for final support test.
* GEX zones suggest dealers may support near 215 and sell near 225, so expect chop unless a catalyst forces breakout.
📛 Disclaimer: This analysis is for educational purposes only and does not constitute financial advice. Always do your own research and manage your risk appropriately.
APC trade ideas
APPLE My Opinion! BUY!
My dear subscribers,
My technical analysis for APPLE is below:
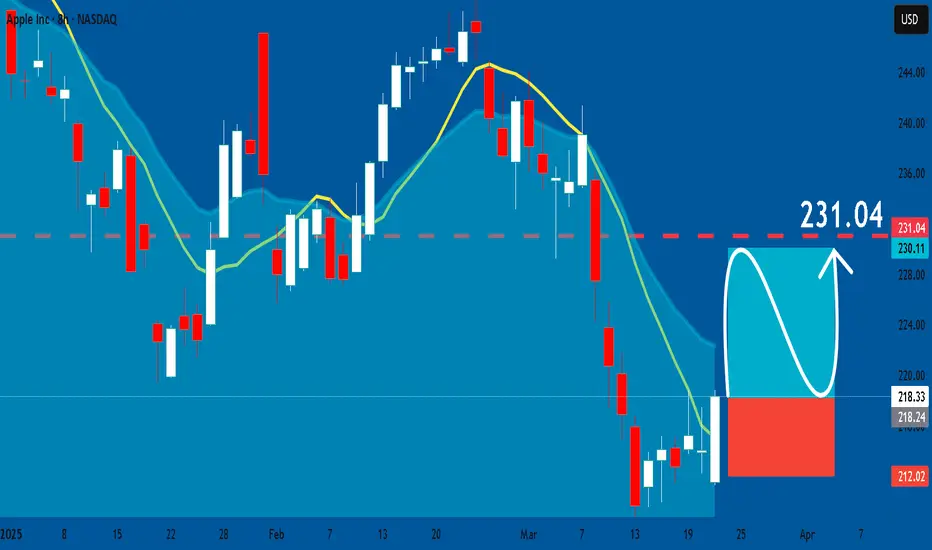
The price is coiling around a solid key level - 218.33
Bias - Bullish
Technical Indicators: Pivot Point sHigh anticipates a potential price reversal.
Super trend shows a clear buy, giving a perfect indicators' convergence.
Goal - 229.62
My Stop Loss - 213.08
About Used Indicators:
By the very nature of the supertrend indicator, it offers firm support and resistance levels for traders to enter and exit trades. Additionally, it also provides signals for setting stop losses
———————————
WISH YOU ALL LUCK

AAPL Bullish Opportunity – Momentum BuildingApple (AAPL) has recently pulled back and is now showing early signs of a bullish reversal. The price has bounced from key Fibonacci support and is reclaiming the 9 EMA — with bullish signals appearing on both MACD and RSI.
🔍 Technical Highlights:
✅ Bounce from 0.236 Fibonacci level
✅ MACD bullish cross forming with momentum picking up
✅ RSI climbing from oversold conditions
✅ Daily candles reclaiming the 9 EMA
✅ Room for continuation toward key retracement levels
📈 Fundamental Tailwinds:
🔹 Apple is entering the AI data center space, signaling a major expansion into infrastructure behind the scenes
🔹 The upcoming WWDC in June is expected to reveal powerful new AI software integrations across iOS and macOS
🔹 Apple remains one of the top “Magnificent 7” stocks, often leading institutional flows during tech recoveries
🔹 Anticipation is building ahead of new software announcements, which historically lift investor sentiment
📈 Trade Setup:
🟢 Entry Zone: $221–224
🔴 Stop Loss: Below $205
✅ TP1: $228 – 0.382 Fibonacci
✅ TP2: $234 – 0.5 Fibonacci
✅ TP3: $248 – 0.618 Fibonacci / resistance zone
Apple is now combining technical recovery with fresh fundamental momentum, creating a well-aligned opportunity for swing traders and position holders alike.

AAPl - bounce playAAPl - stock bouncing off $210 support level and making a move higher. Stock has next resistance at $227 and $239. looking for calls above $224 for a move higher. Stock is decent on indicators level.

AAPL LEVELS ENDING MARCHAAPL 3/25/25
not much on apple rn
just drew fib and lines
pretty clear clean chart to me w this

Apple.. Now becoming A-Peeling ??APPLE (APPL) has retraced about 50% of its range from April 2024
Currently I see a bullish Wolfe Wave emerging on a 4H timeframe.
Additionally points 2-3-4-5 have formed a nearly perfect ABCD pattern
We do need a broad market reversal and more business clarity from the Waffle House to engage.
I have indicated my targets.
A safer way to play this is to wait for a confirmation with an upwards break of the 1-3 line.
(~219/220 area)
Not about Investment advice. Do your own due diligence.
S.

AAPL bouncing above cluster supportboost and follow for more 🔥AAPL is clearly bouncing from support zone and above 2 important trend supports, also look at the RSI and what happened to it after it bounced from this RSI level.
243.92-254.12 is coming, send the bears to valhalla ⚡🚀

AAPL Testing Crucial Reversal Levels! Breakout or PullbackQuick AAPL update based on the 1-hour charts, highlighting key reversal zones and Gamma Exposure (GEX) for options.
📈 Technical Analysis (TA):
* AAPL is currently testing a small green reversal zone around $220–$221, indicating potential bullish exhaustion.
* Recently established higher highs (HH) and higher lows (HL) suggest bullish momentum, but caution at current reversal zones is advised.
* Significant support identified in the red reversal zone at $208–$210; a strong area for buyers to step in if prices pull back.
* A Change of Character (CHoCh) observed at both red and green reversal zones confirms their importance for price action decisions.
📊 GEX & Options Insights:
* Strongest CALL resistance and highest positive NET GEX sit clearly at $225. Watch carefully for bullish confirmation.
* Solid PUT support noted at $210, aligning neatly with the red reversal zone—key downside protection.
* IV Rank moderate at 38.1%, suggesting balanced opportunities for debit and credit spread strategies.
* PUT sentiment currently at 9.2%, pointing to prevailing bullish sentiment but requires caution due to proximity to reversal levels.
💡 Trade Recommendations:
* Bullish Scenario: Look for a clear break above $221. Target $225, leveraging calls strategically. Stops recommended below $218.
* Bearish Scenario: Observe closely for rejection signals at $220–$221; consider puts targeting the lower reversal zone around $210.
* Neutral Approach: Moderate IV provides good conditions for Iron Condors or credit spreads between clear boundaries ($210–$225).
🛑 Risk Management: Keep your stops disciplined and your position sizes controlled, especially at these critical decision points.
Stay cautious and trade responsibly!
Disclaimer: This analysis is for educational purposes only and does not constitute financial advice. Always do your own research and manage your risk before trading.

Go Long on AAPL: Short-Term Bullish Outlook Awaits Next Week
- Key Insights: Apple shows robust potential in the tech sector, poised for a
rally despite internal challenges. Investors should monitor technical levels
as reclaiming key moving averages will indicate stronger bullish trends. The
stock's resilience amid economic challenges positions Apple favorably.
- Price Targets:
- Next Week Targets: Target 1 (T1) at $219, Target 2 (T2) at $228
- Stop Levels: Stop Level 1 (S1) at $211, Stop Level 2 (S2) at $206
- Recent Performance: AAPL has exhibited relative strength, gaining 2.24%
recently amid sector pressures. Remaining a key player in driving tech
sector momentum indicates potential upward movement.
- Expert Analysis: Market experts maintain optimism, suggesting careful
observation of Apple's ability to navigate innovation hurdles will be key to
maintaining upward trends. Positive momentum is anticipated with substantial
chances of leading a rally.
- News Impact: Apple faces internal challenges in AI development but retains
investor confidence. A notable increase suggests positive market sentiment.
Speculation around organizational changes could influence future
performance, indicating strategic adjustments.

APPLE: Long Signal Explained
APPLE
- Classic bullish pattern
- Our team expects retracement
SUGGESTED TRADE:
Swing Trade
Buy APPLE
Entry - 218.33
Stop - 212.02
Take - 231.04
Our Risk - 1%
Start protection of your profits from lower levels
Disclosure: I am part of Trade Nation's Influencer program and receive a monthly fee for using their TradingView charts in my analysis.
❤️ Please, support our work with like & comment! ❤️
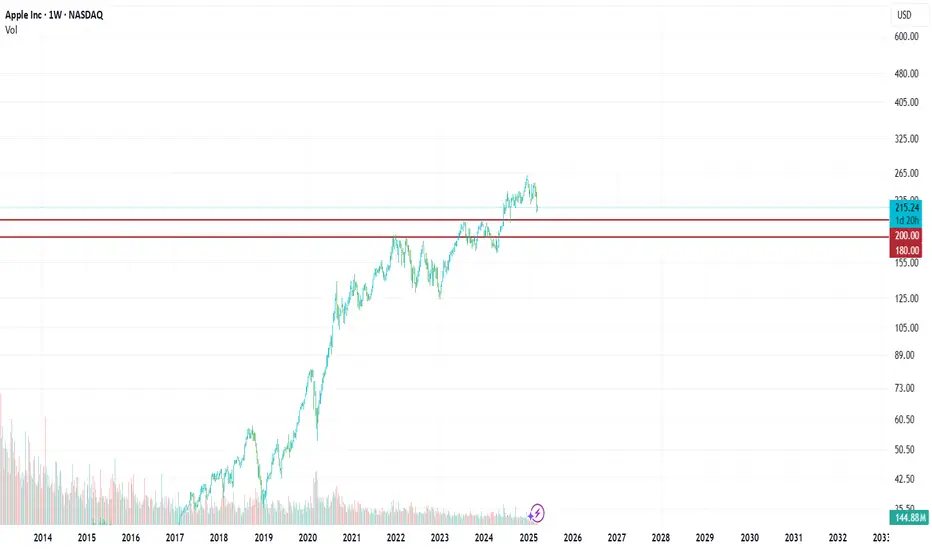
Apple bullish channelAs anticipated in a previous analysis when the stock was at the top of the channel, a correction has started from this level towards the bottom of the bullish channel + a major support zone (previous all-time highs) around 190/200$.
We will therefore wait for this level to position ourselves again for a long-term buy on the stock and target a retracement of the decline, or even the all-time high if positive catalysts support global indices.
A bearish breakout below the 190/200$ zone on a monthly close would be a very negative signal for the future and would cancel our scenario.

Apple (AAPL) has fallen 16% from its all-time high (260.10)Apple (AAPL) has fallen 16% from its all-time high (260.10), testing significant monthly support at 232.50 and 219.86. With a Friday close above 214.96, temporary rebounds to 219.86, 224.40, 229.35, and 232.50 are possible. However, a broader market pullback could send Apple lower to 207, 200, 186, or even 178.

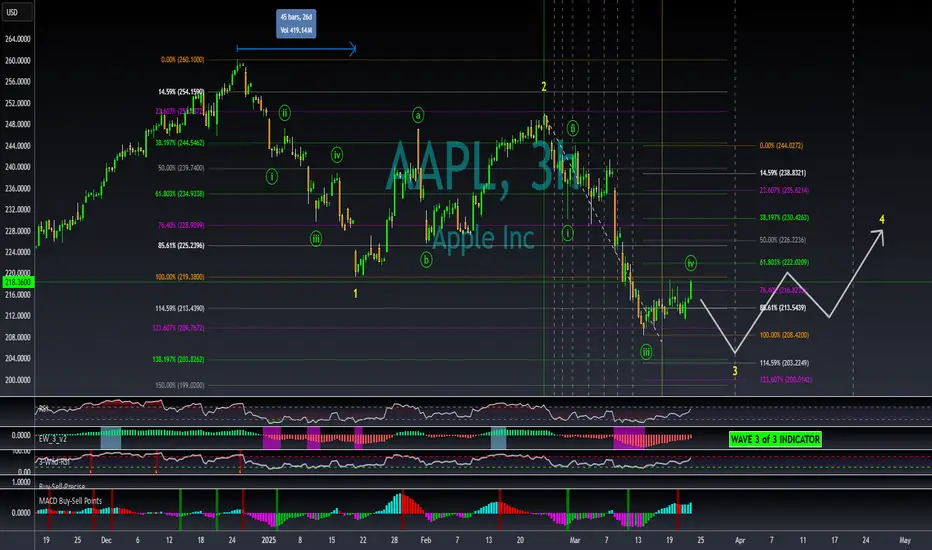
Will AAPL temporarily go below 205 this week?My overall thesis is we are in the very early stages of a multi-year decline ultimately with the S&P 500 below 3500. I have been wrong many times before so I will just take this thing in stages and see if it plays out. After this massive decline, we should be in for a great market rally of many decades. While the market has seen a brief rally, the primary question is when will the rally end? Friday turned in mix answers to that question. The next step in my opinion will be a decline, possibly sharp with a quick bottom in some sectors AHEAD of the reciprocal tariff deadline on April 2.
My wave 3 indicator tends to signal wave 3s and 3 of 3s with additional end of wave (overbought/sold) conditions. See my scripts for the specifics of the indicator. It currently signaled 3 of 3 based on the bottom in mid-March meaning another drop is likely soon.
While the other stocks I have studied mainly topped at all-time highs in mid to late February, AAPL topped at the end of 2024. The movement of AAPL may be a leading indicator of future market movement as the market appears to be trading as a micro wave structure inside of AAPL's more macro movement.
My market expectations are for their first semi-major wave 1s to end within the next few weeks. Each wave 1 will be followed by a multi week wave 2 up. AAPL may end its wave 3 structure (yellow 3) when the others finish their wave 1s. AAPL would then experience wave 4 up, when the other stocks and S&P 500 index experience their second wave.
This chart applies select movement extensions based on wave 1's movement on the left and then another based on wave 3's movement on the right. I keep the values between 0%-100% on the chart for wave 2s and 4s retracements of the preceding wave's movement for reference even though the retracement values would be inverted.
I will refer to the yellow waves a Minor waves and the green as Minute waves. The extension/retracement data on the left is based on Minor wave 1's movement and is applicable to Minor waves 2 and 3. It provides a rough location of levels for Minor wave 3 to end. The extension on the right attempts to determine Minute wave 5's end points based on Minute wave 3. An intersection of Minor wave 1 extension levels and Minute wave 3 extension levels are general targets for bottoms. One of these is between 203-204 for AAPL.
Lastly, I apply similar levels to determine Minor wave 3's length based on Minor wave 1's length of 45 bars (on the 3 hour chart). Minor wave 3 is currently longer than 45 bars. The vertical dashed bars provide similar locations with the next vertical bar occurring on the morning of Monday March 31. I am therefore watching to see if the next bottom for AAPL occurs at this time.
If this bottom truly comes into focus, I will then attempt to forecast Minor wave 4 for AAPL which could occur in late April.
AAPL Short: Short at Support turned ResistanceWhere to short AAPL? I think the red line price of $219.71 is a strong resistance because it is the price where there were 2 previous lows (first 2 red arrows pointing up).
Take note that there is a chance that the recent low point is the end of the entire correction if that is a wave C. My Primary count that it is just wave 1 of C is a BIAS. Just keep that in mind.
I would say that the stop loss is about $10 above $219.71.
Good luck!

Apple - Will Apple visit the $200 zone again?Apple has officially started its daily downtrend. The $200 support zone is a level that has been respected often in the past, with a high confluence of the Golden Pocket. It is highly possible that Apple could revisit this level and make a strong bounce. Until then, there is a high probability that this level could be revisited until the downtrend is broken.
Thanks for your support.
- Make sure to follow me so you don't miss out on the next analysis!
- Drop a like and leave a comment!
Lets chat in the comment section. See you there :)

Apple could find a temp bottomAltho I am very bearish long term on Apple rn I think there could be a tradeable bottom depending on if more or less technical damage is done here

Pre-Market Analysis and Update on $INTC $SMCI $NVDA $TSLA $SPYThesis on key levels and potential trade set ups for the stocks listed in the title. HTF perspective of the 1D and W chart with guidance on lower time frame entries.

$AAPL $200 right?Apple looks very weak IMO. In this current climate and uncertainty sentiment and lack of innovation I believe we see a retest of $200, we are around the sell point for Mr. Buffet. $200 big psyche price.
Short term puts. WSL

Apple Wave Analysis – 20 March 2025
- Apple reversed from resistance level 220.00
- Likely to fall to support level 208.00
Apple recently reversed down from the pivotal resistance level 220.00 (former strong support from November and January, acting as the resistance level after it was broken previously).
The donwward reversal from this resistance level 220.00 stopped the previous short-term correction 4 – which belongs to wave (C) from February.
Apple can be expected to fall to the next support level 208.00 (which reversed the price earlier this month).

$AAPL TIME TO LOAD UP?As of March 12, 2025, Apple Inc. (AAPL) is trading at $217.21, reflecting a slight decrease of 1.64% from the previous close.
Apple continues to demonstrate strong financial health, maintaining robust cash flows and a solid balance sheet. This financial stability enables ongoing investments in research, development, and strategic acquisitions, positioning the company for sustained growth.
While Apple has traditionally taken a measured approach to artificial intelligence, this strategy has proven advantageous. The company's cautious AI investments have allowed it to avoid the pitfalls faced by competitors with higher AI expenditures. This prudent approach has contributed to stock stability, even as the broader tech market experiences volatility.
Apple's integrated ecosystem—including devices like the iPhone, iPad, Mac, and services such as the App Store and Apple Music—fosters strong customer loyalty. This ecosystem not only encourages repeat purchases but also attracts new customers, providing a steady revenue stream and opportunities for cross-selling.
Apple's position as a leader in the technology sector, coupled with its strong brand recognition, offers a competitive advantage. The company's ability to set industry trends and command premium pricing supports robust profit margins and market share.
Despite recent stock fluctuations and external challenges, Apple's solid financial foundation, strategic investments, cohesive product ecosystem, and strong brand equity contribute to a positive long-term outlook for AAPL stock.

Apple (AAPL): -50%. According to the planElliott Wave Analysis of Apple stock
.
● NASDAQ:AAPL |🔎TF: 1W
Fig. 1
The long-term wave markup has not been adjusted for the past three years. Except that the orthodox tops and bottoms and targets for third waves are slightly refined.
.
● NASDAQ:AAPL |🔎TF: 1W
Fig. 2
Earlier, at the end of 2023 , we have already suggested wave ((iv)) in 3 in the form of a running flat. As we can see, the attempt was unsuccessful, the formation of a sideways correction continues to this day. It can be a running flat or an expanded flat, the latter of which assumes a break of the 124.17 low.

AAPL Bullish Reversal – Is the Rally Just Starting?Technical Analysis & Options Outlook
📌 Current Price: $216.15
📌 Trend: Bullish Reversal with Smart Money Confirmation
📌 Timeframe: 1-Hour
Price Action & Market Structure
1. Bullish Breakout Confirmed – AAPL has broken above trendline resistance, confirming a shift in sentiment.
2. BOS Validation – The break above $215 confirms buyers stepping in aggressively.
3. Retest Zone Possible – Price may pull back to $215–$213 before continuing higher.
4. MACD & Stoch RSI – Showing strong momentum, but nearing overbought territory, meaning potential consolidation before continuation.
Key Levels to Watch
📍 Immediate Resistance:
🔹 $217.50 – 53% CALL Resistance
🔹 $220 – 3rd CALL Wall Target
🔹 $222.50 – Highest CALL Target
📍 Immediate Support:
🔻 $215 – BOS Retest Zone
🔻 $210 – Highest Negative NETGEX / PUT Support
🔻 $208.42 – Critical Demand Zone
Options Flow & GEX Sentiment
* IVR: 52.3 (Moderate Implied Volatility)
* IVx: 32.4 (-3.28%) (Declining volatility, favoring breakouts)
* GEX (Gamma Exposure): Bullish Shift Detected
* CALL Walls: $217.50, $220, $222.50 (Upside targets)
* PUT Walls: $210 & $208 (Demand zones)
📌 Options Insight:
* Above $217.50, expect a gamma-driven move toward $220+ if momentum sustains.
* Below $215, risk increases for a retest of $210 before bouncing back.
My Thoughts & Trade Recommendation
🚀 Bullish Case: If AAPL holds above $215, expect a continuation to $220–$222.50.
⚠️ Bearish Case: If AAPL breaks below $215, expect a retest of $210–$208 before another move higher.
Trade Idea (For Educational Purposes)
📌 Bullish Play:
🔹 Entry: Retest of $215 support
🔹 Target: $220–$222.50
🔹 Stop Loss: Below $213
📌 Bearish Play (Hedge Idea):
🔻 Entry: Rejection at $217.50
🔻 Target: $210 PUT Wall
🔻 Stop Loss: Above $218
Disclaimer
This analysis is for educational purposes only and does not constitute financial advice. Always perform your own research and manage risk accordingly.
Final Thoughts
AAPL has confirmed a bullish structure, but $215 needs to hold as support for the next leg higher. A breakout above $217.50 would confirm a move to $220+, while failure to hold could lead to a pullback before resuming upward. Watch for a BOS retest for optimal entries.

APPLE - AFTER FED-positive inflation expectations
- rate cuts this year expected
- bearish US Market
2 possbile retracement targets