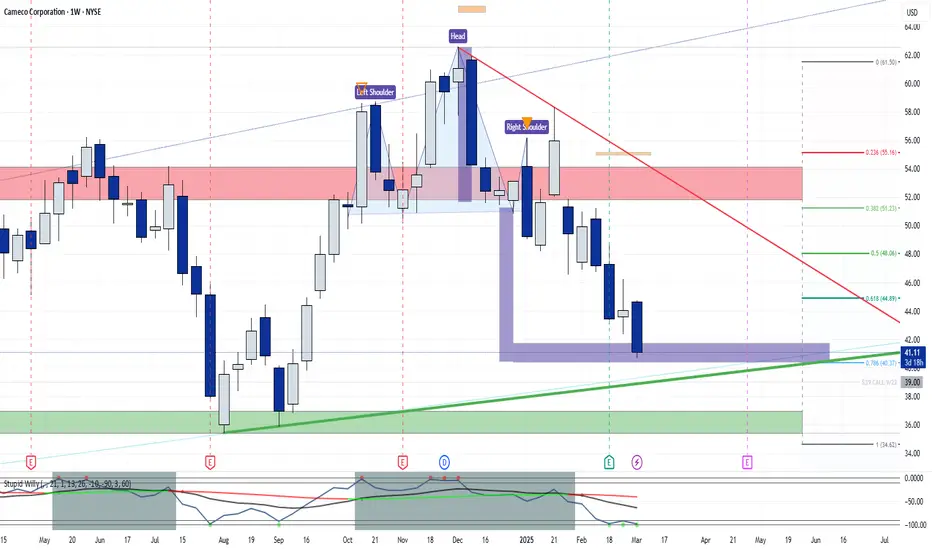
CCJ eyes on $45.37: semi-major Fib may dip to $42 for long entryCCJ trying to recover from the nuclear bubble burst.
Currently testing a semi-major Covid fib at $43.37
If it dips then watch the support zone $42.31-42.91
Key facts today
Next report date
—
Report period
—
EPS estimate
—
Revenue estimate
—
0.76 EUR
115.36 M EUR
2.10 B EUR
433.75 M
About Cameco Corporation
Sector
Industry
CEO
Timothy S. Gitzel
Website
Headquarters
Saskatoon
Founded
1988
FIGI
BBG00FGWM7D4
Cameco Corp. engages in the provision of uranium. It operates through the Uranium and Fuel Services segments. The Uranium segment is involved in the exploration for, mining, milling, purchase, and sale of uranium concentrate. The Fuel Services segment deals with the refining, conversion, and fabrication of uranium concentrate and the purchase and sale of conversion services. The company was founded in 1988 and is headquartered in Saskatoon, Canada.
Related stocks

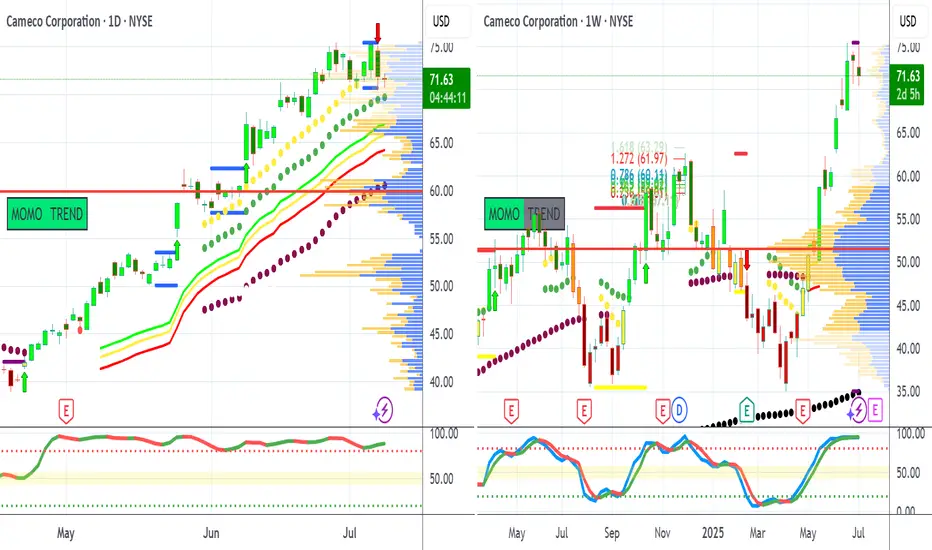
CCJ stead as she goes but triple top failure ahead?Cameco Corp. (CCJ) shows a strong uptrend with a consolidation just below resistance, which is a bullish technical pattern. Let’s break it down:
🔍 Technical Analysis of CCJ
1. Trend Structure
Clear uptrend: The stock has been making a series of higher highs and higher lows since March.
Ascending t

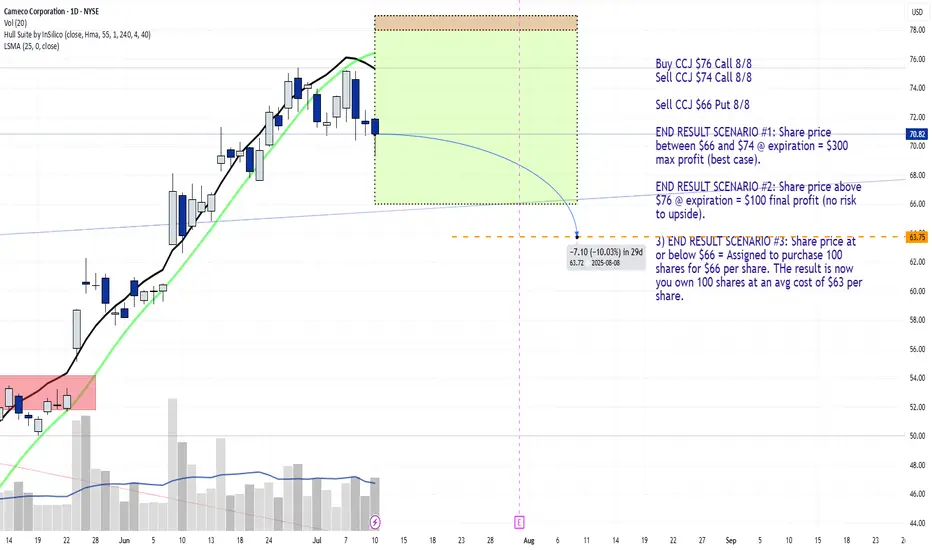
JADE LIZARD TRADE for 8/8 ExpirationNYSE:CCJ JL
Buy CCJ $76 Call 8/8
Sell CCJ $74 Call 8/8
Sell CCJ $66 Put 8/8
END RESULT SCENARIO #1: Share price between $66 and $74 @ expiration = $300 max profit (best case scenario).
END RESULT SCENARIO #2: Share price above $76 @ expiration = $100 final profit (no risk to upside).
3) END RE
CCJ Long CCJ and URA are both at Volume, Darvas and Minor Low support.
CCJ is stronger than URA and has not lost it's trend. I would favor more size or taking CCJ alone vs URA sector.
Entry: 71.7
Stop Loss: 30% of Option.
Profit Target: $72.86 - Move Stop Loss to Breakeven
Profit Target: $74.80 - Take f
CamecoCameco is on a rip. UEC/CCJ ascending triangle is breaking down, which is a surprise to me. It means Cameco is even more bullish that UEC, but UEC/UX ascending triangle is still going late into the triangle, and yet to break out. Great news for Cameco, but UEC will get it's dead-cat bounce vis-a
$CCJ - short Been following this stock a long time. It follows the megaphone pattern for a significant amount of time, now. Played the long, now it's time for the short. Will it continue to honor the pattern?

How Dark Pools accumulation trigger momentum runs speculatively.Dark Pools hide their accumulation during their buying of stocks over time that are at bargain price levels. When a stock price drops below its fundamental levels, Dark Pool TWAP orders trigger and begin the bottom formation to completion phase.
This can take weeks to months to complete. Some bottom

Stop Hunting for Perfection - Start Managing Risk.Stop Hunting for Perfection — Start Managing Risk.
Hard truth:
Your obsession with perfect setups costs you money.
Markets don't reward perfectionists; they reward effective risk managers.
Here's why your perfect entry is killing your results:
You ignore good trades waiting for ideal setups —

CCJ Gets Another Bounce from Key Demand ZoneCameco has bounced from the key demand zone at 32.50–35.50 for the sixth time, further confirming this area as a significant support level. The 200-day moving average also played a major role in the bounce, acting as a magnet. In the last three instances, when the price moved nearly 20% below the 20

See all ideas
Summarizing what the indicators are suggesting.
Neutral
SellBuy
Strong sellStrong buy
Strong sellSellNeutralBuyStrong buy
Neutral
SellBuy
Strong sellStrong buy
Strong sellSellNeutralBuyStrong buy
Neutral
SellBuy
Strong sellStrong buy
Strong sellSellNeutralBuyStrong buy
An aggregate view of professional's ratings.
Neutral
SellBuy
Strong sellStrong buy
Strong sellSellNeutralBuyStrong buy
Neutral
SellBuy
Strong sellStrong buy
Strong sellSellNeutralBuyStrong buy
Neutral
SellBuy
Strong sellStrong buy
Strong sellSellNeutralBuyStrong buy
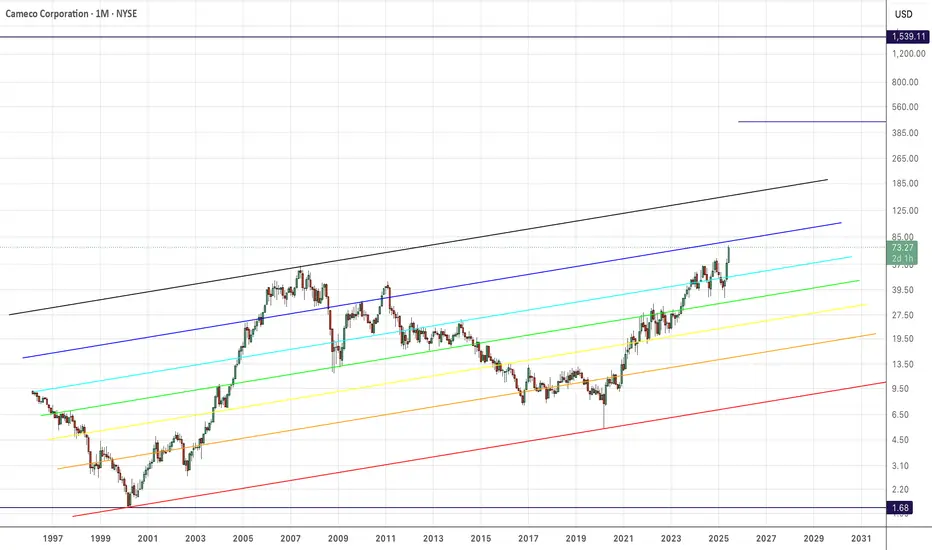
Displays a symbol's price movements over previous years to identify recurring trends.
Frequently Asked Questions
The current price of CJ6 is 63.10 EUR — it has decreased by −4.22% in the past 24 hours. Watch CAMECO CORP stock price performance more closely on the chart.
Depending on the exchange, the stock ticker may vary. For instance, on GETTEX exchange CAMECO CORP stocks are traded under the ticker CJ6.
CJ6 stock has fallen by −7.46% compared to the previous week, the month change is a 3.46% rise, over the last year CAMECO CORP has showed a 50.76% increase.
We've gathered analysts' opinions on CAMECO CORP future price: according to them, CJ6 price has a max estimate of 82.82 EUR and a min estimate of 47.59 EUR. Watch CJ6 chart and read a more detailed CAMECO CORP stock forecast: see what analysts think of CAMECO CORP and suggest that you do with its stocks.
CJ6 stock is 7.61% volatile and has beta coefficient of 16.40. Track CAMECO CORP stock price on the chart and check out the list of the most volatile stocks — is CAMECO CORP there?
Today CAMECO CORP has the market capitalization of 27.70 B, it has increased by 8.08% over the last week.
Yes, you can track CAMECO CORP financials in yearly and quarterly reports right on TradingView.
CAMECO CORP is going to release the next earnings report on Nov 5, 2025. Keep track of upcoming events with our Earnings Calendar.
CJ6 earnings for the last quarter are 0.44 EUR per share, whereas the estimation was 0.32 EUR resulting in a 39.20% surprise. The estimated earnings for the next quarter are 0.24 EUR per share. See more details about CAMECO CORP earnings.
CAMECO CORP revenue for the last quarter amounts to 546.83 M EUR, despite the estimated figure of 500.36 M EUR. In the next quarter, revenue is expected to reach 514.41 M EUR.
CJ6 net income for the last quarter is 200.08 M EUR, while the quarter before that showed 44.81 M EUR of net income which accounts for 346.53% change. Track more CAMECO CORP financial stats to get the full picture.
Yes, CJ6 dividends are paid annually. The last dividend per share was 0.11 EUR. As of today, Dividend Yield (TTM)% is 0.16%. Tracking CAMECO CORP dividends might help you take more informed decisions.
CAMECO CORP dividend yield was 0.22% in 2024, and payout ratio reached 40.49%. The year before the numbers were 0.21% and 14.41% correspondingly. See high-dividend stocks and find more opportunities for your portfolio.
As of Aug 2, 2025, the company has 2.88 K employees. See our rating of the largest employees — is CAMECO CORP on this list?
EBITDA measures a company's operating performance, its growth signifies an improvement in the efficiency of a company. CAMECO CORP EBITDA is 580.89 M EUR, and current EBITDA margin is 24.05%. See more stats in CAMECO CORP financial statements.
Like other stocks, CJ6 shares are traded on stock exchanges, e.g. Nasdaq, Nyse, Euronext, and the easiest way to buy them is through an online stock broker. To do this, you need to open an account and follow a broker's procedures, then start trading. You can trade CAMECO CORP stock right from TradingView charts — choose your broker and connect to your account.
Investing in stocks requires a comprehensive research: you should carefully study all the available data, e.g. company's financials, related news, and its technical analysis. So CAMECO CORP technincal analysis shows the sell today, and its 1 week rating is buy. Since market conditions are prone to changes, it's worth looking a bit further into the future — according to the 1 month rating CAMECO CORP stock shows the buy signal. See more of CAMECO CORP technicals for a more comprehensive analysis.
If you're still not sure, try looking for inspiration in our curated watchlists.
If you're still not sure, try looking for inspiration in our curated watchlists.