HDFC BANK FORMING INVERSE HEAD & SHOULDERS ??Hii, HDFC BANK has formed inverse H&S on daily chart
How to trade in inverse is to wait for breakout and once it breaks wait for another candle for confirmation, after confirmation enter the trade.
Target will be the distance from head till dotted line & Stoploss will be 1664, Enjoy trading simple.
***This is my personal views and not any recommendations***
HDFA trade ideas

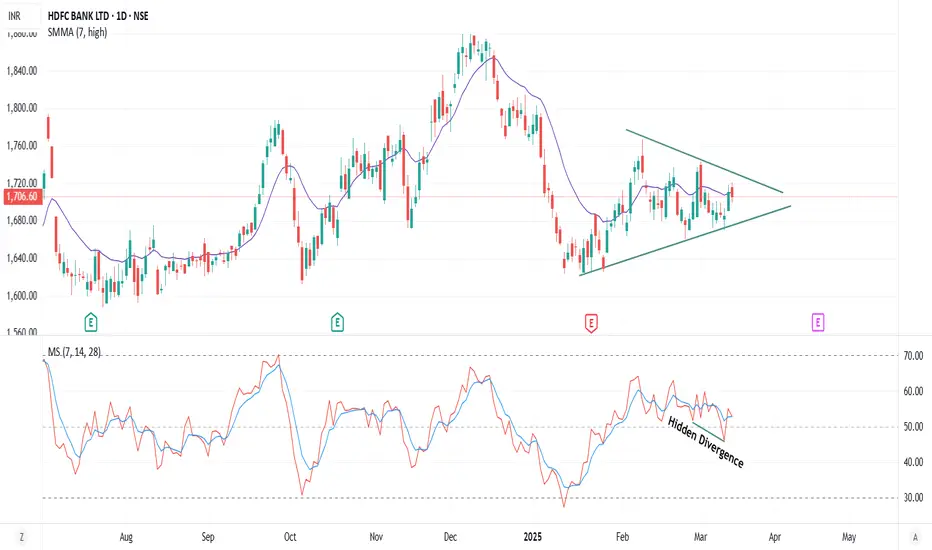
HDFC 1706 Trend directionHDFC 1706 has hidden divergence. With support 1670 we expect a target of 1745
HDFC BANK - VCP PatternHdfc bank is trying to move up. The pattern formed is Volatility Contraction Pattern (Bullish). Breakout above 1740 will confirm it. Stop loss 1670. This is a paper trade idea to learn the financial markets. Do not perform on your trading and demat account.
Disclaimer: I'm not a SEBI registered. "The information provided is for educational and informational purposes only. It does not constitute investment advice, financial advice, or a recommendation to buy or sell any securities. The content is not intended exclusively for qualified investors. Users should conduct their own research and consult with a professional before making investment decisions. Trading and investing involve risk, and past performance does not guarantee future results."

Prepare for an HDFC BANK blast next weekHDFC BANK is going to be the Large cap heavyweight saviour of the market in these turbulent times. The price is holding firm around the 1700 levels and is not showing any signs of crumbling.
I anticipate the stock to rally towards 1780 price level within this March 2025 expiry.
SL would be this week's low.
Stay tuned!

HDFCBANK SELL HDFCBANK SELL target level profit.
Trend Analysis
- The stock has broken the floor of the rising trend channel in the medium long term, indicating a weaker initial rising rate ¹.
- A head and shoulders formation is under development, which may trigger a strong sell signal

HDFC Bank - A long awaiting trade.HDFC bank is consolidating from quite long time after and strong upmove. looks like soon this consolidation is going to break and a new journey will start.
Gearing up for the next bull move.

HDFC Supply Zone (Reversal)In technical analysis, a supply zone is an area on the price chart where selling pressure has historically been strong, often leading to a reversal or resistance level. For HDFC Bank, identifying a supply zone can help traders anticipate potential price rejections or reversals.

Demand zone in HDFC bank HDFC Bank is one of the largest and most liquid stocks in the Indian banking sector, and its price movements are closely watched by traders and investors. A demand zone in HDFC Bank refers to a price area where buying interest has historically been strong, often acting as a support level. Identifying and trading demand zones in HDFC Bank requires a combination of technical analysis tools and an understanding of the stock's behavior.

HDFC BANK S/R for 12/2/25Support and Resistance Levels:
Support Levels: These are price points (green line/shade) where a downward trend may be halted due to a concentration of buying interest. Imagine them as a safety net where buyers step in, preventing further decline.
Resistance Levels: Conversely, resistance levels (red line/shade) are where upward trends might stall due to increased selling interest. They act like a ceiling where sellers come in to push prices down.
Breakouts:
Bullish Breakout: When the price moves above resistance, it often indicates strong buying interest and the potential for a continued uptrend. Traders may view this as a signal to buy or hold.
Bearish Breakout: When the price falls below support, it can signal strong selling interest and the potential for a continued downtrend. Traders might see this as a cue to sell or avoid buying.
20 EMA (Exponential Moving Average):
Above 20 EMA(50 EMA): If the stock price is above the 20 EMA, it suggests a potential uptrend or bullish momentum.
Below 20 EMA: If the stock price is below the 20 EMA, it indicates a potential downtrend or bearish momentum.
Trendline: A trendline is a straight line drawn on a chart to represent the general direction of a data point set.
Uptrend Line: Drawn by connecting the lows in an upward trend. Indicates that the price is moving higher over time. Acts as a support level, where prices tend to bounce upward.
Downtrend Line: Drawn by connecting the highs in a downward trend. Indicates that the price is moving lower over time. It acts as a resistance level, where prices tend to drop.
Disclaimer:
I am not a SEBI registered. The information provided here is for learning purposes only and should not be interpreted as financial advice. Consider the broader market context and consult with a qualified financial advisor before making investment decisions.

Hdfcbank is showing good potential for upside move Hdfc taking good support at my level and also I'm seeing volume is increasing day by day that indicates buyer are interested in this support level.

Reason of tax slab 12 lakh this budge is the best decisionMarket are run by consumer. If there is no demand there will be no supply. Demand happens when salaried employees have some surplus. The decision to keep a 12 lakh no tax limit is best for banks as reason being people will have more money to repay the loans they have defaulted. People will be ready to borrow some money and try there own business in small scale as they have surplus from salary. FMCG obviously will be happy with the decision. Travel will also boost as now people will visit different places as they will have surplus. Less salried employee who never had money left to buy term insurance and medical insurance will opt for it provided government spread knowledge and good scheme for it. Only disadvantage is inflation and thats what government has to ensure is on control or else everything will collapse

HDFC BANK - For Indian Users!!Got a lot of request for it! You wish to see how it works, let my doodle do the magic for you!

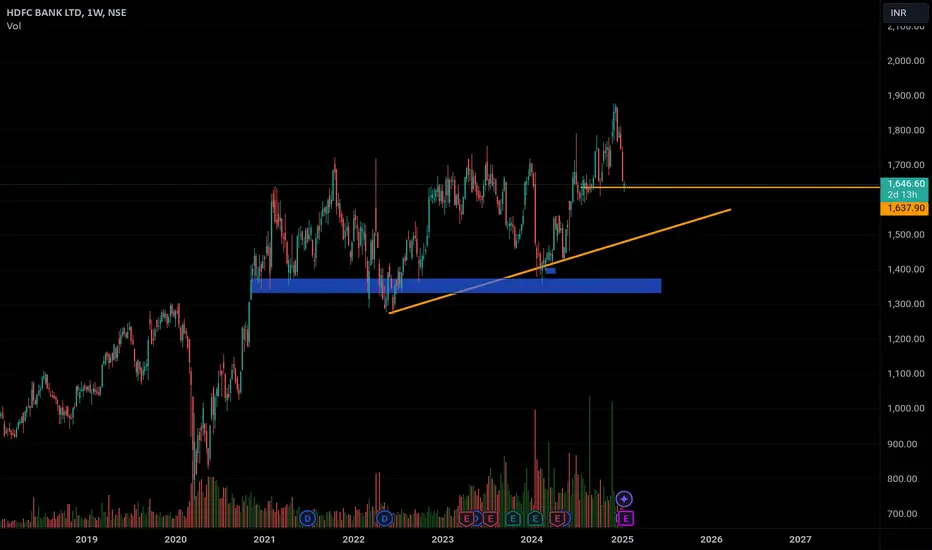
Low risk Zone near 1550Multiple long term support cross near 1550 (Trendline Support with 200 week SMA ). So we consider 1550 as a low risk zone for HDFC BANK .

HDFC Bank Range Breakout: A Good Buying Opportunity...?After a period of strong consolidation, HDFC Bank has successfully cleared the resistance level at 1660. This breakthrough indicates potential upward momentum in the stock's price. Currently, the stock is retesting this 1660 level, which could serve as a crucial support zone before it continues its upward journey.
Considering the current market conditions and the recent price action, this presents an opportunity to enter a long position. We should aim for a first target around 1719, the next resistance level to watch. If momentum remains strong and the stock continues to rise, a second target can be set at 1808.
As always, it's essential to manage risk, especially in a volatile market environment. Therefore, implementing stop-loss orders is recommended to protect against any unexpected price movements. This strategic approach can help secure profits while mitigating potential losses as we navigate this trade.

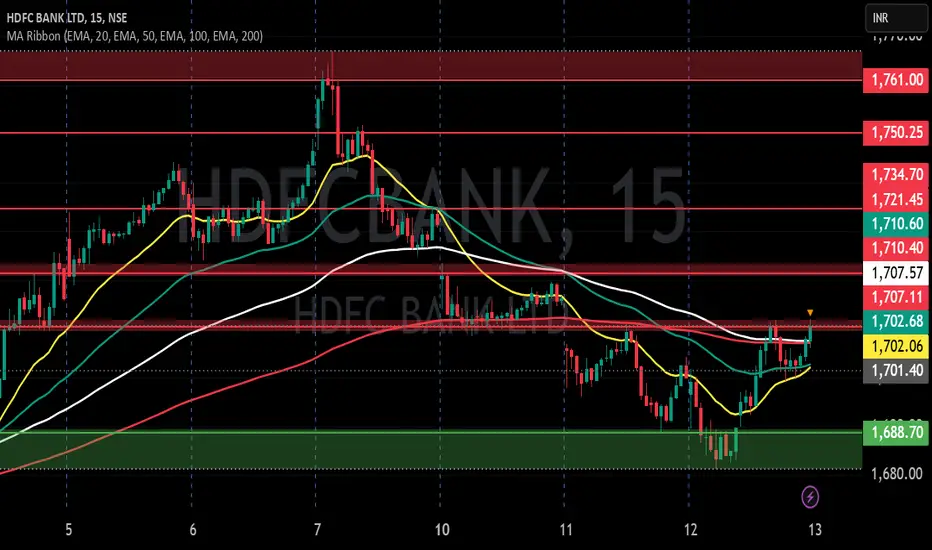
HDFC BANK S/R for 23/1/25Support and Resistance Levels:
Support Levels: These are price points (green line/shade) where a downward trend may be halted due to a concentration of buying interest. Imagine them as a safety net where buyers step in, preventing further decline.
Resistance Levels: Conversely, resistance levels (red line/shade) are where upward trends might stall due to increased selling interest. They act like a ceiling where sellers come in to push prices down.
Breakouts:
Bullish Breakout: When the price moves above resistance, it often indicates strong buying interest and the potential for a continued uptrend. Traders may view this as a signal to buy or hold.
Bearish Breakout: When the price falls below support, it can signal strong selling interest and the potential for a continued downtrend. Traders might see this as a cue to sell or avoid buying.
MA Ribbon (EMA 20, EMA 50, EMA 100, EMA 200) :
Above EMA: If the stock price is above the EMA, it suggests a potential uptrend or bullish momentum.
Below EMA: If the stock price is below the EMA, it indicates a potential downtrend or bearish momentum.
Trendline: A trendline is a straight line drawn on a chart to represent the general direction of a data point set.
Uptrend Line: Drawn by connecting the lows in an upward trend. Indicates that the price is moving higher over time. Acts as a support level, where prices tend to bounce upward.
Downtrend Line: Drawn by connecting the highs in a downward trend. Indicates that the price is moving lower over time. It acts as a resistance level, where prices tend to drop.
Disclaimer:
I am not a SEBI registered. The information provided here is for learning purposes only and should not be interpreted as financial advice. Consider the broader market context and consult with a qualified financial advisor before making investment decisions.
HDFC Bank 1H Analysis: Consolidation Zone Between ₹1,620-₹1,645
Analysis:
1. Lower Low Banane Ka Signal :
Chart mein price consistently lower highs aur lower lows bana raha hai.
Agar price ₹1,620 ke support ko todta hai, to agla lower low confirm ho sakta hai.
2. Downside Possibility :
Red shaded area (resistance zone) ke neeche rehna bearish signal hai.
Agar breakdown hota hai, to agla support ₹1,600 ke aaspaas ho sakta hai.
3. Wait for Confirmation :
Agar price ₹1,645 ke resistance zone ko todne mein fail hota hai aur neeche ₹1,620 ke paas aata hai, to yeh sell confirmation ka signal ho sakta hai.
Aapko breakdown ke baad retest ka wait karna chahiye, jo better entry dega.
---
Suggestion:
Stop-Loss : Agar aap downside ke liye position lete hain, to stop-loss ₹1,650 ke upar set karein.
Target : Pehla target ₹1,600 aur doosra ₹1,580 ho sakta hai.

HDFC Bank Rangebound Ahead of Quarterly ResultsHDFC Bank is currently navigating a range-bound market, maintaining stability with the upper range set at 1660 rupees and the lower range at 1629 rupees. This price action occurs in the lead-up to the eagerly anticipated earnings report, which is scheduled for January 22nd.
Investors should consider positioning themselves for potential movements based on the earnings results. If the bank exceeds market expectations with strong financial performance, it may break through the upper resistance level of 1660 rupees. A successful breakout could lead the stock to test the next significant resistance level at 1717 rupees, potentially offering a lucrative opportunity for long traders.
On the other hand, if the earnings report fails to meet expectations and the stock breaks below the lower support level of 1629 rupees, this could trigger selling pressure. Should this scenario unfold, we might see the stock decline further, possibly approaching the critical support level at 1595 rupees. Thus, traders should remain vigilant and prepared to adjust their strategies based on the upcoming results, whether considering long or short positions accordingly.

Last Spike Down Taken OutWe have reached the level of the first genuine August week again.
The stock may have a rest here. This the more as the cloud is still up.

HDFC long weekly HDFC on demand zone after significant down fall, lets see how it plays. NSE:HDFCBANK
HDFC BANK AnalysisHdfc bank was weak for last 8 days and now has finally reach October month low if it break it can come till 1580 and can also bring nifty 150-200 points with it so it mostly depends on hdfc what will happen in coming days

HDFC Bank 1600 make or break.HDFC Bank trading at support level and demand zone ,previously it spent lot of time in this area before taking off from ,1600 keep checking price action here to long for the target of recent highs long term hold.
Education purpose only do your own research before taking entries.

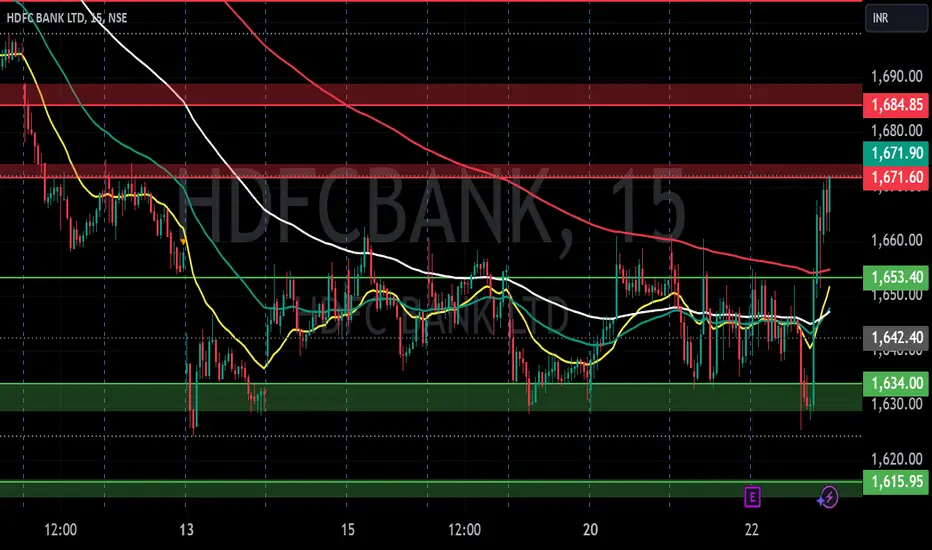
HDFC BANK S/R for 13/1/25Support and Resistance Levels:
Support Levels: These are price points (green line/shade) where a downward trend may be halted due to a concentration of buying interest. Imagine them as a safety net where buyers step in, preventing further decline.
Resistance Levels: Conversely, resistance levels (red line/shade) are where upward trends might stall due to increased selling interest. They act like a ceiling where sellers come in to push prices down.
Breakouts:
Bullish Breakout: When the price moves above resistance, it often indicates strong buying interest and the potential for a continued uptrend. Traders may view this as a signal to buy or hold.
Bearish Breakout: When the price falls below support, it can signal strong selling interest and the potential for a continued downtrend. Traders might see this as a cue to sell or avoid buying.
MA Ribbon (EMA 20, EMA 50, EMA 100, EMA 200) :
Above EMA: If the stock price is above the EMA, it suggests a potential uptrend or bullish momentum.
Below EMA: If the stock price is below the EMA, it indicates a potential downtrend or bearish momentum.
Trendline: A trendline is a straight line drawn on a chart to represent the general direction of a data point set.
Uptrend Line: Drawn by connecting the lows in an upward trend. Indicates that the price is moving higher over time. Acts as a support level, where prices tend to bounce upward.
Downtrend Line: Drawn by connecting the highs in a downward trend. Indicates that the price is moving lower over time. It acts as a resistance level, where prices tend to drop.
Disclaimer:
I am not a SEBI registered. The information provided here is for learning purposes only and should not be interpreted as financial advice. Consider the broader market context and consult with a qualified financial advisor before making investment decisions.
