hdfc bankHdfc BANK support 1700,1670, resistance 1760,1800, i hope chart same down trend, market news base .
HDFA trade ideas

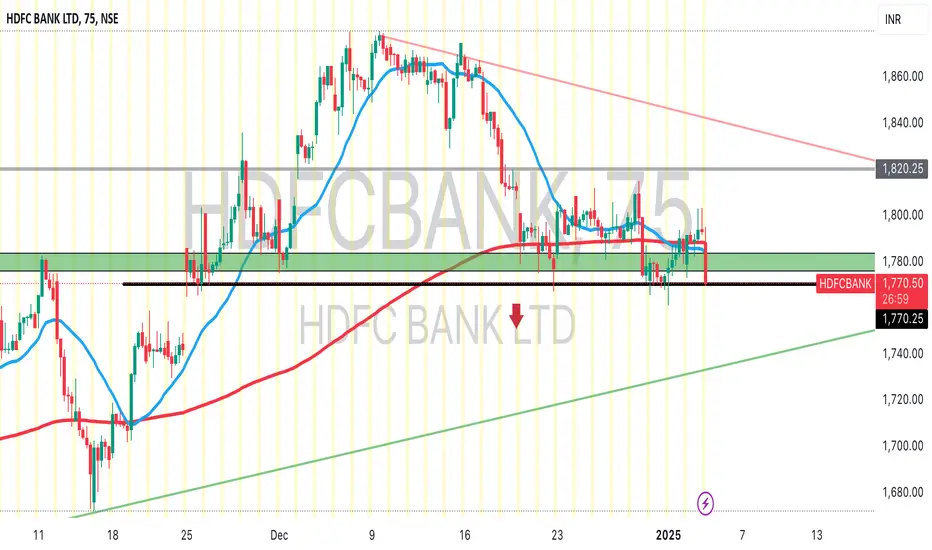
HDFC S/R for 7/1/25Support and Resistance Levels:
Support Levels: These are price points (green line/shade) where a downward trend may be halted due to a concentration of buying interest. Imagine them as a safety net where buyers step in, preventing further decline.
Resistance Levels: Conversely, resistance levels (red line/shade) are where upward trends might stall due to increased selling interest. They act like a ceiling where sellers come in to push prices down.
Breakouts:
Bullish Breakout: When the price moves above resistance, it often indicates strong buying interest and the potential for a continued uptrend. Traders may view this as a signal to buy or hold.
Bearish Breakout: When the price falls below support, it can signal strong selling interest and the potential for a continued downtrend. Traders might see this as a cue to sell or avoid buying.
MA Ribbon (EMA 20, EMA 50, EMA 100, EMA 200) :
Above EMA: If the stock price is above the EMA, it suggests a potential uptrend or bullish momentum.
Below EMA: If the stock price is below the EMA, it indicates a potential downtrend or bearish momentum.
Trendline: A trendline is a straight line drawn on a chart to represent the general direction of a data point set.
Uptrend Line: Drawn by connecting the lows in an upward trend. Indicates that the price is moving higher over time. Acts as a support level, where prices tend to bounce upward.
Downtrend Line: Drawn by connecting the highs in a downward trend. Indicates that the price is moving lower over time. It acts as a resistance level, where prices tend to drop.
Disclaimer:
I am not a SEBI registered. The information provided here is for learning purposes only and should not be interpreted as financial advice. Consider the broader market context and consult with a qualified financial advisor before making investment decisions.

"HDFC Bank Swing Trade: Key Levels & 3-Month Investment Plan"A investment idea for HDFCBANK with a holding period of up to 3 months (till Q1). Here’s the analysis based on the marked levels:
Key Levels and Strategy:
1. Entry Point:
1,719.00: Recommended entry level.
2. Take Profit (TP) Targets:
TP 1: 1,778.55
TP 2: 1,818.70
TP 3: 1,906.55 (longer-term target).
3. Stop-Loss (SL) Levels:
SL: 1,697.25 (first risk level, can act as minor support).
Strict SL: 1,671.95 (final stop-loss level to limit risk).
Observations:
Risk-Reward: This strategy provides a well-defined risk-to-reward ratio, with three potential profit levels.
Support Zone: The area around 1,697.25 - 1,671.95 is critical. It might act as strong support if the price drops further.
Resistance Levels:
1,778.55: Could face selling pressure as it aligns with prior resistance.
1,818.70: A stronger resistance where bulls need momentum to break through.
Recommendation:
If the price moves to the entry level (1,719.00), ensure to set your stop-loss and gradually book profits at the mentioned TP levels.
Reassess market conditions if it approaches strict SL (1,671.95) to avoid excessive losses.
Disclaimer:
"I'm not SEBI registered. Please take any trade at your own risk. Market securities are subject to market risks. This is for educational purposes only.
Would you like further insights into technical indicators or additional strategies?
Thank you! Subscribe and like @Alpha_strike_trader."

HDFC BANK S/R for 6/1/25Support and Resistance Levels:
Support Levels: These are price points (green line/shade) where a downward trend may be halted due to a concentration of buying interest. Imagine them as a safety net where buyers step in, preventing further decline.
Resistance Levels: Conversely, resistance levels (red line/shade) are where upward trends might stall due to increased selling interest. They act like a ceiling where sellers come in to push prices down.
Breakouts:
Bullish Breakout: When the price moves above resistance, it often indicates strong buying interest and the potential for a continued uptrend. Traders may view this as a signal to buy or hold.
Bearish Breakout: When the price falls below support, it can signal strong selling interest and the potential for a continued downtrend. Traders might see this as a cue to sell or avoid buying.
MA Ribbon (EMA 20, EMA 50, EMA 100, EMA 200) :
Above EMA: If the stock price is above the EMA, it suggests a potential uptrend or bullish momentum.
Below EMA: If the stock price is below the EMA, it indicates a potential downtrend or bearish momentum.
Trendline: A trendline is a straight line drawn on a chart to represent the general direction of a data point set.
Uptrend Line: Drawn by connecting the lows in an upward trend. Indicates that the price is moving higher over time. Acts as a support level, where prices tend to bounce upward.
Downtrend Line: Drawn by connecting the highs in a downward trend. Indicates that the price is moving lower over time. It acts as a resistance level, where prices tend to drop.
Disclaimer:
I am not a SEBI registered. The information provided here is for learning purposes only and should not be interpreted as financial advice. Consider the broader market context and consult with a qualified financial advisor before making investment decisions.

HDFC Elliot wave Buy setupHDFC Elliot wave Buy setup in Weekly Time frame as per elliot count market has to come down below 1675 -1475 range good for accumulating target 2756

HDFC Bank | Short | SwingIf HDFC Bank breaks the neck line of this Head and Shoulder Pattern on the hourly chart by the close of the first hour of todays trading, I anticipate that it will be testing levels of 1733 in the coming week.
Price has been clearly rejected from the Higher time frame pivots and this is an indication of weakness.
Needless to say, Bank Nifty view will also be in sync with HDFC Bank and ICICI Bank.
So positions can be built accordingly.
Best Intraday stocks technical & fundamental analysis| 3-jan2025Technical Analysis stocks (3-jan-2025)
follow us for more updates and information
message us for any stocks entry & exit and targets and related information.

Best Intraday stocks technical & fundamental analysis| 31Dec2024Technical Analysis of Moving average stocks (31/Dec/2024)
follow us for more updates and information
message us for any stocks entry & exit and targets and related information.

Viduimport yfinance as yf
import pandas as pd
import numpy as np
import matplotlib.pyplot as plt
# Function to check for price and volume breakouts
def breakout_scanner(ticker, price_breakout_pct=1.05, volume_mult=1.5, lookback=20):
# Download historical data (6 months of daily data)
df = yf.download(ticker, period="6mo", interval="1d")
# Calculate moving averages for volume
df = df .rolling(window=lookback).mean()
# Get the recent high and low
recent_high = df .max()
recent_low = df .min()
# Last row data (current day)
last_row = df.iloc
# Check for Price Breakout (above recent high or below recent low)
price_breakout_up = last_row >= recent_high * price_breakout_pct
price_breakout_down = last_row <= recent_low * (2 - price_breakout_pct) # A breakout below recent low
# Check for Volume Breakout (above average volume threshold)
volume_breakout = last_row >= df .iloc * volume_mult
# Print scanner results
if price_breakout_up:
print(f"{ticker}: Price Breakout Up! (Price above {recent_high * price_breakout_pct})")
if price_breakout_down:
print(f"{ticker}: Price Breakout Down! (Price below {recent_low * (2 - price_breakout_pct)})")
if volume_breakout:
print(f"{ticker}: Volume Breakout! (Volume above {df .iloc * volume_mult})")
# Optional: Plot stock chart for visual inspection
df [ ].plot(figsize=(10,6), subplots=True)
plt.suptitle(f'{ticker} - Price and Volume Breakout')
plt.show()
# List of stocks to scan
stocks =
for stock in stocks:
breakout_scanner(stock)

Best Intraday stocks fundamental-technical analysis |30 Dec 2024Fundamental Technical Analysis of Moving average stocks (30/Dec/2024)
follow us for more updates and information
message us for any stocks related information

"Flag Pattern" **||HDFC Bank Ltd||**
* 3 and Half Year Consolidation touched on resistance & Support multiple times trend line Year Feb-21 TO Sep-24. Tight Symmetrical Triangle Pattern Breakout in Weekly TF.
* Expected To reach at the next level. Price level - 3760

HDFC Bank: Massive Breakout Loading!🚀HDFC Bank💥 is gearing up for a **huge move**, consolidating with **low volatility** and holding strong at key support levels. The setup is screaming potential for a breakout—but where could it go next?
🔑 **Why It’s Exciting:**
- Price has been coiling tightly = Big move brewing
- Strong support zone holding firm = Buyers stepping in
- Historical breakouts from similar setups have seen explosive follow-through
💡 **Target After Breakout:**
A breakout could push HDFC Bank toward the **2,000-2,050 zone**, with additional potential for further gains if momentum accelerates.
**What’s your target price? Are you ready for the ride?** Let’s hear your thoughts below! 📈

Best Intraday stocks technical analysis | 27 Dec 2024Technical Analysis of Moving average stocks (20/Dec/2024)
follow us for more updates and information
message us for any stocks related information.

Swing Trading Strategy: HDFC Bank (HDFCBANK)Stock Outlook:
I maintain a bullish outlook on HDFC Bank (HDFCBANK) with a swing trade target of ₹1913.15 by February 27, 2025. This target aligns with the current technical and market trends indicating upward momentum.
Stop Loss Strategy:
To manage downside risk, ₹1600 has been identified as a crucial support level. Any daily settlement below this level will signal a potential breakdown, and positions should be exited accordingly.
Key Notes:
Risk Management: Ensure position sizing aligns with your overall risk tolerance.
Timeframe: This strategy is based on a swing trading approach and is meant to capitalize on short- to medium-term market movements.
Disclaimer:
This trading strategy is for informational purposes only and does not constitute financial advice. Market conditions are subject to change, and all trades carry risks. Please consult a financial advisor or conduct your own research before making any investment decisions. Past performance does not guarantee future results.

HDFC BANK S/R for 23/12/24Support and Resistance Levels:
Support Levels: These are price points (green line/shade) where a downward trend may be halted due to a concentration of buying interest. Imagine them as a safety net where buyers step in, preventing further decline.
Resistance Levels: Conversely, resistance levels (red line/shade) are where upward trends might stall due to increased selling interest. They act like a ceiling where sellers come in to push prices down.
Breakouts:
Bullish Breakout: When the price moves above resistance, it often indicates strong buying interest and the potential for a continued uptrend. Traders may view this as a signal to buy or hold.
Bearish Breakout: When the price falls below support, it can signal strong selling interest and the potential for a continued downtrend. Traders might see this as a cue to sell or avoid buying.
MA Ribbon (EMA 20, EMA 50, EMA 100, EMA 200) :
Above EMA: If the stock price is above the EMA, it suggests a potential uptrend or bullish momentum.
Below EMA: If the stock price is below the EMA, it indicates a potential downtrend or bearish momentum.
Trendline: A trendline is a straight line drawn on a chart to represent the general direction of a data point set.
Uptrend Line: Drawn by connecting the lows in an upward trend. Indicates that the price is moving higher over time. Acts as a support level, where prices tend to bounce upward.
Downtrend Line: Drawn by connecting the highs in a downward trend. Indicates that the price is moving lower over time. It acts as a resistance level, where prices tend to drop.
Disclaimer:
I am not a SEBI registered. The information provided here is for learning purposes only and should not be interpreted as financial advice. Consider the broader market context and consult with a qualified financial advisor before making investment decisions.

Best Intraday stocks technical analysis | 20 Dec 2024Technical Analysis of Moving average stocks (20/Dec/2024)
follow us for more updates and information
message us for any stocks related information.

Best Intraday stocks technical analysis | 19th Dec 2024Technical Analysis of Moving average stocks (19/Dec/2024)
follow us for more updates and information
message us for any stocks related information.

Best Intraday stocks technical analysis | 16th Dec 2024Technical Analysis of Moving average stocks (16/Dec/2024)
follow us for more updates and information
message us for any stocks related information.

HDFCBANK Defies Market Panic Amid Election Volatility?HDFCBANK Stock Analysis – June 2024
Overview:
On May 30, 2024, the HDFCBANK spot closed at 1514.85 with an ATM IV of 25.69. According to my algorithm, the VVIX (VolatilityVision Index) was at 25.5614, indicating that bullish investors in this stock were not panicking over the impending Lok Sabha election results on June 4, 2024.
Key Levels:
- Probable Resistance: 1600.10
- Ultimate Breakdown Level (Black Swan Event): 1239.65
- Crucial Midpoint: 1419.20 (derived from the average of the resistance and breakdown levels)
Price Action Analysis:
Post-May 30, 2024, these levels showed significant correlation with market movements:
- June 3, 2024: Following stellar exit polls, HDFCBANK spot opened at 1599, which was also the day's high, demonstrating respect for the resistance at 1600.10. The stock closed at 1572.20.
- June 4, 2024 (Election Results Day): The stock opened at 1557.00, peaked at 1559.00, and then collapsed to a low of 1454.00. This action again showed respect for the midpoint price of 1419.20, implying that traders bought the dip with a stop-loss at this level.
Outlook:
If HDFCBANK spot does not test the midpoint of 1419.20, I expect the stock to retest the resistance at 1600.10. This is my personal view, and I am not suggesting anyone follow this analysis without their own due diligence.
Stay updated with more insights and analyses on our channel.

HDFCBANK Monthly TF AnalysisHello Investors and traders. Hope you are doing great and learning .
This is my view on the HDFCBANK for the upcoming months / years .
Its facing resistance at 1700 levels . It tried to breach the resistance level but ended up taking support around 1500 & 1600 .
For the past one year its giving a good uptrend , taking support around the trendline .
Taking the previous year high and low as anchor points , I plotted a parallel channel and projected it upwards . A break in the resistance levels with good volumes can give you a target of 1945 . The trading volumes are high and is similar to the COVID - Stage levels .
My view is bullish . Be cautious as it is trading near to the trend line and a small sell off might break the trend line causing the setup to invalidate .
Trade what you see not what you feel .
This is just view based on current market trend and pure analysis purpose .
Please consult with your financial advisor before you deploy any real money for trading .

BUY HDFC BANK ABOVE 1906HDFC Banks is bullish and will give a fresh breakout above 1906.
Buy HDFC Bank if closes above 1906 on daily time frame for the Targets of 1974 and 2047 until 1824 is intact on downside.
To motivate us, Please like the idea If you agree with the analysis.
Happy Trading!
InvestPro India

HDFC BANK S/R for 16/12/24Support and Resistance Levels:
Support Levels: These are price points (green line/shade) where a downward trend may be halted due to a concentration of buying interest. Imagine them as a safety net where buyers step in, preventing further decline.
Resistance Levels: Conversely, resistance levels (red line/shade) are where upward trends might stall due to increased selling interest. They act like a ceiling where sellers come in to push prices down.
Breakouts:
Bullish Breakout: When the price moves above resistance, it often indicates strong buying interest and the potential for a continued uptrend. Traders may view this as a signal to buy or hold.
Bearish Breakout: When the price falls below support, it can signal strong selling interest and the potential for a continued downtrend. Traders might see this as a cue to sell or avoid buying.
MA Ribbon (EMA 20, EMA 50, EMA 100, EMA 200) :
Above EMA: If the stock price is above the EMA, it suggests a potential uptrend or bullish momentum.
Below EMA: If the stock price is below the EMA, it indicates a potential downtrend or bearish momentum.
Trendline: A trendline is a straight line drawn on a chart to represent the general direction of a data point set.
Uptrend Line: Drawn by connecting the lows in an upward trend. Indicates that the price is moving higher over time. Acts as a support level, where prices tend to bounce upward.
Downtrend Line: Drawn by connecting the highs in a downward trend. Indicates that the price is moving lower over time. It acts as a resistance level, where prices tend to drop.
Disclaimer:
I am not a SEBI registered. The information provided here is for learning purposes only and should not be interpreted as financial advice. Consider the broader market context and consult with a qualified financial advisor before making investment decisions.

Best Intraday stocks technical analysis | 12th Dec 2024Technical Analysis of Moving average stocks (12/Dec/2024)
follow us for more updates and information
message us for any stocks related information.
