TradeFinder: Summary of Ultra Short Term RatingsTradeFinder: Summary of Ratings
The ratings for large caps as at yesterday's close (Thursday, 26 January 2023).
Please note, data is subject to change and is applicable to traders with a short term/active trading view.
For more of these research insights (including trade ideas and the full data set), get in touch today.
IPHB trade ideas

PGMs Relative To Top 40This insight was published on our client platform yesterday evening. For more of these research insights (including trade ideas), get in touch today.
Sector of The Week: Platinum & Precious Metals
The relative trend is down, with the sector near a 3-year low versus the market. Considering the momentum readings, the 14-day RSI shows strong momentum to the downside but also a excessively oversold conditions with the prior peaks and troughs coinciding with turns in the relative performance of the sector vs the index.
Chart: PGMs Relative To The Top 40 Index

Continue to pushWe might see this guys continue to gain some strength following that CoC which shows that they are not changing direction to bullish side


IMplats long after a extended sideways move Target R259.69Cup and Handle has formed on Implats. The price has broken out and is meandering sideways before the next move up.
Platinum companies as well as the precious metal is setting itself for great upside as investors and instiutions are piling their funds into the metal as a form of safe haven... We are going old school right now where the old ways work better than investing in unstable Cryptos...
More bullish signs 7 > 21 > 200
Target R259.69
Bullish

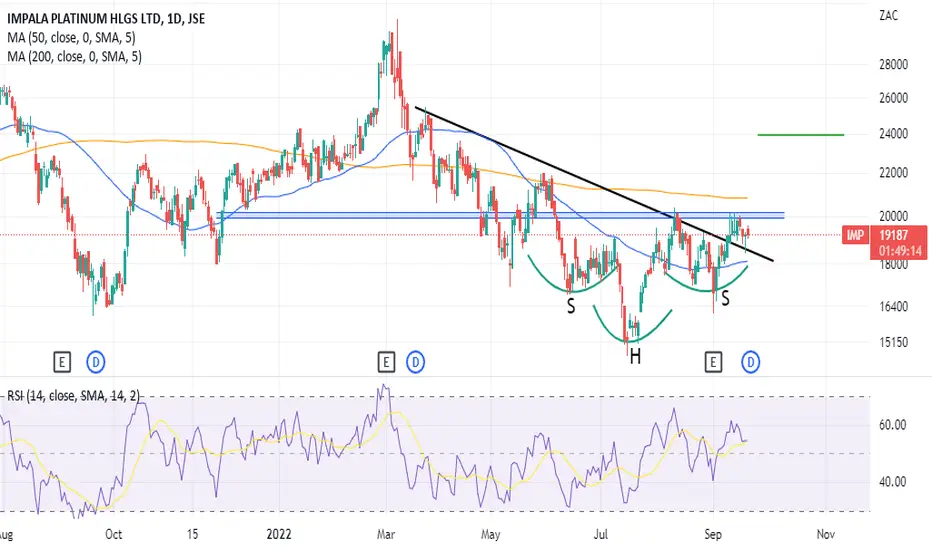
$JSEIMP - Impala Platinum: Short-term BullishImpala hit an all time high in March 2022 at R309,19 and then shed 52,5% in a bear correction that looks to have bottomed at R146,80.
What gives me confidence in a short-term bull run is the rally for wave (i) unfolded in five waves and the correction for wave (ii) unfolded in three waves and terminated above R146,80.
The current rally from R153,55 already looks impulsive.
A break below R146,80 invalidates this entire outlook.

IMPALA - Short SWING IDEAImpala has hit up against the down trending 200dma with oscillators indicating that its overbought.
Looking for a short trade towards the R172-R177 zone
A daily close above R208 will negate the idea

IMP - 1D - IMPALAThe price of Platinum has reached the bottom of a support line coming from 2008. It has also broken through the downward trendline coming from March 2022.Impala is moving in a sideways channel since September 2020. Momentum is to the top and Macd is crossing over on the weekly chart. Price action on the weekly chart is crossing over the EMA21. It has recently broken the resistance of 191.96, and we are looking to buy after a pullback possibly to this price, with a first target of 18% and then possibly 59% to the upside. Although there has been negative news on earnings forecast, i believe this is already priced in to the shareprice.

IMPALA PLAT - AnalysisImpala has been on a short term downtrend since reaching a high of R309.20
Price has now arrived at the 200day on the weekly and a possible support zone for a some relief. The last time price reacted on the moving average was at the covid lows of March 2020.
Above R185 could stage a decent pullback and will trigger a 2B reversal trade. Better entries will be possible on the lower timeframes for the bulls.
The swing low will need to hold here or else a bigger double top will be in play.
-- MANAGE YOUR RISK - -
Disclaimer: All ideas are my opinion and should not be taken as financial advice.


Nice bouncecheck out this long log chart for $IMPUY Impala Platinum.
Nice bounce this month so far, big support.
Big dividends.


AG Capital -Storm trading Morning Call 29 April 2022We give a quick recap of markets overnight and the previous day and insights into the day ahead with a few trade ideas on the day. Ideas are strictly NOT INVESTMENT ADVICE.

AG Capital -Storm trading Morning Call 28 April 2022We give a quick recap of markets overnight and the previous day and insights into the day ahead with a few trade ideas on the day. Ideas are strictly NOT INVESTMENT ADVICE.

IMP holding R205,00 support IMP has held support for the last 3 weeks off the 205 -210 support zone,
this support zone is also the 250dma , lets see if she can move higher in the coming weeks

Bullish engulfing - IMPA large bullish engulfing candle has formed on JSE:IMP . This is a bottom reversal signal and I think we could see a nice upward move from here.

AG Capital -Storm trading Morning Call 11 April 2022We give a quick recap of markets overnight and the previous day and insights into the day ahead with a few trade ideas on the day. Ideas are strictly NOT INVESTMENT ADVICE.

JSE:IMP, Possible long oppLooking at the Monthly chart we see price testing the lower bounds of the trend line at the 20500 level. If we zoom into the weekly chart a bullish wedge price pattern is forming. If we zoom in yet again into the daily chart price has just closed above the EMA200. This is a decent spot to take a long position with an R/R. Always manage your risk. acolytetrader.co.za

IMP: LongStochastic gave a bullish signal
MACD has not crossed, Wait on the bullish crossover
SL: 220.81
TP 1: 258.75
TP 2: 290.69

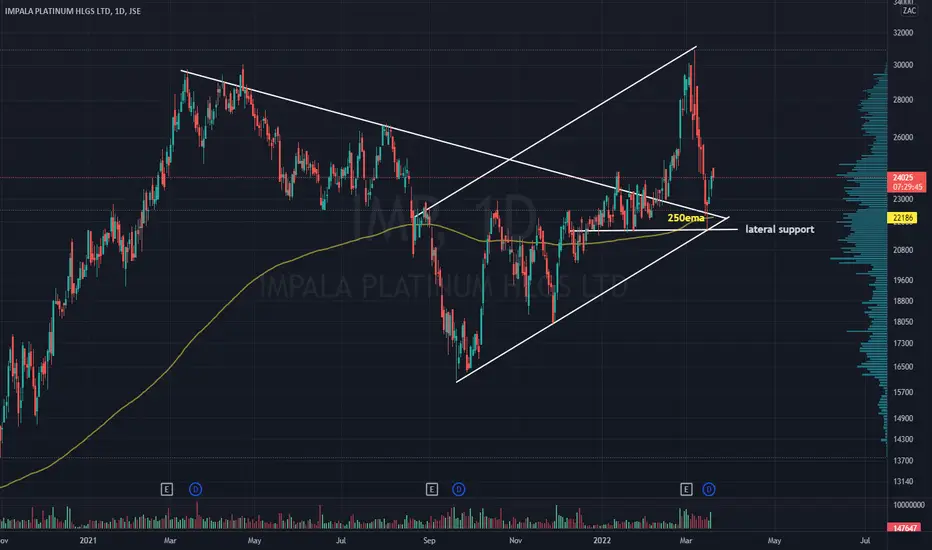
IMP triple confluence bounce off supportsIMP has bounced off the 250ema( 1 year average) + lateral support and retest of trendline
AG Capital -Storm trading Morning Call 2 March 2022We give a quick recap of markets overnight and the previous day and insights into the day ahead with a few trade ideas on the day. Ideas are strictly NOT INVESTMENT ADVICE.

IMP: change in trend to bullish?A bullish trend is applicable above 22600.
Upside price momentum supports the bullish trend.
200-day acting as major support.
RSI leaves some room for further upside price potential.
MACD is also confirming a change in trend direction to bullish.
Remains a risky trade.
