MDO trade ideas
MCD Filling GapsCurrently MCD is in a downward trend and is currently just above a gap area. The 50 SMA is about to cross below the 200 SMA and that is a bearish signal, along with the fact that recently the stock has been printing lower highs and lower lows. I am looking to short all the way down to $168 where there is a support line. This support line is above another gap and if the support line breaks, MCD will drop to at least $161 if not lower.
I look forward to hearing your comments about the topic and am constantly looking for feedback to improve my analysis. I am open to discussion about my idea.


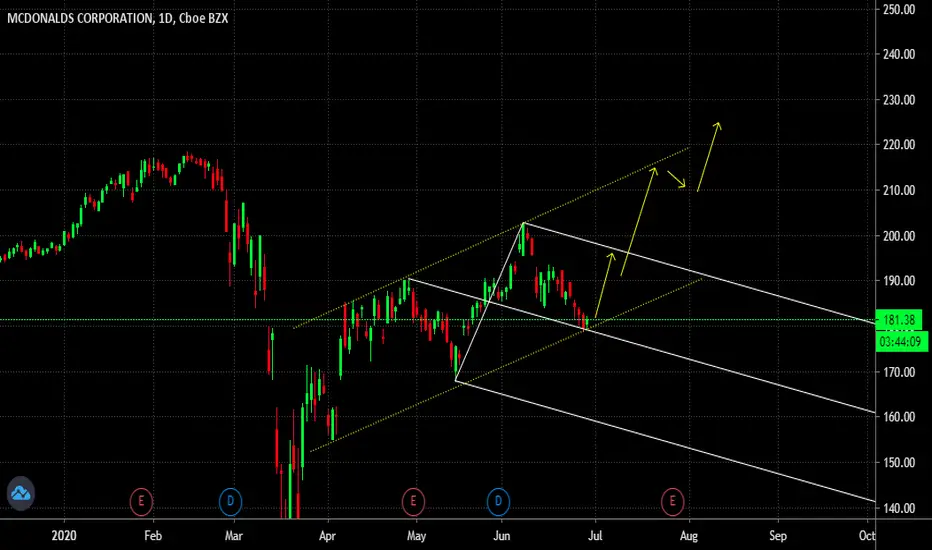
Mcdonalds Channel BuyBottom of channel
Potential breakout of broadening wedge which may be acting as a flag for a bull flag forming.
Personally i feel public sentiment for MCD is declining but im sure its used now just for its convenience.

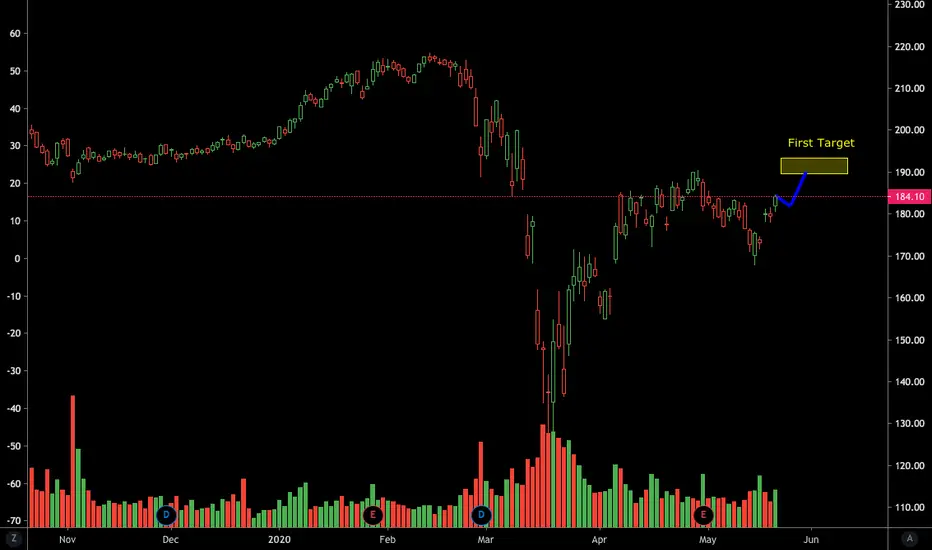
MCDONALDS (MCD) Bullish Continuation Trade
hey guys,
MCD is retesting a key 3 days/daily level.
on 1H the price has formed an inverted h&s pattern on that and just recently the neckline was broken with retest.
now the price will keep growing to retest the current local structure high.
T1 - 196.0
T2 - 202.0
Stop - 186.85


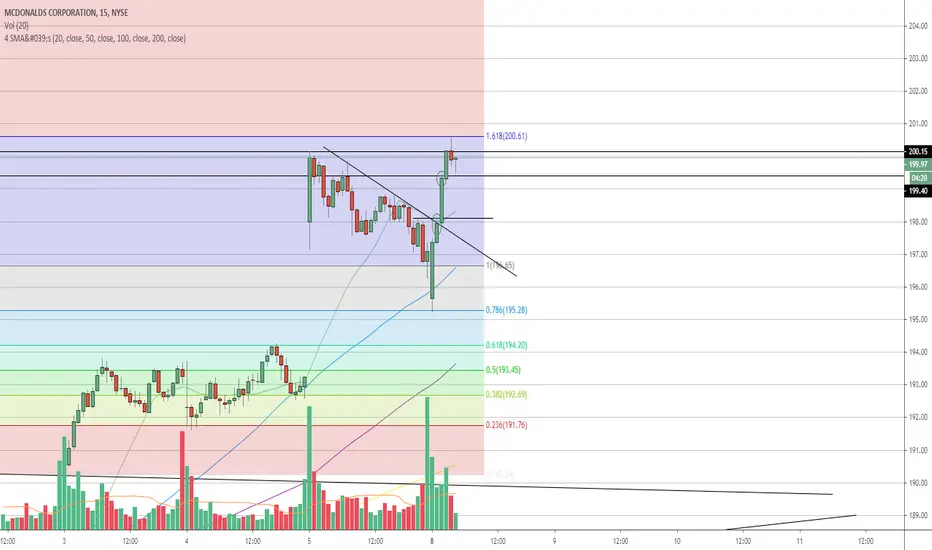
MACDONALDS DAILY ANALYSISHi friends
the graph shows with a very high probability that this market is stable horizontally for the moment therefore nothing should be done before having clear visibility to make a decision

Re-entry point ahead?Possibly a drop to around 180 the backup, or given current re-openings it could just continue upwards as it seems to be at fair value right now according to some analysts

MDC SignalIm getting MCD July 17, 200 Calls for MCD target is $203.11, this will likely be a day trade
Direct Message me if you want info on Trading group

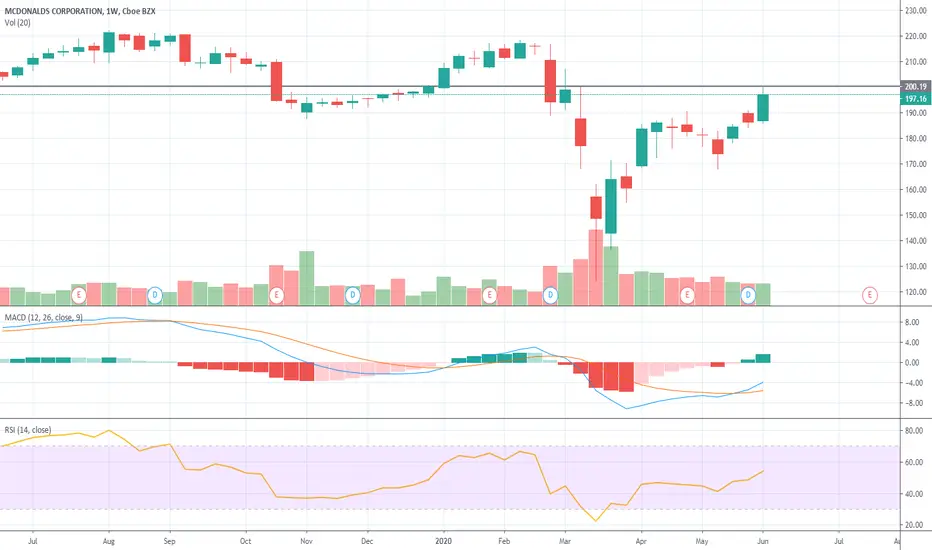
Will it be go week ?MCD's just crossed the 200 on the daily last Thursday, and closed the week out at a long term point of resistance. If it crosses here this week MCD's could be back in a long term upward trend once again (fingers crossed). Get out of the house and start buying them burgers!
2 hour chart of $MCD Impulsive down, corrective upWhen will the bear return in this stock ? with break of lower parallel of schiff upsloper


McDonalds BreakOut Could Rally Above 210IF the bullish momentum observed on MCD is maintained throughout this week, then the stock could likely be eyeing 210 and above in coming weeks...
N.B
- Let emotions and sentiments work for you
-ALWAYS Use Proper Risk Management In Your Trades

MCDONALD'S 1D RANGE TRADES Ranges are repeatable trading chart patterns.
Ranges are consolidation chart patterns that can breakout either direction.
Each chart pattern will have defining trendlines of the support/resistance levels creating the pattern.
Whatever time frame you are trading this chart pattern, wait for a candle close outside of the trendline in the direction of the breakout candle. (Our time frame preference is the Daily chart).
Add volume indicator - Volume is the amount of $ that went into a particular candle or in Forex the # of trades that took place.
Add ATR indicator - Volatility is the amount of price movement that occurred. Use the ATR to measure the price movement.
When you see descending Volume bars and descending ATR line (which indicates volatility) this shows
a dis-interest in traders to invest in this pair creating consolidation which creates the chart pattern.
Trade Management after there is a breakout candle close.
1 - Position size (compare volume bar to volume ma line).
a - Breakout candle must be 100% of average volume for a full position size.
b - If 75% of average volume then ½ position size. (To find 75% of Volume
look at the charts volume settings – divide smaller # into larger # = 75%+)
2 - Enter two trades.
3 - SL for both trades will be 1.5 x ATR.
4 - 1st trade TP will be 1 x ATR.
5 - No TP on 2nd trade – letting profit run and adjusting SL to follow price.
6 - When 1st TP hit – move 2nd trade SL to breakeven.
7 - Adjust the 2nd trade SL to follow price.
*8 – After Breakout candle – if price closes back into chart pattern close trade
*9 - When breakout candle is more than 1 ATR from breakout candle open.
a - Enter 1st trade at candle close with ½ position size.
b - Enter 2nd trade with a pending limit order that is 1 ATR of breakout candle open.
c – Price should pullback to that pending limit order for 2nd trade.
d – If Price returns back into chart pattern close trade before SL is hit.

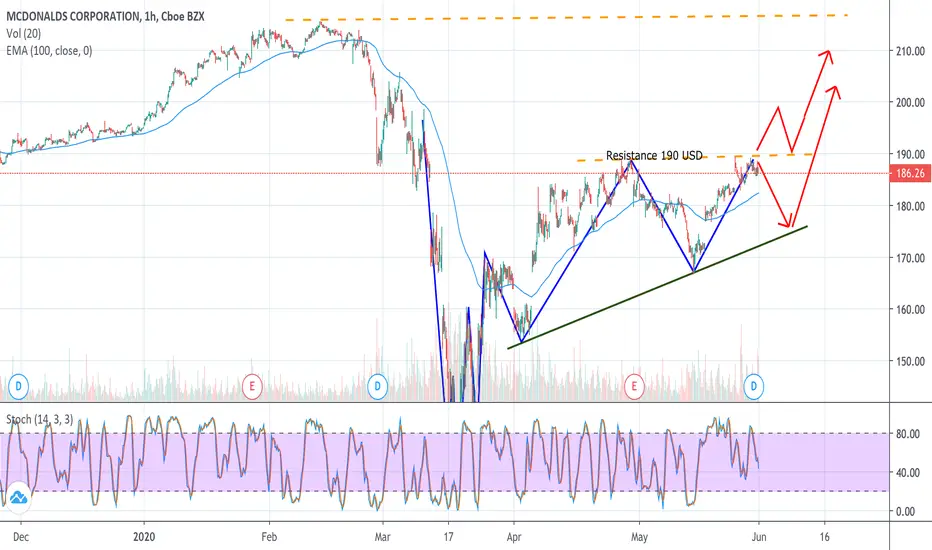
MCD - McDonald's Technical AnalysisTechnical Analysis - The idea is to go long but wait that the support of 190.00 usd will be broken before buying.
There might be a possibility of a price retracement that will test agin the bullish trendline.
Fundamental Analysis:
The fast-food chain was among the best performers during the Great Recession of 2008 and 2009 and looks poised to repeat that accomplishment
mc daily chartit seems that this price has a lot of sellers so we setup a trade with good risk/reward ratio.

A Brief StormThere is a formation of an upward wedge for the large part of May. But in the longer part, there seems to be an upward trendline regarding support. The way I see it, it has a good chance at failing to break the resistance in the short run, but it could do it in June, especially with the economy starting to open up.

McDonald's The trend is bearish. So it's better to take only sell trades. For now use range trade rules.

McDonalds to Retest Recent HighA simple retest of recent high, the overall market conditions are poor with insolvency issues across the economic landscape---so no heroics.