Possible Bullish Setup on MSFTMSFT: I see another potential bullish play setting up here for a possible day trade. Key level to watch here is a break above 377 which would prompt a fast move towards 380 (PT1) and 383 (PT2). Please see chart for details!
MSF trade ideas

MsftChop for the last month here. Either consolidation or distribution
Bigger picture here is the ascending broadening wedge inside white trendline.. this is a bearish pattern... if msft breaks below and closes below 366 than the correction has started to 300 with a pit stop to 330 first..
Inside the major pictues is a smaller pennat that msft has been trading inside..
366-376 is the pennants range. Over 377 and 400 comes. Below 366 and 330 incoming


Not looking good for MSFT bullsMSFT is testing a recent trend line with the lowest volume yet. Will be watching MSFT to see if it can take out the November 9th lows and either retest failed support or the underside of the 50 SMA / trendline.
Will start to develop a trade plan on the short side if the above materializes.
Cheers!

400 Not Far AwayWhile it is completely possible that wave 4 of 5 is done, the greater market supports a wave 4 of 5 target around 350. That said, 400 is likely still in MSFT’s future and a wave 4 of 5 pullback toward 350 would be a bullish gift.

MICROSOFT: Bearish breakout under the 1D MA50.MSFT has turned neutral on its 1D technical outlook (RSI = 46.496, MACD = 1.200, ADX = 24.141) as the price reached the 1D MA50 for the first time since late October on a sideways price action. Since the 1 year pattern is a Channel Up, we expect its bottom to get tested (TP = 345.00) if the 1D MA50 is crossed. Consider it a bearish breakout signal.
See how our prior idea has worked:
## If you like our free content follow our profile to get more daily ideas. ##
## Comments and likes are greatly appreciated. ##

MSFT AnalysisPrice played out nicely as per last analysis, giving us a +14.10% move to the upside. After this nice bullish move, I'm expecting price to make a bearish retracement into the discount level. Potential target for the bearish retracement is the bullish OB at 346.20.

MSFT downWith the overall market and tech sector turning bearish this one looks like perfect short for me.
Head & shoulders with a long right shoulder. Looks weak.
Down we go?
Stop loss above the red line

Microsoft Stock Analysis: Navigating Key Support Levels – BreakTitle: Microsoft Stock Analysis: Navigating Key Support Levels – Breakout or Bounce?
Microsoft (MSFT) stock is currently at a critical point, hovering around key support levels, prompting investors to closely analyze potential outcomes – a decisive breakout or a bounce.
Support Levels under Scrutiny:
MSFT is currently navigating through pivotal support levels, marking a crucial phase in the stock's trajectory. The response within this range is pivotal for assessing whether a substantial directional shift is in the cards.
Breakout Scenarios:
A successful breach of these support levels by Microsoft could signal a noteworthy shift in market dynamics. Traders are meticulously examining trading volumes and various technical indicators to identify confirmation signals, potentially pointing towards a bearish trend.
Bounce-Back Potential:
Conversely, should Microsoft consolidate and find support at the current levels, it may set the stage for a resilient bounce. Positive market sentiment, strong fundamentals, or favorable news could reignite investor confidence, propelling the stock upwards.
Investors are advised to closely monitor how Microsoft navigates within these crucial support levels. Whether it's gearing up for a breakout or preparing for a rebound, understanding these potential scenarios is essential for making informed decisions amidst the evolving market dynamics.

Mastering Support and Resistance: Part 1Hello Traders, and welcome to a new year of endless learning opportunities! Today, we will kick off 2024 by exploring the concept of support and resistance, how to identify these levels and common misconceptions about them. Support and resistance levels play a crucial role in technical analysis and can greatly impact your trading strategy. Understanding these levels and knowing how to effectively use them can make all the difference in your trading success. We will be doing a deeper dive in a subsequent article later this week where we will cover more advanced techniques and the psychology behind support and resistance. In the meantime, are you ready to dive in?
Understanding Support and Resistance Levels in Trading
Support and resistance levels are key aspects of technical analysis that traders incorporate into several different trading decisions. Support refers to a price level where buying pressure is expected to be strong enough to prevent the price from falling further. On the other hand, resistance is a price level where selling pressure is expected to be strong enough to prevent the price from rising higher. These levels are based on the idea that markets often go through similar patterns and respond to certain prices.
The Importance of Support and Resistance in Technical Analysis
Support and resistance levels are crucial in technical analysis for several reasons. Firstly, they provide traders with valuable information about market sentiment. When the price approaches a support level, it indicates that buyers are likely to step in and try to push the price up. Conversely, when the price approaches a resistance level, it suggests that sellers are likely to enter the market to push the price down. Understanding market sentiment can help traders avoid potential losses.
Secondly, support and resistance levels act as a reference point for setting profit targets and stop-loss levels. By analyzing historical price movements, traders can identify key support and resistance levels that are likely to be tested in the future. These levels can be used to determine when to take profits or cut losses, providing a clear framework for risk management.
Lastly, support and resistance levels can act as confirmation tools for trading signals. For example, if a trader receives a buy signal from a set of technical indicators and the price is approaching or bouncing off of a strong support level, it adds credibility to the signal.
Similarly, if a sell signal is generated and the price is approaching or moving away from a major resistance level, it strengthens the validity of the signal. By combining support and resistance levels with other technical indicators, traders can increase the accuracy of their trading signals.
Identifying Support and Resistance Levels on Price Charts
Identifying support and resistance levels on price charts is a fundamental skill for any trader. Several methods can be used to identify these levels, depending on the trader's preference and trading style. Here are a few common techniques:
Swing Highs and Lows: Horizontal support and resistance levels can be identified by analyzing price charts. A support level is typically formed by connecting multiple swing lows, where the price has previously bounced back up. Conversely, a resistance level is formed by connecting multiple swing highs, where the price has previously reversed its upward trajectory. By identifying these levels, traders can anticipate potential reversals or breakouts and adjust their trading strategy accordingly.
It is important to note that support and resistance levels are not exact price points, but rather zones where buying or selling pressure is expected to be strong. Traders should use a combination of these techniques and exercise discretion to identify the most relevant support and resistance levels on their price charts.
Moving Averages: Moving averages are commonly used to identify trends in price charts, but they can also act as dynamic support and resistance levels. For example, a 200-day moving average is often considered a strong support or resistance level. When the price approaches this moving average, it is likely to either bounce off or breakthrough, depending on the prevailing trend.
Fibonacci Levels: Fibonacci levels are based on mathematical sequences. These levels are used to identify potential support and resistance levels based on the percentage retracement of a previous price move. Traders often look for confluence between Fibonacci levels and other technical indicators to increase the reliability of their analysis. Several different tools on TradingView can be used to identify these levels such as a Fibonacci retracement or Fibonacci Channel.
How to Effectively Use Support and Resistance in Your Trading Strategy
Once you have identified support and resistance levels on your price charts, it is important to know how to effectively use them in your trading strategy. Here are some key considerations:
Combine with other indicators: Support and resistance levels should not be used in isolation but should be combined with other technical analysis techniques. Relying solely on support and resistance levels can result in false signals, as price can break through or reverse at unexpected times. Consider using trend lines, candlestick patterns, or oscillators to confirm your support and resistance levels and increase the accuracy of your trading signals.
Price Action: Observing price action around support and resistance levels can provide valuable insights into market sentiment. Look for signs of price rejection, such as long wicks or multiple failed attempts to break through a level. Price patterns may also form around support or resistance levels. These signs can indicate potential reversals or breakouts.
Risk Management: Support and resistance levels can be used to determine stop-loss levels and profit targets. When entering a trade, set your stop-loss just below a support level for long positions or just above a resistance level for short positions. Similarly, set your profit target at the next significant support or resistance level to ensure a favorable risk-reward ratio.
Multiple Timeframes: Analyzing support and resistance levels across multiple timeframes can provide a broader perspective on market dynamics. A level that appears strong on a daily chart may be insignificant on a weekly or monthly chart. Consider higher timeframe levels for long-term trades and lower timeframe levels for short-term trades.
Common Misconceptions About Support and Resistance
There are several common misconceptions about support and resistance levels that traders should be aware of. Understanding these misconceptions can help you avoid common pitfalls and make better trading decisions. Here are three common misconceptions:
Support and Resistance Levels Are Fixed: One of the most common misconceptions is that support and resistance levels are fixed and remain unchanged over time. In reality, these levels are dynamic and can shift as market conditions change. Traders should regularly reevaluate and adjust their support and resistance levels based on new price information.
Support Turns into Resistance and Vice Versa: Another misconception is that support levels always turn into resistance levels when broken, and vice versa. While this can sometimes be the case, it is not always true. Market dynamics can change, and a support level that has been broken may become irrelevant in the future. Traders should not blindly assume that a broken support level will act as a strong resistance level.
Support and Resistance Levels Are Foolproof: Many traders mistakenly believe that support and resistance levels are infallible and always result in predictable price movements. While these levels can provide valuable guidance, they are not guaranteed to hold or reverse the price. Traders should always use support and resistance levels in conjunction with other technical analysis tools and exercise proper risk management.
By understanding these misconceptions, traders can avoid relying solely on support and resistance levels and develop a more comprehensive trading strategy. We implore you to be thorough in practice and understanding of S&R as there is a great degree of subjectivity to them. The more you understand about these levels the greater accuracy you can obtain.
Tips for Mastering Support and Resistance
Mastering support and resistance requires practice and experience. Here are some tips to help you improve your skills in identifying and utilizing these levels:
Backtesting: Backtesting is a valuable tool for evaluating the effectiveness of support and resistance levels in historical price data. By analyzing past price movements, you can assess how well your identified levels have held or reversed the price. This can provide valuable insights into the reliability of your levels and help you refine your approach.
Focus on Key Levels: Not all support and resistance levels are equally significant. Focus on key levels that have been tested multiple times and have resulted in strong price reactions. These levels are more likely to hold or reverse the price and can provide more reliable trading opportunities.
Practice Patience: Support and resistance levels often require patience to be effective. Wait for clear confirmation before entering a trade, and avoid chasing price or making impulsive decisions based on a single level. Patience and discipline are key to successful trading.
By incorporating these tips into your trading routine, you can enhance your mastery of support and resistance levels and improve your trading performance.
What Does it All Add Up To?
In conclusion, understanding and mastering support and resistance levels is crucial for successful trading. These levels provide valuable information about market sentiment, act as reference points for setting profit targets and stop-loss levels, and can confirm trading signals. By identifying support and resistance levels on price charts using techniques like swing highs and lows, moving averages, and Fibonacci levels, traders can make better judgments in deciding what actions to take. However, it is important to use support and resistance levels in conjunction with other indicators and consider price action for confirmation. Overall, integrating support and resistance levels into a trading strategy can help break through barriers and achieve trading success.


Breakout on #MSFTMSFT about to breakout the range. Once it breaks the range which is 378 it can ride upto 384.

MSFT - Medium TermWave 5 seems to still have some steam left. I expect the price to go up to about 394 (around that mark) before it starts correcting. I intend to watch price action over the worth coming days or weeks and take a short position.

Microsoft - Monthly Bullish BreakoutHello Traders, welcome to today's analysis of Microsoft.
--------
Explanation of my chart analysis:
Since August of 2019 Microsoft stock has been creating a bullish triangle continuation pattern. Recently we saw a breakout above the strong $350 resistance level after which I do expect a retest of the previous structure level and then more bullish continuation towards the upside.
--------
I will only take a trade if all the rules of my strategy are satisfied.
Let me know in the comment section below if you have any questions.
Keep your long term vision.

MSFT stuck in a range - will it go Up or Down?Looking to see what direction MSFT is looking to go. The stock is showing signs of overextending and is one of the weakest of the Mag 7 stocks.
If price retests the lows, will be watching if there is heavy selling with a lack of buyers to enter a short position. If buying is absorbed then MSFT will likely continue range bound.
Will be watching if price retests recent highs and met by sellers. Will look to enter short targeting first the lower range. If price pushes through recent highs and finds support, will look to add a long position.


Strong MSFT Sell SignalsNASDAQ:MSFT
Microsoft is looking massively extended here. There is an 82% chance on the monthly and 3 monthly (this chart). It is also against upward trending resistance. Expect a massive pullback on this stock. It may be a good short opportunity.

5 Reasons To Buy MicrosoftHI there its Lubosi stocks and i would love to thank my mentors:
--
-Tim Sykes who wrote the fore word to the book called Penny Stock Course
-Matthew Kratter who wrote the book called Rocket stocks
-Robert Kiyosaki who wrote the book rich dad poor dad
As i arose during this morning on a festive season, around the world.
I looked at the charts and remembered the first time
i learnt how to trade a stock
--
I went through a tuff process to understand this strategy
called the rocket booster strategy.
--
I remember reading Matthew kratters books for a approx. total of about 90
days straight of rereading it over and over again.
--
It was during the time i lost my ex girlfriend to another man
that break up really hurt me
--
So i pounded these trading books with my blood, sweat and tears
until finally i developed the rocket booster strategy.
--
Using this strategy i have written ''5 Reasons To Buy Microsoft" :
The Price is above the 200 EMA
The price is above the 50 EMA
The bulls has over taken the bears
The buying power is in the uptrend
The 50 EMA Has Crossed Above The 200 EMA
-- If you would like to learn more rocket boost this content.
**Disclaimer:**
The information provided above is for educational and informational purposes only.
--
It does not constitute financial advice, and trading always involves
--
a risk of substantial losses, regardless of the margin levels
--
used. Before engaging in any trading activities, it is crucial to
--
conduct thorough research, consider your financial situation,
--
and, if necessary, consult with a qualified financial advisor. Past
--
performance is not indicative of future results, and market
--
conditions can change rapidly. Trading decisions should be made
--
based on careful analysis and consideration of individual
--
circumstances. The user is solely responsible for any decisions made
--
and should be aware of the inherent risks associated with trading in
--
financial markets.

RSI divergence in $MSFTRSI bearish divergence detected on the monthly chart for $MSFT. The last time the share price dropped about 30%. You can see the same pattern in $AAPL.

Tight Price Action in MicrosoftMicrosoft has paused this month as the Nasdaq-100 climbs to new highs. However, some chart watchers could look for the software giant to come off the sidelines.
The first pattern on today’s chart is the December 1 close of $374.51, which became resistance. A daily close above this level may confirm a potential breakout.
Second is the series of higher lows since the middle of the month. Some traders could view that as an ascending triangle.
Third, Bollinger Band Width has compressed since MSFT made new highs in November. Will price expansion follow the volatility squeeze?
Finally, the 8-day exponential moving average (EMA) has remained above the 21-day EMA. That may suggest the short-term trend is still bullish. The 50-day simple moving average (SMA) has also crossed back above the 100-day SMA, which may confirm a more bullish trend over the longer term.
TradeStation has, for decades, advanced the trading industry, providing access to stocks, options, futures and cryptocurrencies. See our Overview for more.
Important Information
Past performance, whether actual or indicated by historical tests of strategies, is no guarantee of future performance or success. There is a possibility that you may sustain a loss equal to or greater than your entire investment regardless of which asset class you trade (equities, options, futures or cryptocurrencies); therefore, you should not invest or risk money that you cannot afford to lose. Online trading is not suitable for all investors. View the document titled Characteristics and Risks of Standardized Options at www.TradeStation.com . Before trading any asset class, customers must read the relevant risk disclosure statements on www.TradeStation.com . System access and trade placement and execution may be delayed or fail due to market volatility and volume, quote delays, system and software errors, Internet traffic, outages and other factors.
Securities and futures trading is offered to self-directed customers by TradeStation Securities, Inc., a broker-dealer registered with the Securities and Exchange Commission (“SEC”) and a futures commission merchant licensed with the Commodity Futures Trading Commission (“CFTC”). TradeStation Securities is a member of the Financial Industry Regulatory Authority, the National Futures Association (“NFA”), and a number of exchanges. TradeStation Crypto, Inc. offers to self-directed investors and traders cryptocurrency brokerage services under federal and state money services business/money-transmitter and similar registrations and licenses.
TradeStation Securities, Inc., TradeStation Crypto, Inc., and TradeStation Technologies, Inc. are each wholly owned subsidiaries of TradeStation Group, Inc., all operating, and providing products and services, under the TradeStation brand and trademark. TradeStation Crypto, Inc. offers to self-directed investors and traders cryptocurrency brokerage services. It is neither licensed with the SEC or the CFTC nor is it a member of NFA. When applying for, or purchasing, accounts, subscriptions, products and services, it is important that you know which company you will be dealing with. Visit www.TradeStation.com for further important information explaining what this means.

Selling Puts on MSFT with 1 month expirationI’m selling this options contract, with expiration and strike at the crosshairs.
Selling the Put means I want price to say above the strike until the expiration.
The D+ indicator is showing a red cloud, but it is weakening. The red cloud means downward pressure. And we can see that price had leveled out by the time the cloud began.
The red outline on the cloud shows heightened downward pressure. And that has also cleared.
With some downward pressure recently cleared, confidence in the Put sale increases.
NASDAQ:MSFT

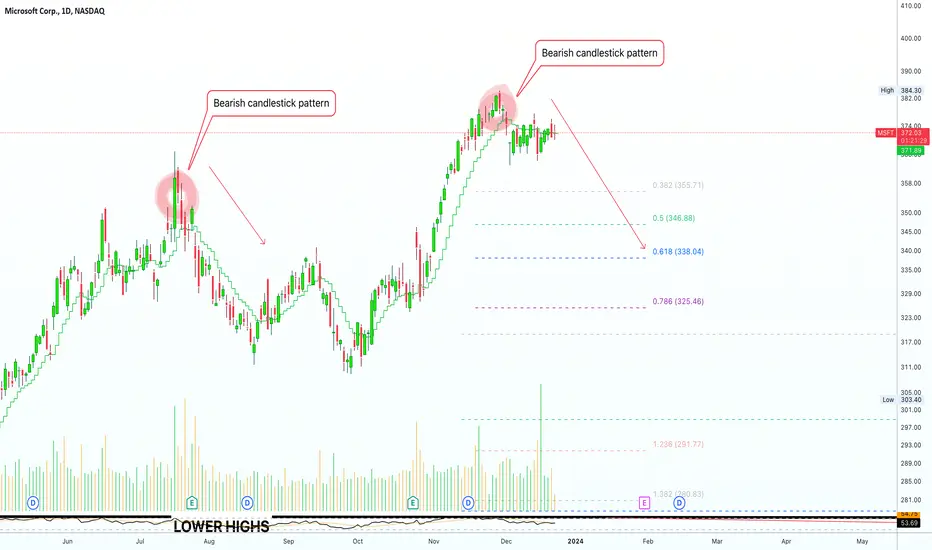
📊 Microsoft Corp. New All-Time High (Bearish Signals)Let's start by looking at the weekly timeframe chart...
➖ An ATH was hit in July but the candle in which the ATH hit closed red and this preceded a correction.
➖ A new All-Time High hit last month with the candle again closing red, which opens the door for a new but stronger correction. These are early signals.
➖ The weekly RSI is showing a 2 year strong bearish divergence, it peaked November 2021 while the stock peaked November 2023.
➖ On the daily timeframe MSFT still trades above EMA10 but a recent bearish candlestick pattern showed up after the new ATH.
➖ We have really high buy volume 15-Dec but prices failed to move higher, a sign of weakness.
There is potential for a drop.
Additional confirmation is needed, is still very early but the bullish trend is losing momentum.
Namaste.
MSFTMicrosoft has set a new high. All through 2023, it has been raising money for itself. Successfully passed the crisis in OpenAI. All is well, but it's correction time.
tp1 368
tp2 348
