[S-018] MicrosoftTrading idea number S-018 | Microsoft stock could fall to $293 area.
The configuration is negative. The RSI is below the neutrality area at 50. MACD is below its signal line and negative. In addition, the stock is below its 20-day and 50-day moving averages. Finally, Microsoft trades below its lower daily Bollinger band.
📉 Short Entry at 310.88
💰 Take Profit at 293
💸 Stop Loss at 320
MSF trade ideas

"Microsoft's Quantum Leap: How Quantum tech can shape the futureMicrosoft's Quantum Leap: A Bullish Trend on NASDAQ
Microsoft (MSFT) is experiencing a bullish surge on NASDAQ. The Relative Strength Index (RSI) for MSFT indicates strong buying momentum, with levels well above the 70 threshold, signaling an overbought condition and potential for further gains. The Simple Moving Averages (SMA) show a golden cross, with the 50-day SMA crossing above the 200-day SMA, a classic bullish signal. This suggests strong upward momentum and investor confidence in Microsoft's strategic investments in cloud computing, AI, and quantum computing. As technology continues to evolve, MSFT appears well-positioned for sustained growth.

Been playing with 30DTE $MSFT Options, and I'm cautiously LONGBackground
- Been playing with 30DTE MSFT Options for the last 3 months, and I'm cautiously LONG since buyers always seem to buy at Bollinger Bands ranges rather than let it drop below those ranges, regardless of Earnings, News Cycles, or Open Trading Windows.
Growth Fundamentals
1. MSFT is a major holder in OpenAI pre-public stock
2. OpenAI: Will continue to benefit from first mover advantage at scale + API adoption (now part of many workflows)
3. Azure: Continues to benefit from cloud infrastructure adoption
4. Office: Continues to benefit from increased knowledge worker population
🧠 IMHO this combination is what will help us get to annotation #3. (Consumer hardware and gaming business is probably not going to make a significant difference any time soon.)
Technical Analysis
1. Weekly chart shows lots of support levels between now and 312.
2. Expecting buyers to come support 325 and bring us back to the "triple tap" level.
3. I believe we could also range here for awhile due to macro-uncertainty.
Investment Buy and Hold Potential:
1. Certainly a good pickup for the long haul, as MSFT sells to global markets, and has moats in across several different business solutions.
2. AI and Cloud Infra will continue to bring in revenue.
3. Most people are likely comfortable holding MSFT stock if they get assigned
4. Looking for AMEX:SPY to hit $470 before taking profits

Microsoft's Remarkable 33% YTD Growth: A Deep Dive into Its ProsMicrosoft's Remarkable 33% YTD Growth: A Deep Dive into Its Prospects
Microsoft Corporation has been on a remarkable journey in 2023, with its shares showcasing an impressive year-to-date growth of 33%. This ascent has caught the attention of investors for several compelling reasons. As a tech giant, Microsoft has not only solidified its presence in the rapidly evolving realm of artificial intelligence (AI) but has also demonstrated remarkable resilience to economic challenges, setting it apart from many industry peers. In addition to these strengths, Microsoft's standing as a dominant player in the software sector, with a portfolio that includes iconic brands such as Windows, Office, Azure, and LinkedIn, further enhances its appeal.
Despite its strong performance earlier in the year, the tech market has experienced a modest downturn over the past three months. This market correction has led to a 7% dip in Microsoft's stock value since July, aligning it with declines witnessed by competitors like Apple and Amazon. This adjustment in stock price presents an opportune moment for investors to delve deeper into the growth potential of a high-performing company like Microsoft and consider it as a prospective investment.
Here are three crucial insights that savvy investors should be aware of regarding Microsoft:
Enormous Earnings Potential in AI:
Microsoft's strategic investments in the AI domain have been nothing short of visionary. In 2019, the company committed $1 billion to OpenAI, the developer behind ChatGPT, and later increased its stake to 49%. This partnership has given Microsoft access to cutting-edge AI technology, allowing the integration of AI-powered features throughout its software portfolio.
In July, Microsoft indicated that investors should expect "gradual" revenue growth from its AI offerings in fiscal 2024. However, considering the sheer dominance of Microsoft's brand portfolio and the advanced capabilities of OpenAI, this projection may underestimate the actual impact and potential of AI-driven revenue growth.
Wedbush analyst Dan Ives has observed a significant surge in activity on Microsoft's cloud service, Azure, following the introduction of AI tools. This uptick could potentially lead to a remarkable 25% revenue growth for Azure in the first quarter of 2024. Given that Azure already experienced substantial 19% year-over-year growth in fiscal 2023, this projection seems reasonable. Furthermore, Microsoft 365 is set to introduce an AI assistant called CoPilot, available for $30 per month as an add-on to existing subscriptions. Microsoft's strong foothold in cloud computing and productivity software positions it favorably to diversify its AI offerings and capitalize on this thriving industry.
Attractive Valuation Relative to Other AI Stocks:
While chipmakers like Nvidia and Advanced Micro Devices (AMD) have garnered significant attention in the context of AI growth, their stocks have witnessed substantial increases of approximately 198% and 59%, respectively, since the start of the year. These companies play pivotal roles in AI hardware development, but their recent surges have led to elevated stock prices. In comparison, Microsoft appears to offer better long-term value.
A key metric for evaluating stock value is the forward price-to-earnings (P/E) ratio. A P/E ratio below 20 is typically considered undervalued, and Microsoft is the closest to this figure among prominent AI players. Moreover, Microsoft's substantial investment in OpenAI and its dominance in various market segments suggest similar or even greater earnings potential within the lucrative AI industry. Microsoft's steady stock growth and consistent earnings growth make it an attractive choice, especially as expected earnings growth may already be reflected in the valuations of its peers.
Reliable Dividend Growth:
Microsoft stands out for its consistent dividend growth, boasting an impressive streak of 19 consecutive years of increases. Over the years, the company's dividend has grown from a modest $0.08 in 2003 to a substantial $0.68 in 2022. Recently, Microsoft announced another dividend hike, exceeding 10% to reach $0.75. While Microsoft's dividend yield of 0.87% may appear modest compared to leading dividend stocks like Verizon, it surpasses the yields of its tech competitors. Amazon and Alphabet offer no dividends, while Apple's dividend yield stands at 0.56%.
Microsoft's sustained commitment to dividend growth underscores management's unwavering confidence in its financial outlook. This, combined with its consistent stock appreciation, positions Microsoft as an appealing choice for long-term investors seeking both stability and growth potential.
In conclusion, Microsoft's journey in 2023 has been marked by significant achievements and a noteworthy stock performance. Its strategic investments in AI, attractive valuation relative to AI peers, and reliable dividend growth make it a compelling choice for investors looking to capitalize on the company's strong position in the tech industry and its promising prospects in the field of artificial intelligence. As the tech landscape continues to evolve, Microsoft remains a key player to watch for both its resilience and innovation.
Our preference
The upside prevails as long as 285.85 is support.

Sygnia SYFANG Custom Index (USD)Sygnia have launched their Sygnia Itrix FANG.AI Actively managed ETF (JSE:SYFANG). This chart reflects a custom index of the stocks held (as per the Sygnia marketing document at launch). As the SYFANG ETF chart has no history this custom index could help in providing a technical view. Please note that these are US stocks and therefore do not take into account the USDZAR exchange rate.
Despite the recent pullback, this weekly chart shows clear out performance vs the S&P500 and has currently entered a weekly squeeze.

MSFT: Sell ideaOn MSFT we will have a hight probability to have a downtrend because as you see on the chart we have a squeeze. For example, If we are in an uptrend and if you see a candle with a small body and long wick it's mean that the market will go down.Thanks.

MICROSOFT Buy with a plan BMicrosoft / MSFT found support at 309.50, more or less where the August 18th low was priced, and put the Channel Down pattern on hold.
It is quite possible for a Rectangle to emerge as a hold of Support A (309.50) would potentially mean a test of Resistance A (341.10).
The 4hour MACD forming a Bullish Cross, certainly leads towards that direction.
As long as Support A holds, buy and target 340. If it fails and breaks, sell and buy on the 1day MA200 (target 320.00).
Previous chart:
Follow us, like the idea and leave a comment below!!

MSFT short positionMSFT has been decreasing for some time.
We are waiting for price to retest the trend line where we anticipating to take a short position.
Our target is 309.66 $.
Stop loss and target is indicated on the chart.
Good luck.

MSFT: critical support.If this support is broken then 280 is in cards very quick.
Let's see if it can hold. NASDAQ:MSFT

Taking two steps forward and one step back for MicroSoftWhile I personally believe that Microsoft's business model is ideal and that it will be worth more than double its current price over the long term (10+ years), it's time to take a breather. It's currently struggling to break above its ATH. I expect it to fall to $254, and it would be a good strategy to buy on the dip without having to be aggressively short.

MSFT Takeoff🚀
Here we have Microsoft Corporation (MSFT). I have a very bullish sentiment on this stock because of the charts and analytics as well. Technology as a sector has been doing good this past week according to performance. The weekly and daily chart are looking like we have a bearish trend reversal. On the weekly timeframe we bounced off of the bottom Bollinger band but we are still early in the week. If we can close this week with a strong green candle, I would definitely look for some long calls. And on the Daily timeframe we were over-extended from the bottom Bollinger line which could signal a reversal as well as we were oversold on the RSI. As always, thank you for reading and I hope you learned something educational in this post. Feel free to like, and comment on this post.

Short MicrosoftWeekly bearish candle
Weekly bear flag
Daily top at the top of the Ichimoku cloud
TP: Below bear flag
Careful at 20 day SMA + High volume on the daily

📈📊 #ChartPattern Alert! 📈📊 📈 Falling Wedge 📈📈 What is a Falling Wedge? The Falling Wedge is a bullish chart pattern characterized by two converging trendlines, with the lower trendline sloping upward more than the upper trendline. It typically signals a potential bullish reversal, with the price likely to break upward after the wedge pattern.
📈 How to Identify:
Draw a trendline connecting at least two higher highs (upper trendline).
Draw another trendline connecting at least two higher lows (lower trendline).
📈 What it Signals: The Falling Wedge suggests a potential bullish reversal, with buyers gaining strength as the price reaches higher lows within the wedge. It often forms during downtrends and can precede a significant price move to the upside.
📈 Trade Strategy:
Consider buying when the price breaks above the upper trendline of the Falling Wedge.
Set profit targets based on the pattern's height added to the breakout point.
Implement a stop-loss to manage risk in case of a false breakout.
Remember to validate your analysis with other technical indicators and conduct thorough research before making any trading decisions. Happy charting and trading! 📈💹

MSFT Targets Bottom Of ChannelMSFT has been rejected from the top of the ascending channel and is looking to continue it's sell off to the golden pocket shown in the chart or the bottom of the channel.
not shown on this chart but if you zoom into the 1hr TF or 4hr TF, you'll notice that it did perform a Swing failure pattern and it could move up from these levels but in the upcoming weeks i expect price to continue falling and have a nice reaction at the golden pocket or bottom of the channel.
Calculate Your Risk/Reward so you don't lose more than 1% of your account per trade.
Every day the charts provide new information. You have to adjust or get REKT.
Love it or hate it, hit that thumbs up and share your thoughts below!
This is not financial advice. This is for educational purposes only.

MICROSOFT Buy on the MA200 (1d) or on a Bullish Divergence.Microsoft is pulling down on a Channel Down.
Having failed to hold the 1.5 Fibonacci Channel level, it technically seeks the lower 1.0 level, which is where the MA200 (1d) currently is.
Trading Plan:
1. Buy on the MA200 (1d).
2. If it closes a (1d) candle under the MA200 (1d), then buy only after the first sign of an RSI bullish divergence.
Targets:
1. & 2. 340.00 and after a 1.5 Fib pull back, 367.00
Tips:
1. On a similar downtrend before the global market bottom was priced on November 4th 2022, the RSI (1d) was already on a Bullish Divergence. This is the reason for the second buy entry.
Please like, follow and comment!!

Microsoft showing downside with Inv Cup and Handle target $262.6Inv Cup and Handle formed on Microsoft.
The price broke below and this is where aggressive traders take advantage.
21>7
RSI<50
Target 262.66
Despite the positive sentiment with interest rates put on hold. There are signs that they will increase again this year. So we will need to prepare for the potential crash.

MICROSOFT (NASDAQ) ANALYSISMicrosoft and Apple are leading the Nasdaq blue chip stocks in the US. Last week Microsoft stocks were trading at all time highs. The market is now at a previous resistance where it has reversed before. The weekly candle closed as a high volume shooting star, another strong bearish signal. If the DXY starts to rise, the stocks will fall. The chances that the market will reverse at a point where it has reversed before are very high.
MSFT Price & Market Analysis for September and October 2023I have conducted an analysis of Microsoft's (MSFT) market structure and price action, preceded by a fundamental analysis that yielded the following findings:
- Microsoft reached its all-time high (ATH) on July 18, 2023.
- Microsoft is a dominant force in delivering cloud-based solutions to organizations of varying sizes.
- Microsoft is undergoing its third major technological shift. The first was the transition from PCs to the Internet, followed by the move from the Internet to Cloud. The latest shift is towards human-machine interactions powered by machine learning models, AI (LLM), and data analytics.
- Microsoft is not only offering AI solutions but also AI-based infrastructure.
- The company leads in innovating "ready-to-use" AI solution frameworks, enabling organizations to fully leverage AI capabilities, even when integrating third-party solutions.
- Lastly, Microsoft is deeply committed to user privacy and adheres to local, regional, and continental regulations.
Market structure (time frame 1d - pivots set to quarterly time frame)
The snapshot above reveals two potential macro indicators:
MSFT has initiated a downtrend that could reach the yellow box price range of $288 to $299 before potentially rebounding.
The uptrend was breached, reaching into the parallel channel depicted by the blue rectangle.
As a prospective scenario, my hand-drawn retracement suggests the yellow box price range could serve as a consolidation or liquidity entry point for smart money:
The lower higher LH occurred the the 14th of September 2023 matches with the change of the trend exhibited by the AMA indicator:
Lastly, a potential very bearish scenarios could occur as it follows:
To summarize, MSFT could encounter three possible scenarios:
- A bullish pullback around the $305 to $314 price range.
- A bullish pullback in the $288 to $300 price range.
- A continuation of the downtrend below the $272 and below price mark.
Disclaimers:
- I am not a financial advisor nor this analysis should be used by 3rd party and TradingView users as a strategy or anything else
- This is my attempt to learn technical analysis by looking at different aspect of the markets. Therefore, I'm happy to receive either bad or good feedback with the sole purpose to learn .

MSFT WeeklyEven though MSFT is oversold on the Daily RSI(9), and is at a pivot, it has made a lower low, so I don't believe the selling is yet over.
I believe one could find a better entry at the green dashed line (Gann confluence area and support) or better yet the bottom dashed line near Black D (volume profile apex and support and 50% retrace off recent high).
Going to approach the 52 week EMA, I believe.

TSLA NVDA AAPL MSFT AMZN GOOGL META Price Forecast00:00 QQQ Stock Price Forecast
06:49 Sp500 ETF Price Forecast
09:50 Tesla Stock TSLA Forecast Technical Analysis
11:28 Nvidia Stock NVDA Forecast Technical Analysis
13:06 Apple Stock AAPL Forecast Technical Analysis
16:01 Amazon Stock AMZN Forecast Technical Analysis
17:38 Google Stock GOOGL Forecast Technical Analysis
19:24 Microsoft Stock MSFT Forecast Technical Analysis
22:12 Meta Forecast Technical Analysis

MSFT: AB=CD Pattern going shortAB=CD pattern formed. Entry point at B point. Tracking for a while and stock is moving accordingly based on the AB=CD pattern. AC are within the range of 0.382 to 0.886 and BD points are within range of 1.13 to 3.14.

MSFT, PULLBACK Momentum, Positions Trigger, BEARISH-Indication!Hello There!
Welcome to my new analysis about MSFT Stock Price Action Analysis on Several Timeframe Perspectives. In the recent times MSFT has emerged with a crucial pullback to the downside almost printing over 10% of a bearish pullback. In such occassions a big question is if the bearish momentum will accelerate into the bearish direction and if higher inflation rates could heavily increase such a bearish momentum. In any cases the bearish momentum wave could trigger further long-liquidations down the path.
In my chart you can watch that MSFT is about to complete a huge ascending-wedge-formation and such a ascending-wedge-formation is likely to lead to a massive pullback and bearish reversal once it has been completed with a breakout below the lower boundary. Currently this pullback could be triggered when MSFT moves below the remaining supports between the 315 to 320 area as many many long-positions are waiting below this area this will lead to such a bearish momentum that a reversal into the other direction will be unvalid.
There is the possibility that MSFT firstly stays within the area and bounces in the remaining supports to form something like an initial reversal, nonetheless MSFT has still huge resistance levels in the structure especially when moving into the upper boundary of the ascending-wedge-formation this upper boundary is a paramount resistance-zone from where the pullback to the downside is inevitable. This means that also with the initial stabilization the completion of the whole ascending-wedge-formation will shape a reality for MSFT and complete the pullback and liquidations down the path.
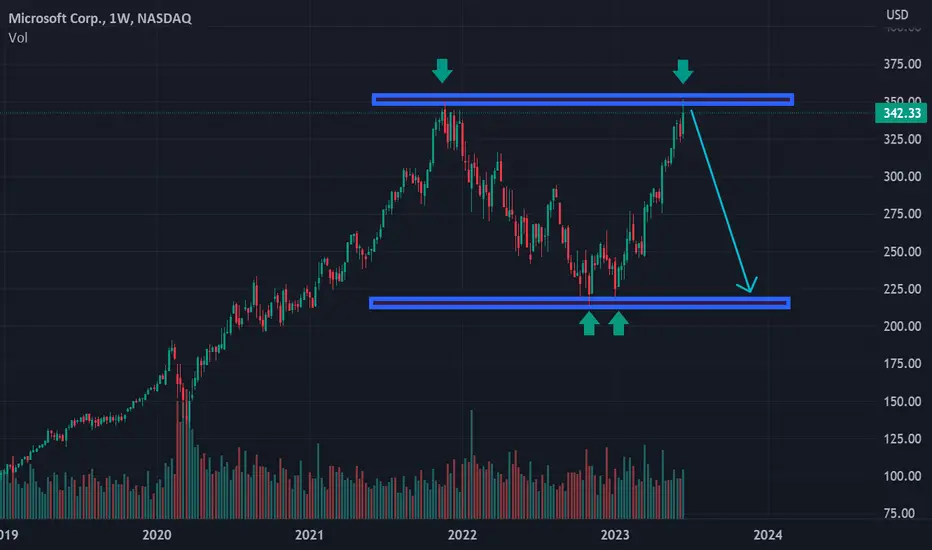
If the bearish momentum accelerates so heavily once the wedge has been completed it will be highly decisive on how MSFT moves into the final target-zone of 220 because if the bearish momentum should be that high that a reversal in this area will not be possible this will complete the huge double-top-formation and will accelerate even more liquidations to point to a scenario of MSFT moving below the 150 area.
For now the bearish scenario for MSFT should not be underestimated and should be watched and because of this we will keep having the symbol in our watchlist and adjust to changing factors.
In this manner, thank you everybody for watching the analysis, support from your side is greatly appreciated.
VP

