Just hit major resistance w/ bearish indicators.Target level is $415 to $400.
Political news will most likely influence this move. Earnings were great.
Huge volume profile gap that I think will be closed.
Watch out for another bull trap soon, but I think we just peaked.
MSF trade ideas

NASDAQ in potential ending diagonal formationNASDAQ has recently completed a Wave 4 correction within a classic ending diagonal structure, finding strong support between the critical demand zone of 350–377. This region has held firmly, affirming bullish structural integrity and reinforcing the likelihood of a new impulsive phase.
Price action is now coiling just below 441.70, a key resistance level. A decisive breakout above this threshold would confirm the initiation of Wave 5, targeting the projected upper boundary of the macro channel around 563 a confluence zone of both Fibonacci extensions and historical resistance.
The structure remains bullish as long as the 350–377 zone is respected. A clean move above 441.70, ideally backed by increasing volume and momentum indicators, would validate the bullish continuation setup and unlock the next phase of upside potential.
This setup offers a compelling risk-to-reward narrative, aligning with long-term trend dynamics and classical Wave theory.

$MSFT Tradespoon – Long Entry $393.41Tradespoon model generated long signal for Microsoft ( NASDAQ:MSFT ) . Predicted range: $393.41–$425.40. Trend: +4.28%. NASDAQ:MSFT

Microsoft’s Big Moves This Quarter | From Activision to AI AgentMicrosoft’s Revenue Surge: The Power of AI, Gaming, and Strategic Investments
Microsoft has released its Q1 FY25 earnings for the quarter ending in September
The stock saw a 6% drop, indicating the results fell short of investors' high hopes. Trading at over 30 times projected earnings for next year, expectations for Microsoft were significant.
CEO Satya Nadella stated
“Our AI business is set to exceed an annual revenue run rate of $10 billion next quarter, making it the fastest business in our history to reach this milestone.”
This means that AI will soon account for about 4% of Microsoft's total revenue in under three years a remarkable feat for a global giant.
If you need a quick summary, here are three main points:
1. ☁️ Azure’s growth is slowing. As Microsoft’s key player in the AI competition, Azure grew 34%, down slightly from 35% in the prior quarter (after adjustments). This comes as Google Cloud raised the bar, with its growth accelerating from 29% to 35% during the same period.
2. 🤖 AI growth is limited by hardware supply, as capacity struggles to meet demand. Data center expansion is a long-term process, and Microsoft is investing heavily in infrastructure, aiming for a growth boost by 2025.
3. 👨👩👧👦 Consumer-focused products like Gaming and Devices are underperforming. Although not essential to Microsoft's core business, their poor performance has impacted overall results.
Here’s a breakdown of the insights from the quarter.
Overview of today’s insights:
- New segmentation.
- Microsoft’s Q1 FY25 overview.
- Key earnings call highlights.
- Future areas to monitor.
1. New Segmentation
Revised Business Segments
In August, Microsoft announced a reorganization of its business segments, effective this quarter. The purpose? To better align financial reporting with the current business structure and strategic management.
Summary of the main changes
- Microsoft 365 Commercial revenue consolidation: All M365 commercial revenue, including mobility and security services, now falls under the Productivity and Business Processes segment.
-Copilot Pro revenue shift: Revenue from the Copilot Pro tool was moved from Productivity and Business Processes to the More Personal Computing segment under Search and news advertising.
-Nuance Enterprise reallocation: Revenue from Nuance, previously part of Intelligent Cloud, is now included in Productivity and Business Processes.
-Windows and Devices reporting combination: Microsoft now reports Windows and Devices revenue together.
Impact of These Changes:
Core Segments Overview:
In summary:
- The Productivity and Business Processes segment has grown significantly.
- The Intelligent Cloud segment has decreased due to the reallocation of Nuance and other revenue.
Products and Services Overview:
- M365 Commercial now includes Nuance, shifted from the Server products category, along with integrated mobility and security services.
- Windows & Devices have been merged into a single, slower-growth category.
Additional Insights:
- Azure, Microsoft's cloud platform, is reported within 'Server products and cloud services.' Although its growth rate is shared by management, exact revenue figures remain undisclosed.
Azure’s past growth figures have been adjusted for consistency, with the last quarter’s constant currency growth recast from 30% to 35%, setting a higher benchmark. Tracking these metrics is challenging due to limited revenue disclosure, but this recast indicates Azure's raised growth expectations.
2. Microsoft’s Q1 FY25 Performance
Financial Summary:
-Revenue: Up 16% year-over-year, reaching $65.6 billion (exceeding estimates by $1 billion). Post-Activision Blizzard acquisition in October 2023, the growth was 13% excluding the merger.
New Product and Services Segmentation Results
- Server products & cloud services: $22.2 billion (+23% Y/Y).
- M365 Commercial: $20.4 billion (+13% Y/Y).
- Gaming: $5.6 billion (+43% Y/Y), influenced by Activision.
- Windows & Devices: $4.3 billion (flat Y/Y).
- LinkedIn: $4.3 billion (+10% Y/Y).
- Search & news advertising: $3.2 billion (+7% Y/Y).
- Enterprise & partner services: $1.9 billion (flat Y/Y).
- Dynamics: $1.8 billion (+14% Y/Y).
- M365 Consumer products: $1.7 billion (+5% Y/Y).
Core Business Segments Breakdown:
- Productivity and Business Processes: Increased 12% Y/Y to $28.3 billion, supported by M365 Commercial, especially Copilot adoption.
- Intelligent Cloud: Grew 20% Y/Y to $24.1 billion, with Azure AI driving growth.
- More Personal Computing: Grew 17% Y/Y to $13.2 billion, including a 15-point boost from Activision. Devices fell, but search and ad performance improved under new segmentation.
Key Observations:
- Microsoft Cloud revenue climbed 22% Y/Y to $39 billion, making up 59% of total revenue (+3 percentage points Y/Y).
- Azure continues to drive cloud services and server products' growth.
- Xbox growth has surged due to the Activision acquisition since Q2 FY24, expected to stabilize by Q2 FY25.
- Windows OEM and devices combined, showing a 2% decline in Q1 FY25.
- Office rebranded to Microsoft 365; updated naming will be used starting next quarter.
- Margins: Gross margin at 69% (down 2pp Y/Y, 1pp Q/Q); operating margin at 47% (down 1pp Y/Y, up 4pp Q/Q).
- EPS: Increased 10% to $3.30, beating by $0.19.
Cash Flow and Balance Sheet:
- Operating cash flow: $34 billion (52% margin, down 2pp Y/Y).
- Cash**: $78 billion; Long-term debt**: $43 billion.
Q2 FY25 Outlook:
- Productivity and Business Processes: Anticipated 10%-11% Y/Y growth, steady due to M365, Copilot inclusion, and expected LinkedIn growth of ~10%. Dynamics set to grow mid-to-high teens.
- Intelligent Cloud: Projected 18%-20% Y/Y growth, slightly slowing, with Azure growth expected between 28%-29%.
- More Personal Computing: Forecasted ~$14 billion revenue, declines in Windows, Devices, and Gaming anticipated, with some offset from Copilot Pro.
Main Takeaways:
- Azure's growth slowed to 34% Y/Y in constant currency, with AI services contributing 12pp, up from 11pp last quarter. This marks a dip from the recast 35% prior and included an accounting boost.
- Capacity limitations in AI persist; more infrastructure investments are planned, with reacceleration expected in H2 FY25.
- Commercial performance obligations grew 21% to $259 billion, up from 20% in Q4.
- Margins were pressured by AI infrastructure investments; Activision reduced the operating margin by 2 points.
- Capital expenditures increased by 50% to $15 billion, half dedicated to infrastructure, with further Capex growth expected.
- Shareholder returns included $9.0 billion through buybacks and dividends, matching Q4 repurchases.
Earnings Call Highlights:
Azure AI saw a doubling of usage over six months, positioning it as a foundation for services like Cosmos DB and SQL DB. Microsoft Fabric adoption grew 14% sequentially, signaling rapid uptake.
AI Expansion: GitHub Copilot enterprise use surged 55% Q/Q, with AI-powered capabilities used by nearly 600,000 organizations, a 4x increase Y/Y.
M365 Copilot has achieved a 70% adoption rate among Fortune 500 companies and continues to grow rapidly.
LinkedIn saw accelerated growth in markets like India and Brazil and a 6x quarterly increase in video views, aligning with broader social media trends.
Search and Gaming: Bing’s revenue growth surpassed the market, while Game Pass hit a new revenue record, propelled by Black Ops 6
Capital Expenditures: CFO Amy Hood highlighted that half of cloud and AI investments are for long-term infrastructure, positioning the company for sustained growth.
4. Future Outlook
Energy Needs: Microsoft, facing higher power demands, plans to revive a reactor at Three Mile Island with Constellation Energy by 2028 to power its AI data centers sustainably.
Autonomous AI Agents: Coming in November, these agents will perform tasks with minimal human input, enhancing efficiency. Copilot Studio will allow businesses to customize these agents, with 10 pre-built options to start.
Industry Impact: Salesforce has launched Agentforce, signaling increased competition. CEO Mark Benioff recently compared Microsoft’s Copilot to the nostalgic Clippy, stoking rivalry.
For further analysis stay tuned

MSFT Looking at a possible bottoming outNASDAQ:MSFT is looking at a potential bottoming out after the Microsoft has formed a bullish morning star pattern above 123.6% Fibonacci extension level of 383.73-455.48 range. Furthermore, the strong bullish bar was seen closing above the gap and the previous resistance turned support low of 377.16.
Ichimoku has yet to show a clear bullish trend but the slight closure above the 9-period conversion line may see a strong signal.
MACD is still bearish over the longer-term period
Mid-term Stochastic showing oversold crossover signal
23-period ROC is showing a bullish divergence
Volume remain healthy.
Wyckoff analysis - Larger range from 8 Jul 2024 (Buying climax) is looking at a distribution. Hence, current rebound is likely to be in a sign of weakness phase.
Recommend to buy swing in 1-week to a month.

Microsoft after earningsMicrosoft ( NASDAQ:MSFT ) reached the $425 target after strong post-earnings momentum.
Price is now testing a key weekly resistance between $400 and $450.
Immediate support is at $400.
As long as it holds above this level, the trend remains bullish.
Watch the $425–$400 gap for potential retracement.
#Microsoft #MSFT #Trading #StockMarket #VolumeProfile #TechnicalAnalysis #Earnings #Investing #WallStreet
#globaltrade #investment #investing #stockmarket #wealth #realestate #markets #economy #finance #money #forex #trading #price #business #currency #blockchain #crypto #cryptocurrency #airdrop #btc #ethereum #ico #altcoin #cryptonews #Bitcoin #ipo

$MSFT Potential Bull wave targeting 428 SL at 370Bullish daily candlesticks , RSI breakout and back tested, but there are strong resistance at 393-396 , if breakout then it will target the upper gap and fib golden at 428 but there are real overhead resistances. Above 396 , minor targets at 408 and 416 .The latest news of tariffs exemptions may push it higher but needs carful risk management. NASDAQ:MSFT Earning report by 30th April . i would like to to take 395 Call expiry before earning but with protection Put or some type of hedge. Good luck . please boost and share. Gracias

MSFT is about to rise appreciably!Dear traders, after painful weeks in stock markets, now we could see the shadow of hope. Based on the chart, MSFT has broken an important trend line, in which, favors for more rise during next weeks. Besides, the monthly performance is about to become green, and thus, this confirms our bullish view. Let's see!

MSFT HAGIA SOPHIA! Self-explanatory, I think. Never trust motivational moves! They fade faster than a New Year's resolution! Yet we all fall for it all the time. The difference is we don't bet our hard-earned money every time we get motivated to learn our lesson after about the fifth or sixth or seventh... time!
For some reason, in trading, it's different; most don't even learn after the hundredth time! I am guessing it has something to do with the herd mentality. Others are doing it so its okay for me to lose my ass with them for the one hundredth and one time chasing!!
If I haven't convinced you yet, NOT to do it. Try thinking of it like this. There are many better trades out there to buy!
Hagia Sophia is not there to make you rich! It is there to humble you!
Click boost like and subscribe! l3ts get to 5,000 followers! ))

Microsoft (MSFT) Share Price Jumps Nearly 9% – What’s Next?Microsoft (MSFT) Share Price Jumps Nearly 9% – What’s Next?
As the chart shows, Microsoft (MSFT) shares surged sharply, forming a large bullish gap: while trading closed around $391 on 30 April, yesterday’s candlestick closed just below the $425 mark.
What Drove the Rally in Microsoft Shares?
Microsoft released its financial results for the first quarter of 2025, exceeding Wall Street expectations on both revenue (actual = $70.1 billion, 2.4% above forecasts) and earnings per share (actual = $3.46, 7.4% above forecasts).
Particular attention was drawn to the strong performance of Azure – revenue from Azure and other cloud services soared by 33% year-on-year. A significant part of this growth was fuelled by robust demand for artificial intelligence services, which helps ease concerns about the return on large-scale infrastructure investments related to AI.
In addition, Microsoft issued an upbeat outlook for the next quarter, which ultimately triggered the sharp rise in its share price.
Technical Analysis of MSFT Chart
Yesterday’s candlestick closed near its low (highlighted by the arrow), indicating that bears were active during the trading session. From a technical analysis perspective, this can be explained by the proximity of the price to two key resistance lines:
1 → The upper boundary of a descending channel drawn from significant price action patterns (marked in red). The relevance of this channel is confirmed by the price’s behaviour near its median line (dashed).
2 → A former trendline that served as support throughout 2024.
Therefore, a short-term correction cannot be ruled out following the sharp rally in MSFT shares, potentially tempering some of the enthusiasm generated by Microsoft’s strong quarterly report.
This article represents the opinion of the Companies operating under the FXOpen brand only. It is not to be construed as an offer, solicitation, or recommendation with respect to products and services provided by the Companies operating under the FXOpen brand, nor is it to be considered financial advice.

MSFT is a no Brainer CALLMarket Context NASDAQ:MSFT
Current Price: $428.50
1-Month Move: +6.2% (from $403.20)
1-Year Move: +28.4% (from $333.80)
Year High/Low: $468.35/$309.45
Technicals:
RSI: ~63.2 (neutral, approaching overbought)
Above 20-day and 50-day MAs, slightly below 200-day MA (short-term strength in a longer uptrend)
Options Data:
IV Rank: 68th percentile (elevated premiums)
Put/Call Ratio: 0.85 (slightly bullish skew)
Max Pain: $415.00
High OI: $420 calls, $400 puts
Historical & Model Insights
Historical Move: MSFT averages ~5.8% post-earnings, with 7/12 quarters showing upside.
IV Crush: Expect 25–35% IV drop post-earnings, so plan exits carefully.
Model Consensus (Grok, Claude, Llama, Gemini, DeepSeek): Moderately Bullish
Why? Strong AI/cloud growth narrative, consistent guidance beats, and call-heavy OI at $420–425. Max Pain at $415 suggests limited downside pull.
Outlier: Gemini flags macro risks and Max Pain gravity, leaning neutral but not bearish.
Trade Setup
Strategy: Single-leg, naked call (bullish, defined risk)
Instrument: MSFT
Direction: Call
Strike: $435.00 (premium $0.75, fits $0.50–$1.00 target band)
Expiry: 2025-05-02 (first weekly post-earnings)
Entry Price: $0.75
Entry Timing: Pre-earnings close (2025-04-30)
Profit Target: $1.50 (~100% gain)
Stop Loss: $0.38 (~50% loss)
Confidence: 70%
Expected Move: ±$24.90 (~5.8%)
BEST AI Signals in the market

Bitcoin Vs Microsoft 🚨MartyBoots here , I have been trading for 17 years and sharing my thoughts on COINBASE:BTCUSD .
🚨
.
NASDAQ:MSFT vs COINBASE:BTCUSD
Do not miss out on COINBASE:BTCUSD as this is a great opportunity. You are still early
Watch video for more details

Microsoft - Positive earnings expectation , value to collect?Hi guys we would be looking forward to our next stock analysis for Microsoft!
Microsoft Corporation continues to demonstrate robust financial performance, underpinned by its strategic investments in artificial intelligence (AI) and cloud computing. The company's strong earnings and forward-looking initiatives position it favorably for sustained growth.
In Q4 FY2024, Microsoft reported revenue of $64.7 billion, marking a 15% increase year-over-year. Net income rose to $22.0 billion, with diluted earnings per share (EPS) of $2.95, surpassing analysts' expectations of $2.90 . For the full fiscal year, revenue reached $245.1 billion, reflecting a 16% increase, while net income grew by 22% to $88.1 billion.
Microsoft's Intelligent Cloud segment, which includes Azure, generated $28.5 billion in revenue for Q4 FY2024, a 19% increase year-over-year. Azure's revenue alone grew by 29%, driven by strong demand for cloud services and AI integration . The company's AI initiatives, such as the integration of Copilot across Microsoft 365 applications, have been pivotal in enhancing productivity and driving adoption.
📈 Positive Overall Outlook
Analysts maintain a bullish outlook on Microsoft's stock, with expectations of continued growth in earnings and revenue. For fiscal year 2025, analysts forecast an EPS of $13.04, up 10.5% from the previous year . The company's strategic focus on AI and cloud computing, coupled with its strong financial results, support this positive sentiment.
Microsoft's commitment to expanding its AI capabilities is evident in its planned $80 billion investment to enhance its global network of computing centers . This investment aims to support the growing demand for AI services and solidify Microsoft's position as a leader in the AI and cloud computing markets.
To summarize, Microsoft's strong financial performance, driven by its cloud and AI initiatives, positions the company for continued success in the evolving technology landscape.
📌 Trade Plan
📈 Entry: 390 -
✅ Target: 430 - Just below the ATH / around the strong resistance
❌ SL: 365 - Just around the current rejected support zone

Mircosoft LongWe are now net long on the regression break.
I am not taking this trades as it is only just a break and the market is volitile.

META & MSFT Daily Trade SetupsIn this update we review the recent price action in Meta & Microsoft ahead of their earnings release and identify the next high-probability trading opportunities and price targets. To review today's video analysis, click here!

MSFT Setup After EarningsEarnings season is heating up and Microsoft (MSFT) is once again in the spotlight. With its dominance in cloud and AI, the next move could be explosive.
Here’s how pro Im thinking my setting up:
🔹 $390 – A bold speculative entry for breakout hunters.
🔹 $365 – A defensive entry on post-earnings pullback to support.
🔹 $345 – The opportunity zone if a sharp drop offers value.
🎯 Profit Targets:
TP1: $410 – Psychological and technical resistance.
TP2: $426 – Momentum continuation level.
TP3: $445–$450 – Ambitious upside for long-term riders.
Whether you’re playing momentum or patiently buying dips, MSFT is offering clear levels. Stay sharp.
Disclaimer: This is not financial advice. All trading involves risk. Do your own research or consult a professional advisor before investing.

MSFT Q1 EARNINGSMicrosoft Earnings Presentation. We have a strong resistance area that we need to break. If we break through that area, we would move toward the second resistance zone, with strong support at 355.
If MSFT report strong earnings, the stock could move toward the $420 area, where it reached during the last earnings release.

Microsoft in Focus Ahead of Key Earnings, AI Outlook Under WatchMacro:
- Microsoft (MSFT) climbed on cautious optimism ahead of major earnings and economic data.
- Four of the “Magnificent Seven,” AMZN, AAPL, META, and MSFT, are set to report, with investors focusing on Microsoft (MSFT) today.
- Wall Street expects EPS of 3.22 USD and revenue of 68.44 B USD, both up YoY. Microsoft’s strength in AI, cloud, and enterprise software, along with its continued investment in AI talent and solid dividend history, makes this a closely watched report.
- Key drivers will be its results, AI/cloud growth outlook, and forward guidance, while any surprises could shift the stock sharply.
Technical:
- MSFT recovered and tested the resistance at around 396, confluence with EMA78. The price is sideways, and we await a clearer breakout to determine the following direction.
- If MSFT breaks above 396, the price may approach the following resistance at 405, confluence with the 100% Fibonancci Extension.
- On the contrary, remaining below 396 may prompt a retest to the support at around 378, confluence with the broken descending channel.
Analysis by: Dat Tong, Senior Financial Markets Strategist at Exness

April 29 Trade Journal & Stock Market AnalysisEOD accountability report: +686.25
Sleep: 8 hour, Overall health: :thumbsup:
Overall a decent day, but signals felt iffy today.
**Daily Trade Signals based on VX Algo System**
— 10:00 AM Market Structure flipped bullish on VX Algo X3!
10:27 AM VXAlgo ES X1 Sell Signal (double signal) :x:
1:08 PM Market Structure flipped bearish on VX Algo X3! :x:
1:51 PM Market Structure flipped bullish on VX Algo X3!
— 2:20 PM VX Algo ES X1 Sell Signal :x:
— 3:38 PM VXAlgo ES X3 Sell Signal (Double signal)
Next day plan--> Over 5470 = Bullish, Under 5470 = Bearish
Video Recap -->https://www.tradingview.com/u/WallSt007/#published-charts

Trading Analysis for Microsoft**Current Price:** $387.3
**Direction:** **LONG**
**LONG Targets:**
- **T1 = $395.0**
- **T2 = $405.0**
**Stop Levels:**
- **S1 = $383.0**
- **S2 = $376.0**
---
**Wisdom of Professional Traders:**
This analysis synthesizes insights from thousands of professional traders and market experts, leveraging collective intelligence to identify high-probability trade setups. The wisdom of crowds principle suggests that aggregated market perspectives from experienced professionals often outperform individual forecasts, reducing cognitive biases and highlighting consensus opportunities in Microsoft.
**Key Insights:**
Microsoft is demonstrating robust growth potential, particularly buoyed by its increasing investments in AI infrastructure and cloud computing services. Traders see the stock primed for a continuation of its upward momentum due to growing demand for AI applications across industries and Microsoft’s advancements in integrating AI technology into its product ecosystem. Institutional confidence remains high, with analysts highlighting key drivers such as Azure's market share expansion and strong profitability metrics.
Near-term momentum ahead of earnings is supported by key technical indicators and market sentiment. Resistance at $390 and psychological levels around $400 are being closely monitored by traders. Sustaining movement above these levels could lead to further upside potential that traders are ready to capitalize on.
**Recent Performance:**
Microsoft's stock has been outperforming many peers in the tech sector, consistently trading above its 20-day and 50-day moving averages. This indicates short-term bullish momentum, though it has struggled to break above its 200-day moving average. The consolidation phase observed recently suggests that market participants are awaiting pivotal news such as earnings results to initiate significant directional moves. A notable surge in buying interest has also been seen across its options market, signaling optimism among institutions and retail investors alike.
**Expert Analysis:**
Analysts have been praising Microsoft's execution in fulfilling long-term AI strategies, which could potentially add billions to future revenue streams. Growth in cloud services led by Azure and partnerships with OpenAI further underline the company’s strategic edge in the evolving tech landscape. Technical indicators like RSI and MACD also signal bullish sentiment, with key support levels well-defined at $376 and $383, safeguarding downside risks. Many experts agree that a robust quarterly earnings beat or upward revision of guidance could ignite momentum toward the $405-$413 range.
**News Impact:**
Anticipation is building ahead of Microsoft's earnings announcement, where traders are expecting a strong beat on both revenue and EPS metrics. Positive sector-wide developments in generative AI, alongside broader macro trends benefiting tech, have left investors optimistic about the stock's prospects. Any updates on Microsoft's AI-driven initiatives or its integration into major product lines could significantly impact future share price movements. Additionally, the regulatory environment around AI technologies is being closely monitored as it could influence long-term valuations.
---
**Trading Recommendation:**
Microsoft is well-positioned for long-term bullish momentum, with near-term upside heading into its earnings report. Clear support levels are established at $376 and $383, providing safety nets for traders while resistance levels of $395 and $405 present opportunities for potential gains. This setup aligns with expert analysis and institutional sentiment, making a LONG trade favorable for those seeking an entry point into a high-performing tech giant with strong fundamentals.
```

$MSFT : A 'Teflon' stock refusing to budge under pressureI promised multiple times that a detailed analysis of NASDAQ:MSFT will be published. Its time, today we analyze the levels to watch for and the future price points in this stock.
A large cap stock like NASDAQ:MSFT is a difficult ship to navigate. During the recent turbulence the stock lost almost 33% of its value. Even during these times, it never broke below the prior cycle highs of 345 $ in contrast to other MAG7 stocks like NASDAQ:TSLA which then led to more than 50% downturn in the stock. But as the headline says NASDAQ:MSFT is Teflon stock with resistance to go down. In the weekly chart we see that the stock never broke below the midpoint of the upward sloping regression band channel which is @ 375 $.
Now where does the stock go from here? If we plot the Fib levels on NASDAQ:MSFT we see that it is firmly at 0.382 which lies at 392 $. Next level is at 415 $, and we have an earning catalyst upcoming for NASDAQ:MSFT and if the stock closes above 425 $ then we can easily touch 422 $.
Verdict : NASDAQ:MSFT keep on DCAing. Earnings quality with low volatility.

MSFT Downtrend Over?Gray support is holding the price drop.
Yet, in my primary count, I´m still considering this is blue 4 correction.
Statistically, wave C usually ends with divergence, and we don't see it on the daily or the 4H timeframes.
So, I'll stick to this count as long as price stays below wave 1 (412.29).

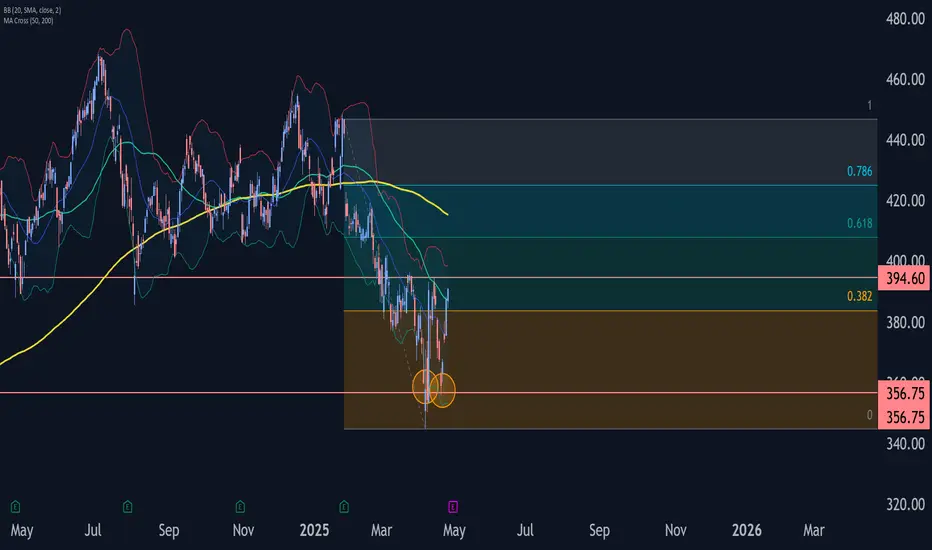
Microsoft Wave Analysis – 25 April 2025
- Microsoft rising inside impulse wave i
- Likely to test resistance level 394.60
Microsoft continues to rise inside the minor impulse wave i which started earlier from the support area between the key support level 356.75 and the lower daily Bollinger Band.
The active impulse wave i belongs to the c-wave of the ABC correction 2 from the start of April.
Microsoft can be expected to rise toward the next resistance level 394.60 (which reversed the previous waves iv and a).