SID trade ideas
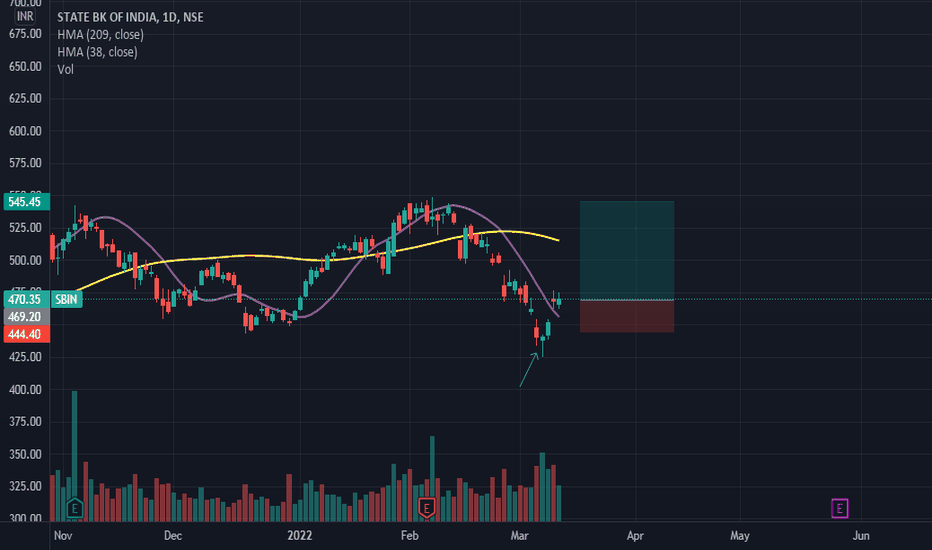
STATE BK OF INDIA Daily VERTICAL DOTTED LINE is Ultra high volume down bar
Higher volume-Professionals are buying into the public sellin
CONFLUENCE OF 2 Bulllish Patterns Strong zone BAT & Crab
Earlier this Pattern given good reaction on BAT Type1 entry & both target hit now price again came into PRZ Zone of Pattern it becomes a TYPE2 Entry which is REVERSAL and formation of another BULLISH CRAB making it as STRONG POTENTIAL REVERSAL ZONE
price need to follow Green Trend line & hit target
If price Breaks Red Trend line is where EXIT before SL hits
POTENTIAL BUY
SBIN | Good Short Opportunity.When it comes to the technical analysis of SBIN, you might get an impulse to the downside. Based on my technical analysis, you might see a fall to the downside. If you are going in, better find a pullback. I have marked a good entry area on the chart; you may use it as an entry area. And also don't forget to place the stop just above the entry area.
What do you think is more likely to happen? Please share your thoughts in comment section. And also give a thumbs up if you find this idea helpful. Any feedback & suggestions would help in further improving the analysis.
If you find this technical analysis useful, please like & share our ideas with the community.
Good Luck!
Disclaimer!
This post does not provide financial advice. It is for educational purposes only! You can use the information from the post to make your own trading plan for the market. But you must do your own research and use it as the priority. Trading is risky, and it is not suitable for everyone. Only you can be responsible for your trading.
Simple Trade Setup | SBIN | 18-04-2022 [INTRADAY]NSE:SBIN
Trade Setup for 18-04-2022
1) Don't Jump in to trade at the beginning of the market. Let it get settle for 15-20min first and judge the price action.
2) Everything is mentioned on the chart. I hope it is easy to understand.
3) All the levels will work as support, resistance, entry and exit w.r.t price action near that level.
4) Avoid gap up or gap down chase. Wait and trade between levels.
Please refer below chart for levels.
Hope I made it easy to understand it.
Do comment your doubt or suggestion.
Note: Trade with Strict SL. It may or may not hit all the levels. So one can book profit / loss at respective level considering how price action works near that level.


