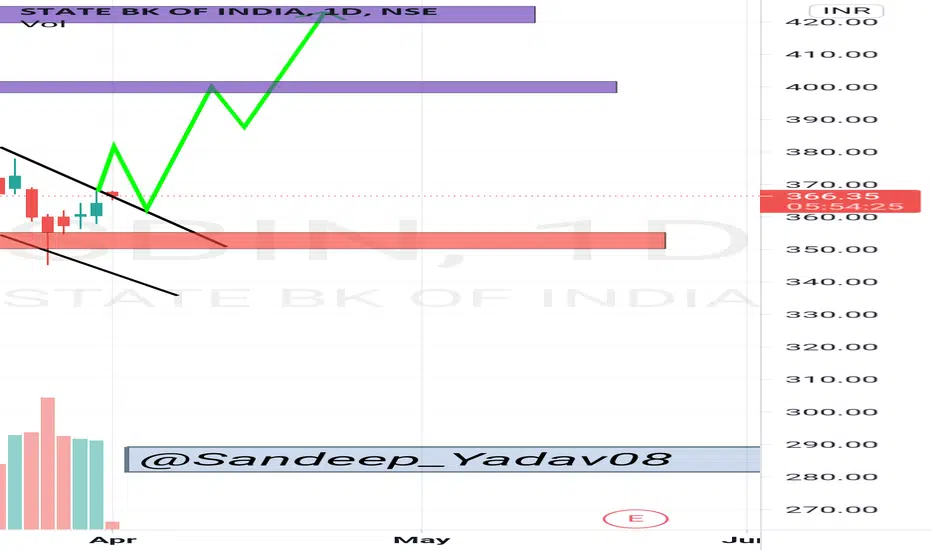
SBIN : My View for April Flag Pattern breakout on daily chart. keep watch and Enjoy.
I am Not Sebi Registered Analyst .
!!!This chart pattern is for study Porpose only !!!
SID trade ideas


SBIN FULLY BULLISH#SBIN
1D
Bullish flag pattren
Gap filled
Buy when sustain above the the upper trendline of flag
Target 400/420++
Sl 345
#POSITIONAL
#CHARTVIEW

SBIN FULLY BULLISH#SBIN
1D
Bullish flag pattren
Gap filled
Buy when sustain above the the upper trendline of flag
Target 400/420++
Sl 345
#POSITIONAL
#CHARTVIEW

SBIN AT SUPPORTThe stock has reached multi-timeframe support and chances are high that it could see some bounce from here.

Game Over For Sbin ???Evening Star On Weekly Time Frame
Sbin Is Sell, Closing Price 381
Strict SL Of 428 (WCB)
Target - 300/270

50MA Breakout done in 1 hour timeframe. Safe above 374.Target 404.
Note: Volume is less on breakout, so be cautious.


SBIN ready for new journey !SBIN, Its pretty amazing to see how market remembers the GAP! Finally GAP on last Friday ! Gap filling also coincided with cycle completion. Call it Flag formation or whatever you want! I think it begin new upward journey!


sbi gap fillupsbi gap fill market is bull
but market to subject risk.
not advice only study purpose.

SBIN - Elliott wave analysis - 5th wave It starts 5th wave up soon, but wait for channel breakout to confirm the up trend. After trendline breakout the low will be the stop loss for the long trade.

SBIN 1HR4HR & 1HR BULLISH DEEP CRAB@1.902XA
price need to follow Green Trend line & hit target
If price Breaks Red Trend line is where EXIT before SL hits
POTENTIAL BUY
WEEKLY BEARISH ALT BAT SO STRONG DOWNTREND Buy is retracement

SbinKey Levels are mentioned in chart
Disclaimer
I am not sebi registered analyst
My studies are Educational purpose only
Consult with your Financial advisor before trading or investing

SBI Gap is FilledSBIN Gapped up on 4th Feb 21 and Rose all the way to 426. since the stock is declining and today's closing is at 367.10. with this price action, the Gap is totally filled. Stock is expected to take support on these levels.


STATE BK OF INDIA 15MNBULLISH BAT for SCALPING
price need to follow Green Trend line & hit target
If price Breaks Red Trend line is where EXIT before SL hits
POTENTIAL BUY

STATE BANK OF INDIA - SHORT TERM BUYING BY MARKET INSIDERSSTATE BANK OF INDIA - SHORT TERM BUYING BY MARKET INSIDERS

Sbi longHigh risk trade.. Contra. Good RR. May head back to 390-400.
This is not any trade or investment suggestion.

