TSLA PRICE ACTION 1ST JUNE 2025This is the updated price action of Tesla. I have explained why I exited long positions. If you have any doubts, then feel free to leave a comment below.
NOTE: STAY AWAY FROM TSLA LONGS
TL0 trade ideas

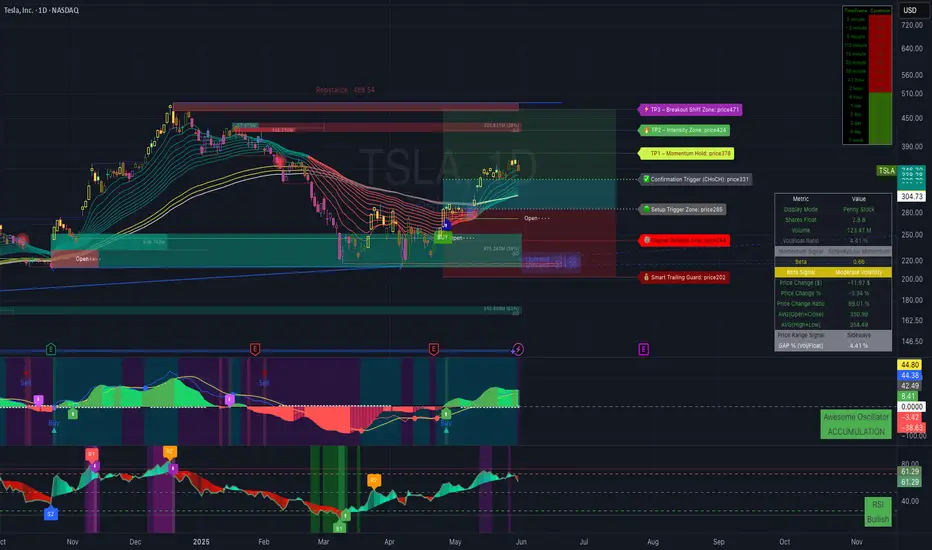
TSLA GEX Daily (Options Sentiment Outlook) June 2TSLA's GEX layout is looking real clean for directional play this week. We're hovering around 346.46, just below that major 355 HVL (High Volume Level) and 2nd CALL wall, which is where dealers are likely to defend or pin unless price makes a decisive move.
Here's the flow setup:
* 🟩 46.96% GEX and call wall cluster between 355–375, acting as short-term resistance unless we see a breakout.
* 🟥 Below sits strong put support near 320, and that's also near the bottom of the red zone (-36.74% GEX).
* ⚠️ IVR only at 24.8, so premiums are cheap — smart to consider directional plays before vol spikes.
🧠 Options Strategy Idea (Based on GEX):
* Bullish: Wait for clean break/close above 355, then go for Jul 19 370c or a debit spread like 355c/375c.
* Bearish Hedge: If TSLA fails 346 and drops under 335, consider Jul 19 330p/320p spread for risk-managed downside.
🎯 Call buyers should wait for confirmation over 355 — there's serious gamma resistance there.
Puts get spicy below 335 — dealers likely flip short and accelerate downside.
⏱️ TSLA 1H Chart (Swing & Intraday Action Plan)
Now zooming in to the 1-hour structure...
TSLA had a clean uptrend with some hesitation at 355, forming a local double top structure before Friday's selloff. We’ve bounced off 335 demand, and that’s shaping up as this week’s pivot zone.
Current structure notes:
* 📉 Strong rejection near 355.
* 📊 Price is consolidating under that level — likely gearing up for either a breakout or a deeper pullback.
* 🔄 EMA looks flat, volume tapering → signaling indecision.
📈 Swing Setup:
* Bullish: Long on reclaim + retest of 355, targeting 370–375. Stop below 348.
* Bearish: Short setup under 335 breakdown → target 320 zone. Stop above 340.
📉 Intraday Plan:
* Range: 335–355 is your battlefield.
* Play the edges:
* Short near 355 rejection → target 346 or 338.
* Long off 335 bounce → scalp back to 346–350.
💬 This zone is all about patience — don’t chase inside the chop. Let price either reclaim 355 or flush below 335 before going heavy.
🧠 Final Thoughts
TSLA’s setup is one of the more binary ones this week — it’s coiled under gamma resistance but holding key demand. GEX is telling us this: break 355 and the path is open to 370–400; lose 335 and things can slide to 320 fast.
Cheap IV? Great for debit spreads or directional plays. But stay reactive — TSLA rarely stays quiet for long.
⚠️ Disclaimer:
This analysis is for educational purposes only. Not financial advice. Always manage risk and do your own research before trading.

Trade of the week: $TSLA (Short)Trade of the week: NASDAQ:TSLA (Short)
Current price: $346
Entry Trigger:$339
Stoploss: $353
Call option: NASDAQ:TSLA $300 put expiry 06/20 at $4.45(*1 Contract only)
Thesis: NASDAQ:TSLA is in daily uprising channel aka building a wedge. NASDAQ:TSLA last week made a doji candle on weekly often that leads to reversal. You may take this trade at entry trigger point or You may find a cheaper entry or wait for trigger point (or me) to get into the trade. Contract price might vary depending on entry. Targeting sub $310 in upcoming weeks. Respect stoploss.

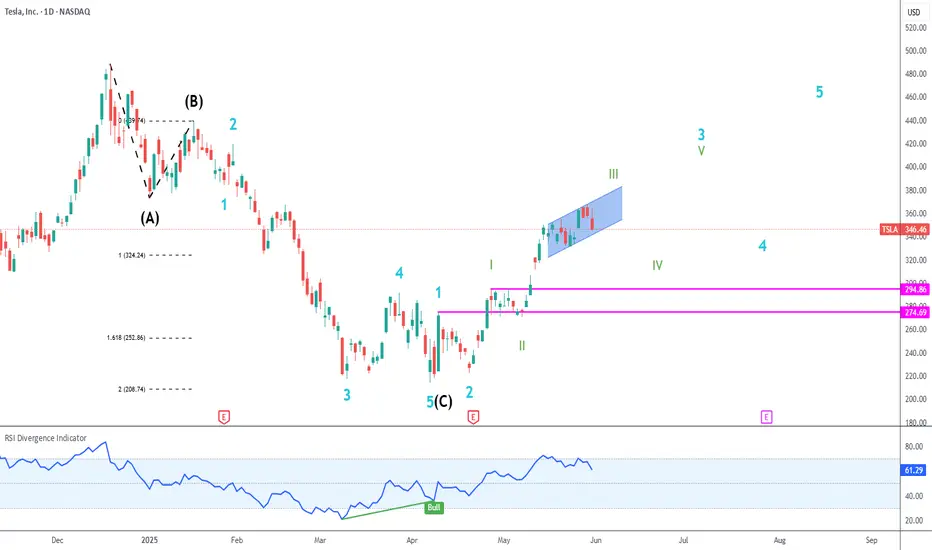
TSLA UptrendTesla has regained an uptrend in a motive wave.
In my primary count, we are currently close to finishing green III of blue 3.
Pullbacks into support zones are buying opportunities.
TESLA: Short Trade with Entry/SL/TP
TESLA
- Classic bearish formation
- Our team expects pullback
SUGGESTED TRADE:
Swing Trade
Short TESLA
Entry - 345.78
Sl - 360.55
Tp - 309.96
Our Risk - 1%
Start protection of your profits from lower levels
Disclosure: I am part of Trade Nation's Influencer program and receive a monthly fee for using their TradingView charts in my analysis.
❤️ Please, support our work with like & comment! ❤️

TSLA Trade Idea – New Structure Forming
📌 TSLA Trade Idea – New Structure Forming
🕒 12h Timeframe Analysis
TSLA’s previous structure is considered complete. A new structure is likely forming, with a strategic entry around $310 based on the 40-cycle pattern.
🔍 Key Observations:
Volume/Float ratio < 10%, showing low activity—most traders are waiting.
Dark pool data suggests heavy short interest, but I see this as high risk.
Market is still bullish, and current price action looks like a retest/consolidation, not a full bear trend.
📈 Macro View:
TSLA is likely forming a 385-day bullish structure with a potential upside target near $791. The current zone is a potential weekly entry point for swing or long-term plays.
🎯 Trade Plan:
Entry: $310
Stop Loss: $331
Target: $460 (short-term swing target)
Bias: Bullish
Strategy:
Long-term investors: Position entry, manage SL properly.
Option traders: Avoid buying—only consider option selling during chop.
⚠️ Disclaimer:
This trade plan is for informational purposes only and does not constitute financial advice. Trading involves significant risk. Always do your own research or consult a licensed advisor before making decisions.
TSLA (Daily) Elliot Wave 3 UnderwayTSLA appears to still be printing a motif wave 3 after finding a bottom at the $208 high volume support node. Fib extension targets suggest we have much higher to go including a new all time high.
Upside resistance target sits just below $413 in the HVN.
Downside targets may test the previous swing high $284
Safe trading

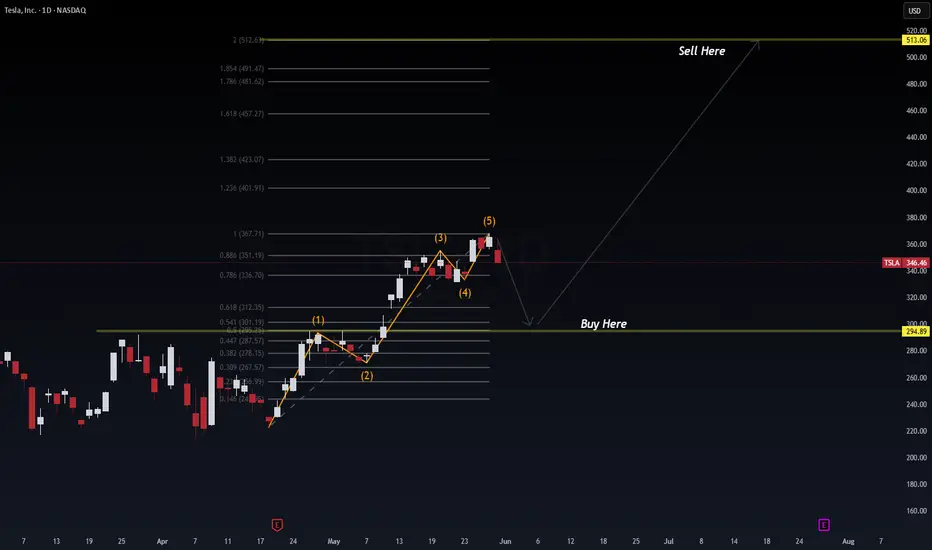
TSLA (Tesla) – Elliott Wave Impulse Ending + Fibonacci CorrectioTesla completed a textbook 5-wave Elliott impulse to the upside, topping out near the 1.0 Fibonacci extension ($367.71). We're now seeing signs of a corrective wave likely targeting the golden zone near $294.89 — aligning with SPY/NVDA retracements.
🔍 Elliott Wave Count:
Wave (1): Impulse from breakout
Wave (2): Shallow pullback
Wave (3): Extended rally
Wave (4): Minor correction
Wave (5): Final push – now failing
📉 Fibonacci Zones:
Current Price: $346.46
Wave 5 Completion: ~$367
Retracement Target: $294.89 (0.5–0.618 confluence)
Extension Target: $513.06 (2.0 extension from wave base)
📊 Probabilistic Outlook
🔻 Correction to $294.89 = 70% probability (based on wave structure + Fib retracement logic)
🔼 Rally to $513+ = 60% probability if support holds and market conditions remain risk-on
🌐 Macro Alignment (May 31, 2025)
🔄 Market rotation into value → temporary tech cooldown
📉 NVDA false breakout and SPY retracement suggest broader pullback
🧠 Tesla is a beta-multiplier to NASDAQ; expect correlation
🧭 Trade Plan:
Buy Zone: $294.89 (watch for confirmation + volume spike)
Sell Target: $513.06 (Fib 2.0 extension)
Stop: Below $278 (structure invalidation)
🧠 Pro Insight:
This is a Wave 2/4 retracement zone where institutions often reload. The broader macro pullback may present one of the last deep dips before a Q3 breakout.
#TSLA #ElliottWave #FibLevels #TechStocks #SmartMoney #SwingTrade #NASDAQ #WaverVanir #TradingView
TslaFirst off.. that weekly candle was horrendous
Rising wedge here.. you can see it on the rsi as well
The target of this rising wedge is 300 or daily 200sma..
Lets see how wed get there..
We would need to break below 330.00.
351-355 will be strong resistance if you see a test up in that area I would open a short for 330... cover at 330 and wait for the break below to short for 300
The sector tsla trades under is XLY..
I was saying for the last few days that tsla will have trouble unless XLY could clear 218.. now XLY has finished with a similar weekly reversal candle

Pullback time?As it seems, the pullback might be here. I'm looking at one interesting level, if the price doesn't drop to that level, it's super bullish. GAP and Ma 200 area 300-310 ish

Tesla Sell Signals- 05/30/25Tesla Inc. has several bearish signals.
On 05/29/25 it peaked close to 02/19/25 top.
RSI on 05/29/25 had a bearish divergence vs. its 05/14/25 reading. Also, the reading on 05/30/25 was below the reading made at 05/21/25, predicting price could go down to the where it was on 05/21/25.
Stochastic has a bearish line cross in the overbought zone above 80.00.
On 05/30/25 the price went below the low of the big up bar made on 05/27/25.
First support is in the 285 to 270 area.
Price could ultimately go much lower.

Tesla: Completed!TSLA has moved somewhat closer to the resistance at $373.04 since our last update, but these gains have now been tempered. We now consider the turquoise wave 4 as finished and anticipate imminent sell-offs during wave 5. These should eventually complete the magenta wave (3) of a larger downward impulse below the support at $215.01. However, due to recent upward momentum, we have increased the relevance of our alternative scenario. We now consider it 38% likely that the stock has already completed the large correction of the blue wave alt.(II) with the last significant low and will continue to rise directly during wave alt.(III). In this case, the price would next not only rise above the nearby resistance at $373.04 but also overcome the higher levels at $405.54 and $488.50.
📈 Over 190 precise analyses, clear entry points, and defined Target Zones - that's what we do.

Is This the Perfect Moment to Execute the Tesla Heist?💰 Tesla Stock Market Heist Blueprint 🚀
🌟 Hi! Hola! Ola! Bonjour! Hallo! Marhaba! 🌟
Dear Money Makers & Robbers, 🤑💰💸✈️
Here’s our grand plan: a 🔥Thief Trading Style heist🔥 targeting the TESLA stock! Let’s break in with this cunning strategy — chart-ready and primed for action!
🎯 Entry:
The vault’s open! Grab the bullish loot at any price — the heist is live!
Tip: For precision, use a buy limit order on 15m/30m swing highs or lows — that’s your perfect pullback entry!
🛑 Stop Loss:
Thief SL is stashed at the nearest swing low (or just below the MA on the daily chart ~300.00 for swing trades).
Tailor SL to your trade risk, lot size, and your thieving gang’s order plan.
🏴☠️ Target:
460.00 — or vanish before hitting the target to avoid the traps of the overbought zone!
💎 The Setup:
We’re seeing bullishness fueled by key factors: macro moves, fundamentals, sentiment, intermarket trends… it’s all in play! 📈🔗🌏
Check the macro, COT report, sentiment outlook, and future trend targets to stay ahead of the game!
⚠️ Trading Alert:
News releases can flip the game fast.
Avoid fresh trades during major news.
Use trailing stops to lock in those juicy profits and protect your loot.
❤️🔥 Support the Heist Crew!
💥Hit the Boost Button💥 — fuel our robbery plans and let’s keep cashing in every day!
The Thief Trading Style: slick, powerful, and ready for the next heist.
See you soon with another plan, fellow robbers! 🤑🐱👤🤩

Musk Steps Away from Politics: What Does It Mean for Tesla?Musk Steps Away from Politics: What Does It Mean for Tesla (TSLA) Stock?
Yesterday, it was announced that Elon Musk will be stepping down from the Trump administration as his term as head of DOGE—where he focused on reducing government spending—has come to an end.
This decision follows his statement at the economic forum in Qatar, where Musk said he plans to focus less on politics, as he feels he has already done enough in that realm.
What Does This Mean for Tesla (TSLA) Stock?
Musk’s move away from politics is likely a positive signal for investors. Here's why:
→ The company’s CEO can now devote more time to addressing issues such as declining vehicle sales in Europe;
→ Musk’s role at DOGE will no longer pose reputational risks for Tesla..
During yesterday’s main trading session, TSLA stock surged to $367—its highest level since mid-February.
Technical Analysis of TSLA Stock Chart
The price continues to hover near the upper boundary of an ascending channel (marked in blue), which could pose a challenge for further upward movement.
Additionally, the price has entered the $355–$375 range—a zone that previously triggered significant reversals (as indicated by arrows). Notably, there was a sharp decline from this zone between February 21–26. From a bearish standpoint, this area could act as resistance, and the candle’s close near its low yesterday supports this view.
From a bullish perspective, the fundamental outlook may still provide upward momentum:
→ A joint press conference with Trump and Musk is scheduled for today;
→ In early June, Tesla is expected to begin testing its autonomous taxis.
So, while a continued uptrend is possible, a short-term correction would seem reasonable after TSLA’s nearly 27% surge throughout May.
This article represents the opinion of the Companies operating under the FXOpen brand only. It is not to be construed as an offer, solicitation, or recommendation with respect to products and services provided by the Companies operating under the FXOpen brand, nor is it to be considered financial advice.

Tesla - continuationEven with bad earnings, the Tesla stock got pushed up, this has something with Sentiment and Momentum to do but would take to long to explain, what is important from price action it did everything right and all indicators for a successfull trendchange are verified.

easy play on TESLAThose who know me know that this one on Tesla is an easy play, it's a chill idea, because I'm a chill person, so I assure you this is one of the chillest ideas ever, a bounce is mandatory here.

#TESLA - 30 Points MoveDate: 19-05-2025
#TESLA
Current Price: 340.15
Mid-Point: 340.42
Upside Targets: 355.54, 363.22, 371.77 and 380.32
Downside Targets: 325.33, 317.62, 309.07 and 300.52
Support: 333.05
Resistance: 347.85

Tesla Stock Analysis: Anticipating a Dip Before a Surge to $366Currently, Tesla's stock is trading around $298, and I'm expecting a slight retrace downwards towards the $250 to $268 price range. From that area, I anticipate a rally upwards, targeting the $366 area.
In summary:
Current Price: Around $298.
Expected Retrace: To the $250 - $268 range.
Expected Rally: Towards $366.
Please remember that this is just an analysis and a forecast, and the stock market is unpredictable. Always conduct your own thorough research before making any investment decisions.

Tesla Ascending Parallel Channel for Trend ContinuationTesla Ascending Parallel Channel for Trend Continuation
Stop Loss: 333.21
Buy Stop: 389.34
TP1: 443.32
TP2: 495.54
No Divergence

TSLA New ATH incoming? Overview of primary catalysts.After trading between $346 and $365 intraday on May 27, Tesla shares closed at $362.89—up modestly despite broader market headwinds and lingering investor skepticism.
Here’s a detailed breakdown of the primary catalysts shaping Tesla’s stock price (ranked 0–10):
1. Electric Vehicle Demand Growth
Strength: 9/10
Global EV adoption remains the single largest driver of Tesla’s top line. Despite slowing sales in Europe and China, overall EV penetration continues to surge as consumers shift away from internal-combustion engines.
2. Launch of Affordable Model (Entry-Level EV)
Strength: 8.5/10
Elon Musk has reiterated plans to unveil a sub-$25,000 EV in early 2025, targeting the mass market. Investors cheered a recent reaffirmation of focus on core products over peripheral projects.
3. Battery Cost Reductions & Margin Expansion
Strength: 8/10
Tesla’s relentless drive to lower battery pack costs underpins both profitability and price competitiveness. Q4 cost of goods sold dipped below $35,000 per vehicle, even as margins softened amid mixed volumes.
4. Autonomy & Robotaxi Progress
Strength: 7.5/10
Commercial robotaxi trials are slated to begin in Austin in June 2025, with a dedicated Cybercab in development. While regulatory and safety hurdles loom, the promise of recurring software subscription revenue could be transformative.
5. Competition from Other EV Manufacturers
Strength: 7/10
Legacy automakers and startups alike are ramping up EV offerings. Tesla’s U.S. market share has declined in recent years, highlighting intensifying pressure in key regions.
6. U.S.–China Trade Policies & Tariffs
Strength: 6.5/10
Fluctuating tariffs on Chinese EV imports have led to order suspensions and forecasting challenges. Trade-policy uncertainty remains a wild card given Tesla’s global supply chain.
7. Regulatory Incentives & Subsidies
Strength: 6/10
U.S. federal tax credits under the Inflation Reduction Act and similar programs in Europe and China support EV demand—and Tesla’s eligibility criteria will influence its market growth.
8. Commodity Price Volatility (Lithium, Nickel, Cobalt)
Strength: 5.5/10
Raw material cost swings can erode margins. While long-term supply agreements help, spot shortages or price spikes remain risks.
9. Fed “Higher for Longer” Interest Rate Environment
Strength: 5/10
Elevated real yields reduce the appeal of high-growth names like Tesla. A sustained hawkish stance from the Fed could continue to cap valuations, similar to how it weighs on non-yielding assets.
10. Corporate Governance & Elon Musk’s Public Profile
Strength: 4/10
Musk’s high-profile engagements and occasional controversies can politicize the brand, prompting sentiment-driven stock swings.
Catalyst Strength Rankings (May 2025)
🔸 EV demand growth: 9
🔸 Affordable Model launch: 8.5
🔸 Battery cost & margins: 8
🔸 Autonomy/robotaxi progress: 7.5
🔸 Competition: 7
🔸 Trade & tariffs: 6.5
🔸 Regulatory incentives: 6
🔸 Commodity costs: 5.5
🔸 Fed rates: 5
🔸 Musk profile: 4
Analyst Forecasts for 2025
| Analyst / Consensus | 12-Month Price Target | Rating |
| --------------------------- | --------------------- | ------------ |
| High | \$470.00 | – |
| Median | \$306.00 | Hold/Neutral |
| Low | \$115.00 | – |
| Average (Consensus) | \$306.29 | Hold |
| Dan Ives (Wedbush) | \$315 | Outperform |
| Adam Jonas (Morgan Stanley) | \$430 | Overweight |
* Consensus sees a range of \$115–\$470 with an average near \$306.
* Dan Ives trimmed his target from \$550 to \$315, citing tariff risks and political headwinds.
* Adam Jonas remains bullish with a \$430 target, viewing Tesla as an “embodied AI compounder” despite near-term brand challenges.
Where to Next for Tesla?
* Current price: \~\$362.89
* Key support levels: \$350 and \$340
* Next technical floor: \$330
* Upside triggers: Stronger-than-expected delivery volumes, breakthrough in full-self-driving (FSD) reliability, or renewed cost cuts.
Tesla’s stock remains a balance between long-term disruptive potential and short-term execution risks. While EV adoption and autonomous ambitions underpin a compelling growth narrative, margin compression, competitive pressures, and macro uncertainties will dictate volatility in the months ahead.

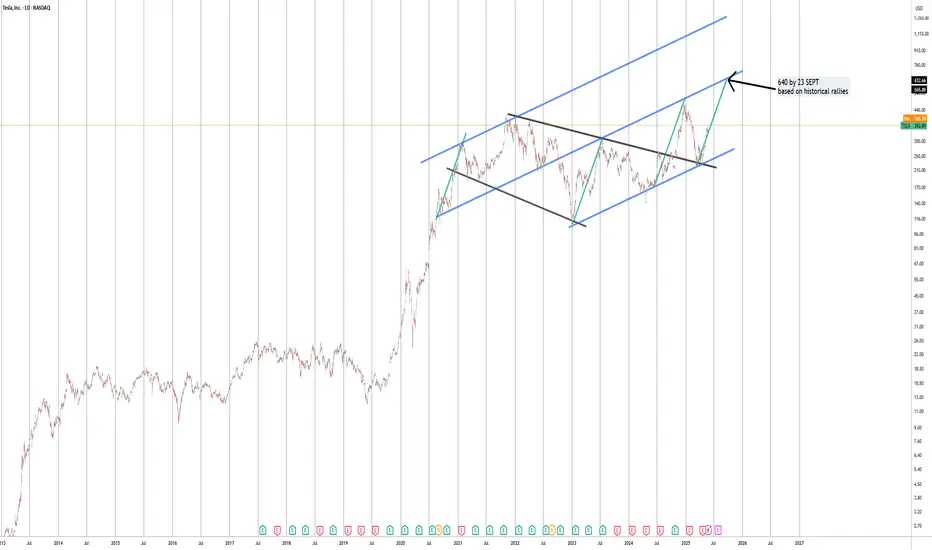
Tesla price target based on geometryTesla $640 by sept based purely on price geometry and trend analysis. In the past Tesla has shown rallies matching in time and price
$TSLA: Big bull flag? 400 soon? But tariff talks againMarket mix up. NASDAQ:TSLA Eyeing this, positioned for a couple weeks out on my calls which are ugly red but, I think this is setting up for something in the next few weeks? Although, feels like tariff talks again are not letting this run as well. #NFA

TSLA eyes on $350: not just a round number bot also Genesis fib TSLA has been butting up against $350 for a reason.
The round number is further reinforced by fibs.
Look for Break-n-Retest or Dip-to-Fib for entry.
$349.99 happens to be a Genesis fib (minor ratio)
$340.59 is a Golden Covid fib, another strong one.
$331.57 is a semi-major Genesis fib for support.
=======================
Previous Trade Calls below
=======================
$205 bottom call
Trump Pump dip buys
$294 Dunk then Break
=============================================
.
