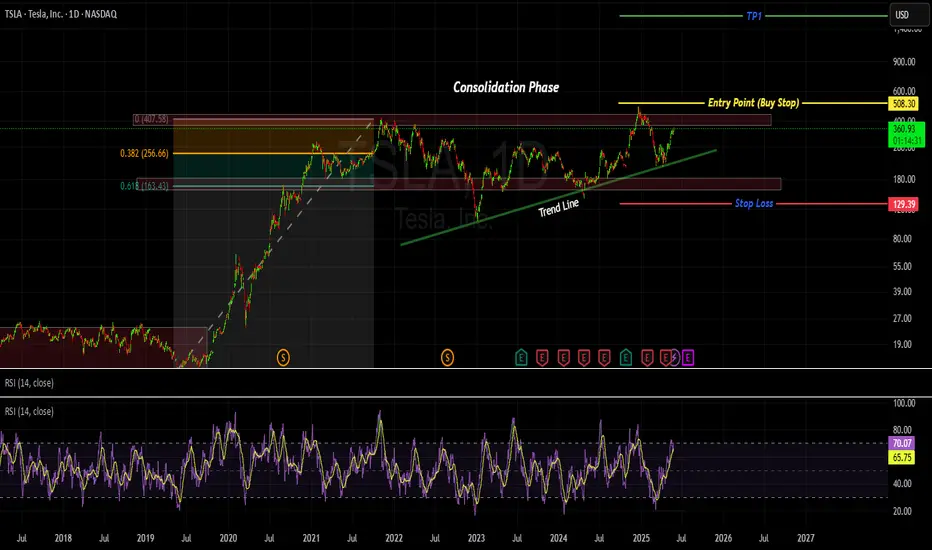
TESLA - POSTIONS ACCMULATING OR MARKET CONFUSION !!!!Hi, Tesla is making series of HH and HL. Bullish trend line can also be seen. however, it is in consolidation phase since long. currently the market is trading near the strong resistance level of 409. if the market break this support level and even breaks the previous HH which is 482 then we can expect market to take a bull ride.
Trade entry plan is to set BUY STOP order type at the mentioned Entry Point. once the trade is executed we can Set Stop Loss slightly below the previous HL /support level.
TP1 and TP2 are placed with 1:1 and 1:2 Reward to Risk ration
TL0 trade ideas
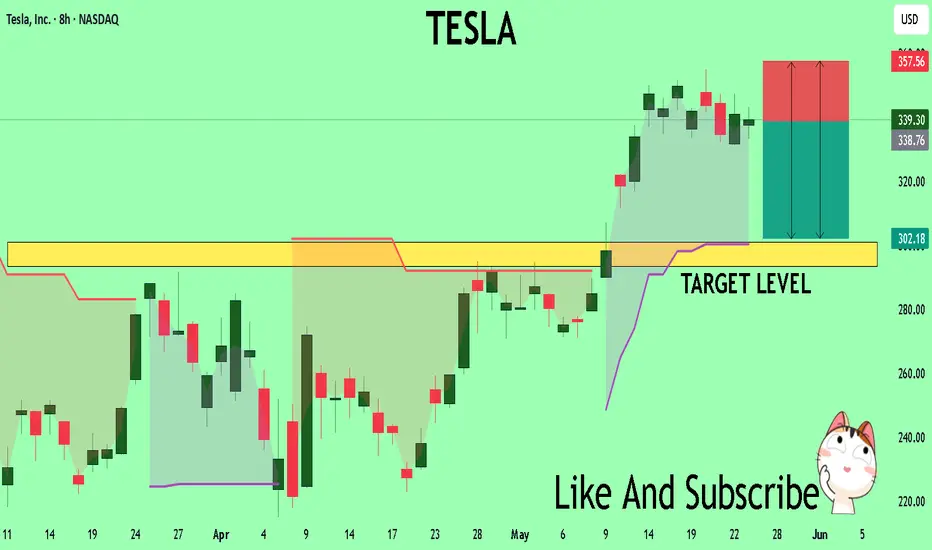
TSLA: Break-out above bull flag, possible cup and handle?So, a few days ago, I posted about a bull flag forming on the daily chart for Tesla. This flag pattern was a period of consolidation following an incredibly whooping rally from the $270 mark to around $350 (around a 30% or so gain).
Today, we have a new break-out from this consolidation period, and as of writing right now, Tesla is up 7%. It has now breached the $350 resistance level.
If you look more closely, the chart pattern resembles something close to a cup and handle pattern. You have the cup base going from the 20th of Feb 2025 all the way to the 14th of May 2025. Our bull flag which lasted between the 14th of May until the 23rd of May (last Friday), could as well be a handle for the cup base.
A break-out from not only the bull flag but the cup and handle could signal a massive move towards $400, however $375 and $390 could be points of resistance, and it would be wise to watch for a cooldown in the short-term.
Upcoming this week, it might worth mentioning that NASDAQ:NVDA earnings could have a strong impact on tech and affect Tesla - even if Tesla isn't much exposed to AI as the semiconductors.
To conclude, target is $390-$400 however as we all know, nothing is guaranteed :)
Note: Not financial advice. My analysis is not advice, rather just an idea. Please do your DD as well.

TESLA Index Stock Chart Fibonacci Analysis 052625Trading Idea
1) Find a FIBO slingshot
2) Check FIBO 61.80% level
3) Entry Point > 330/61.80%
Chart time frame:D
A) 15 min(1W-3M)
B) 1 hr(3M-6M)
C) 4 hr(6M-1year)
D) 1 day(1-3years)
Stock progress: B
A) Keep rising over 61.80% resistance
B) 61.80% resistance
C) 61.80% support
D) Hit the bottom
E) Hit the top
Stocks rise as they rise from support and fall from resistance. Our goal is to find a low support point and enter. It can be referred to as buying at the pullback point. The pullback point can be found with a Fibonacci extension of 61.80%. This is a step to find entry level. 1) Find a triangle (Fibonacci Speed Fan Line) that connects the high (resistance) and low (support) points of the stock in progress, where it is continuously expressed as a Slingshot, 2) and create a Fibonacci extension level for the first rising wave from the start point of slingshot pattern.
When the current price goes over 61.80% level , that can be a good entry point, especially if the SMA 100 and 200 curves are gathered together at 61.80%, it is a very good entry point.
As a great help, tradingview provides these Fibonacci speed fan lines and extension levels with ease. So if you use the Fibonacci fan line, the extension level, and the SMA 100/200 curve well, you can find an entry point for the stock market. At least you have to enter at this low point to avoid trading failure, and if you are skilled at entering this low point, with fibonacci6180 technique, your reading skill to chart will be greatly improved.
If you want to do day trading, please set the time frame to 5 minutes or 15 minutes, and you will see many of the low point of rising stocks.
If want to prefer long term range trading, you can set the time frame to 1 hr or 1 day.

TSLA bull flagTsla is ramping up here with a daily flag as we sit in the middle of the range between supply and demand zones on the weekly. There is plenty of room for BBWP and stochastic RSI to expand on the weekly chart.
Near term target 400$
My plan:
Buy some TSLL and sell CSP

TSLA cup and handle potentialTSLA looks like it's setting up for a bullish move with a potential cup and handle breakout on top of a potential bull flag formation on the daily. First PT at 350 psych level and 360-365, so long as it holds above 350.

Bullish Breakout Could Lead to Further Gains
Targets:
- T1 = $350.75
- T2 = $363.25
Stop Levels:
- S1 = $331.50
- S2 = $320.00
**Wisdom of Professional Traders:**
This analysis synthesizes insights from thousands of professional traders and market experts, leveraging collective intelligence to identify high-probability trade setups. The wisdom of crowds principle suggests that aggregated market perspectives from experienced professionals often outperform individual forecasts, reducing cognitive biases and highlighting consensus opportunities in Tesla.
**Key Insights:**
Tesla continues to demonstrate impressive resilience and positive technical setups despite broader market volatility. The stock has maintained its position above critical support levels, with buying activity persistently pushing prices upward. Key market drivers include Tesla’s leadership in electric vehicle innovation and artificial intelligence integration enhancing its long-term value proposition. Furthermore, renewed market enthusiasm for growth stocks contributes to Tesla’s current trajectory.
**Recent Performance:**
Recently, Tesla's price has stayed on a steady uptrend, advancing 2.7% over the past 7 days and outperforming both the NASDAQ and S&P 500 indices. While brief market corrections momentarily tested its support levels, Tesla quickly recovered, underscoring investor confidence in its growth trajectory. This strong relative outperformance confirms robust market interest in the stock as a leader in innovation.
Expert Analysis:
Market analysts have generally taken a curated bullish view on Tesla, citing multiple bullish technical indicators such as the ongoing price breakout above moving averages and a bullish consolidation pattern. Several analysts project $400 as the next key psychological level if Tesla can surpass its immediate resistance at $354.25. The fundamentals remain compelling, supported by Elon Musk's proactive engagement in Tesla's strategic advancements, which continues to instill confidence among shareholders.
News Impact:
Tesla’s current spotlight is bolstered by anticipation around its robo-taxi service, renewed AI ambitions, and Elon Musk's visible leadership within Tesla operations. These developments, coupled with strong market sentiment during recent announcements, have further strengthened its medium-term outlook. External macroeconomic risks, however, may affect momentum, necessitating vigilance by traders.
Trading Recommendation:
The technical and fundamental setups for Tesla present an opportunity for traders to take long positions with clear upside targets in mind. Critical levels include the immediate support zone at $336.76 and a breakout above $354.25, which can further fuel Tesla’s bullish momentum. Traders should monitor macroeconomic conditions and company updates while maintaining vigilance on stop-loss levels to mitigate risk as market conditions evolve.

TSLA: Not recommended by me!Hello Traders,
TSLA Tesla fundamental score is not really good for me! My score is based on EPS data and EPS forecasts. there might be better stocks out there!
Regarding the technical aspects, White it reacted to the bottom of the channel median of the channel might be a small struggle. There is a strong possible resistance on the way up. I prefer to give a better/safer score after breaking this zone. Also, if we just consider technical analysis, any long options should have a SL, the possible rational SL is so far from the current price. in case of correction or breaking the zone, the possible SL could be very tighter.
Fundamental: Not recommended.
Technical: So-So.
Overall: I don't buy

Congestion Entrance TradingCongestion Entrance marks the transition from a trend to a period of uncertainty and range-bound price action.
📘 Key Concepts:
Congestion begins when price fails to close on one side of the PL Dot for 3 bars.
The first bar that closes on the opposite side of the PL Dot (after a trend) is the Congestion Entrance bar.
This signals a likely end of the previous trend and the beginning of congestion or reversal.
🧩 Key Structures:
Dotted Line: Highest high (or lowest low) of the previous trend — often acts as a cap or floor.
Block Level: Low (or high) of the Congestion Entrance bar — often attracts price and marks congestion boundaries.
Parameters of Congestion: The range defined by the Dotted Line and Block Level.
⚙️ How It Evolves:
There are multiple transition scenarios, for example:
Trend Up → Action → Trend Down: Resistance holds at the Dotted Line, Block Level breaks.
Trend Down → Action → Trend Up: Support holds at the Block Level, Dotted Line breaks.
Trend Up/Down → Reversal: Direct shift into opposite trend if support/resistance is firm enough — skipping action phase.
🔍 Key Takeaways:
Congestion Entrance is often the first clue the market is shifting gears.
It's essential to monitor how price reacts to the PL Dot, Dotted Line, and Block Level.
Anticipate Ping trades (quick scalps) or prep for potential Congestion Action if price fails to establish a trend after entrance.
📌 Pro Tip: Watch how higher timeframes align — if the HTP is showing signs of topping or bottoming, the LTP congestion entrance may lead into a reversal or major trend change.

TESLA: A Good Trade for Bulls AND BearsTesla has an Elon problem aka a SENTIMENT problem
I am a 100% Technical Trader
I am an avid believer in Elliott Wave Theory and Socionomics
From those perspectives its clear to me that Tesla is in trouble...long term
Tesla went from essentially a meme like stock to a media and Institutional darling
The meteoric rise in the stock was largely because of belief in Elon..the person
Yes his companies have done some pretty amazing things..but if we are honest there are tons of failed promises in their past and now we are seeing competitors start to really make ground
This is showing up in vehicle pricing and units delivered..both trending down
The problem Tesla stock truly has though is that soooooo much of the company sentiment is tied into a belief in Elon- the person..versus the fundamentals of the company and their actual products (cmon we all know LIDAR is better smh)
As his popularity wains... so will Tesla
So with that said the charts are setup to provide opportunities for BOTH BULLS and BEARS over the next few years.
The chart show really clean places to take and hedge positions... but long term BULLS need to be keely aware of the "Trouble" line because if and when it breaks Tesla will be in serious trouble

TESLA: Short Trade with Entry/SL/TP
TESLA
- Classic bearish formation
- Our team expects fall
SUGGESTED TRADE:
Swing Trade
Sell TESLA
Entry Level - 339.30
Sl -354.47
Tp - 301.39
Our Risk - 1%
Start protection of your profits from lower levels
Disclosure: I am part of Trade Nation's Influencer program and receive a monthly fee for using their TradingView charts in my analysis.
❤️ Please, support our work with like & comment! ❤️

TESLA Massive Short! SELL!
My dear friends,
My technical analysis for TESLA is below:
The market is trading on 339.30 pivot level.
Bias - Bearish
Technical Indicators: Both Super Trend & Pivot HL indicate a highly probable Bearish continuation.
Target - 301.0
Recommended Stop Loss - 357.56
About Used Indicators:
A pivot point is a technical analysis indicator, or calculations, used to determine the overall trend of the market over different time frames.
Disclosure: I am part of Trade Nation's Influencer program and receive a monthly fee for using their TradingView charts in my analysis.
———————————
WISH YOU ALL LUCK
Bullish pushTesla has been down over 50% for more than 3/4. It has more than enough time to accumulate capital for a $200 bullish run that equates 20 $500 point price. It’s just shaking people out who are indecisive about Tesla‘s bullish movement currently. But according to the chart, Tesla has two directions up today or up Tuesday. The track record states that on holidays or closed market dates the market goes down Monday is memorial day so the following day the market should be expected to go down at least early in the morning Tuesday will be the day to enter buys for the market to go back up and continuous its bullish movement.
Tesla (TSLA): Daily uptrend support and potential bull flagHey guys/gals,
Today, I am showing you the daily chart of Tesla ( NASDAQ:TSLA ), which provides an idea of where this stock may be heading next.
As you can see, the support trendline from the 21st April low is still well intact. Currently, Tesla is holding this line very well and over the past few days, it's clear that it has also been in consolidation mode. Taking a deeper look, the consolidation period seems to be forming a potential bull flag pattern. Minus the upper wick which could be a price anomaly due to a fake-out, a real actual breakout from the bull flag in combination with a bounce from the support trendline could help Tesla reach $365 as the next resistance point.
On the contrary, and it does depend strongly on what the broader market does next (as Tesla is a high beta stock), its flag pattern may not play out and a break below the support line could send the stock all the way to first support at £325.
This wholly depends on the wider market. On my other posts, I've made it clear that S&P 500 AMEX:SPY is also forming a flag pattern, with many other indices following suit.
Note: Not financial advice.

Broadening Wedge PatternTechnical pattern for continuation spotted. We have a boarding wedge but waiting for confirmation on breakout. This would be subject to break retest and go.
Tesla should rip this summer. Good luck everyone.

LONG @ 326. SHORT @ 336. Now all that all the important levels have been exposed (333, 343, 347, 352, 355). The institutional traders can go one of two ways -
1. They become desperate and buy @333.
2. Allow the sellers to break the 333 price and buy into the sell stop liquidity below 333. (i.e. target the 326 price).
We are betting on option no. 2 because the sellers have been strong in consolidation. The fear or the pressure in the sellers is quite visible. The buyers on the other hand have been very calm and patient. I'm betting on institutions being the buyers and, the retails being the sellers.
I'm betting on the price slowly being driven lower until 326 while the institutional trader accumulate and then the price recovering a little bit to the 331-333 area.

BB + VWAP ChatGPT Strategy | With Trailing Stop LossThis strategy was generated with the help of ChatGPT. I used VWAP + Bollinger Bands for entry signals, then implemented a 10% trailing stop using Pine Script v5.
It performed well on TSLA and SPY in 4HR charts, and I’ve shared all code + visuals in this full write-up:
👉 eemanispace.com

TSLA A.M. Dump IdeaHere is a bearish imuplse at close breaking structure to the downside creating a sell opportunity if price retraces back to the arrow. Simple Idea.

Tesla - Don't get confused right here!Tesla - NASDAQ:TSLA - is about to create the bullish reversal:
(click chart above to see the in depth analysis👆🏻)
2025 has been a rough year for Tesla so far. With a drop of about -50%, Tesla is clearly breaking the average retail trader. But the underlying trend is still quite bullish and if position strategy, risk execution and mindset control are all mastered, Tesla is a quite rewarding stock.
Levels to watch: $275, $400
Keep your long term vision!
Philip (BasicTrading)

the AI YEAREveryone is focused in tesla as a car manufacturer, but will be one of the AI Kings.
Optimus will be huge.
New ATH this year!

TSLA PRICE ACTION 21st MAY 2025This is the updated price action of Tesla. I have clearly discussed the new buying levels & have also discussed why I sold it.
If you have any questions, feel free to leave a comment or DM me.
NOTE: AVOID OPTIONS IN TESLA

$Tsla will continue to go bullish after a short term pullbackNASDAQ:TSLA is in a bullish market overall speaking.
the price will probably continue to go up after this short term pullback!

TSLAAs like my other ideas, I used the reversal ascending/descending trend structure lines at high and lows..which allows for an interesting point or two to arise even if you dont see it through the clutter of chop or whatnot.
Nice group with a little hollow sun which will be interesting to watch.

Could Tesla bounce? Here's how!In this video, we look at the weekly and six hour chart of Tesla to put together a picture of when could we expect our next bounce & we even compare it to Bitcoin
