$GHSTbeen dead for a while
reclaiming the 21 ema on the weekly
not in it but close above red line could pop to red quickish
GHSTUSDT.P trade ideas

$GHST: A Surge in Volume and a Bullish Pullback - An OpportunityBINANCE:GHSTUSDT OTC:GHST 's trading volume is intensifying, the bulls are pulling hard, and the 15-minute level is currently falling back.
I believe this is a good opportunity to take over the sell orders, go long! Of course, spot trading is the safest, quick in and quick out, without any hesitation.

GHSTUSDT#GHSTUSDT
#GHSTUSDT as you can see at the chart in daily chart time-frame we are in over sold area and we have very important and strong support zone i expect the price will fly to the target at the chart RSI showing bullish MACD is showing bullish EMAs is neutral i expect there will be a correction move buy and hold it to the next targets at the chart ZELMA is showing uptrend-move Ichimoku cloud is neutral Fib retracement is showing bullish Accumulation distribution is bullish

Now make 20% profit on GHSTUSDhi every one
complete pullback to the trendline with 20% profit Potential
The information provided on this Page does not constitute investment advice, financial advice, trading advice, or any other sort of advice and you should not treat any of the website's content as such. this page does not recommend that any cryptocurrency should be bought, sold, or held by you. Do conduct your own due diligence and consult your financial advisor before making any investment decisio

GHSTUSDT#GHSTUSDT
#GHSTUSDT as you can see at the chart in daily chart time-frame we are in over sold area and we have very important and strong support zone i expect the price will fly to the target at the chart RSI showing bullish MACD is showing bullish EMAs is neutral i expect there will be a correction move buy and hold it to the next targets at the chart ZELMA is showing uptrend-move Ichimoku cloud is neutral Fib retracement is showing bullish Accumulation distribution is bullish

GhstUsdt looking Good Testing Trendline In Daily Timeframe
While Rsi Printed Massive Bulish Divergence
Incase Of Breakout Expecting 70 to 80% Bulish Move

$GHST/#USDT [#Aavegotchi]: Resistance_BreakoutHey traders, we've identified a Resistance Breakout on the $GHST / $USDT chart. The price has broken above a key resistance level, which can indicate a potential bullish trend. Taking in consideration the next resistance key levels are at 1.166 | 1.21 | 1.3 and the major support zones are respectively at 1.076 | 1.03 | 0.94. It is a bullish indication and we may consider entering at the current price zone at 1.126 and targetting higher levels.
Technical Metrics :
Current price: 1.126
24H Volume: 1,707,168.5297 ₮
24H Price change: 2.271%
- Pivot Points - Levels :
Resistance: 1.166 | 1.21 | 1.3
Support: 1.076 | 1.03 | 0.94
Indicators recommandation :
Oscillators: NEUTRAL
Moving Averages: STRONG_BUY
Technical Indicators Summary : BUY
- In-depth GHSTUSDT technical analysis on > Tradingview TA page
Welcome to the home of charting big: TradingView
Benefit from a ton of financial analysis features, instruments and data. Have a look around, and if you do choose to go with an upgraded plan, you'll get up to $30.
Discover it here

$GHST/#USDT [#Aavegotchi]: ResistanceBreakout+ConfirmationWe've detected a Resistance Breakout and Confirmation on the $GHST/$USDT chart. The price has broken above a key resistance level and has been confirmed by a strong candle, indicating a potential bullish trend. We may consider buying at the current price zone and targetting higher level.

#GHST/USDT - Long - Potential 61.59%#GHST/USDT provided by the pro trader BlockParty SPOT|USDT
Strategy: Long
Exchange: Multi-Exchange
Account: Spot
Entry mode: Market order in range
Invest: 5%
Exit:
Target 3 : 1.675 61.84%
Target 2 : 1.281 23.77%
Target 1 : 1.166 12.66%
Entry: 1.023 ⌁ 1.049
Current market price: 1.035
Stop: 0.984 (-4.93%)
Technical indicators:
24h Volume: 2074213.3166
Satoshis: 1.035
Not sure what is going on with this strange chart but looks like solid long term support / floor price from which we are seeing incremental pumps. Skewed future pivot a good first target. Given small downside so entry zone instead of DCA. Use trailing stop as pumps look short lived.
Trade: GHSTUSDT 20/12/2022 10:28
Account: SPOT
Volume last 24h: 2074213.32 USDT
Volume in buy range: 59135.42 USDT

GHST | USDTThis is my opinion about GHST I hope It will be helpful for others ..
pray for me if it was helpful ..
thanks ..
green lines is the targets for long terms
turquoise line is for med scalping
yellow line is for quick scalping
red line is the stop loss
NOT FAINICIAL ADVICE ...!!

GHSTUSDT#GHSTUSDT
(SWING TRADE)
MACD is showing bullish
EMAs showing a bullish move
RSI is bullish
targets set at the chart
We have a falling wedge pattern that's give us a signal for upward move and we have too good support zone

GHSTUSDT#GHSTUSDT
(SWING TRADE)
We have a falling wedge pattern that's give us a signal for upward move and we have too good support zone
MACD is showing bullish
EMAs showing a bullish move
RSI is bullish
targets set at the chart


Do You See What You Want to See When You Look at a Chart? Well, what do you see here? I see endless possibilities, but part of me wants to see something that is gearing up for a huge move! I That $GHST breaking out of this channel, and it's breaking out upwards! Why? Because it's low cap (134m), almost 100% in circulation, and there is a lot of room for growth.
If you are an everyday investor with humble amounts of money that you want to grow exponentially; then you need to look for this kind of setups, invest a reasonable amount, pray for an altcoin season, and persevere. That's one of the few reasonable ways to multiply your capital.
i think this is bullish above $2 and I think it has the potential for at least a $1b market cap, which is 7.4x from here. Soo, it's a good plant to seed, no?

GHST looks like it has room to go upI am in a long hoping to break a series of bad trades! $ghst $busd #ghostbusters

Incredible price lets go Dark insiderjust take it and forget it
secret coin of this market
trust me :)

$GHST losing support with BTC$GHST has been in the same trading range as $BTCUSD and now dropping support to it's way to possible $2 or lower. IF BTC runs GHST should follow.

#GHST ALERT!!!Just note my self :)
Resistence 2.50$ if it breaks
First target 2.70$
Second target 2.90$
Third target 3.40$
And go to Moon.
Stop 2.30$
Good luck.

Aavegotchi (GHST)Enter
Accompanied by price: 15-30%
(Personal archive for situation review and troubleshooting, watchlist.)

GHST/USDThello every one here we are giving you idea of ghst this is gaming coin which is so strong and metaverse but we use stop loss because btc can do every thing but stop loss can save us easily our capital and we can enter again

GHSTUSDT Spot Buy SetupGet ready for the next round. You can buy on the spot section of your exchange. We have taken a great profit from GHST last time. It is the next round. Be committed to the mentioned price. Enjoy!

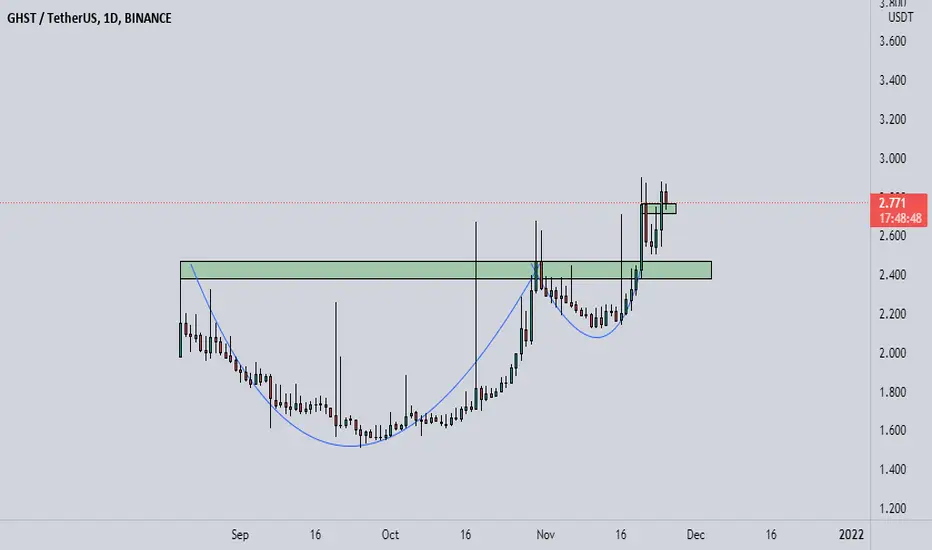
GHSTUSDT - gaming tokenPrice Has broke above this huge cup and handle formation on the daily TF currently testing previous resistance as support, send it if we hold above this zone
$GHST/USDT 12h(Binance Spot)Ascending parabolic curve on supportAavegotchi is up-trending and regained 100EMA, looking good to push higher in the coming weeks! Tomorrow it will be listed on KuCoin.
More information about that NFT metaverse that runs on the Aave protocol, also a DAO & DeFi governance token and member of Polygon Ecosystem on aavegotchi.com
Current Price: 1.933
Entry Zone:
1.923 - 1.861
Take-Profit Targets:
1) 2.129
2) 2.423
3) 2.815
Stop Targets:
1) 1.734
