GIGA: Extreme Capitulation - A Potential Major Bottom - LongToday we are looking at GIGA, which has just undergone a brutal capitulation event, wiping out the recent gains. While the bearish momentum has been fierce, such violent moves often culminate in extreme exhaustion, presenting rare opportunities for high-reward reversal trades.
This analysis will break down the compelling confluence of signals that suggest the selling pressure has reached its limit and that the current price level could be a significant, long-term bottom. We will outline the bullish case for entering a long position, targeting a powerful "V-shaped" recovery.
The Analysis: The Case for a Major Reversal
While buying into such a steep drop is inherently risky, the data suggests that the risk-to-reward profile is now heavily skewed to the upside. Here’s why:
1. CRITICAL - The Capitulation Signal (Extreme Multi-Timeframe Exhaustion):
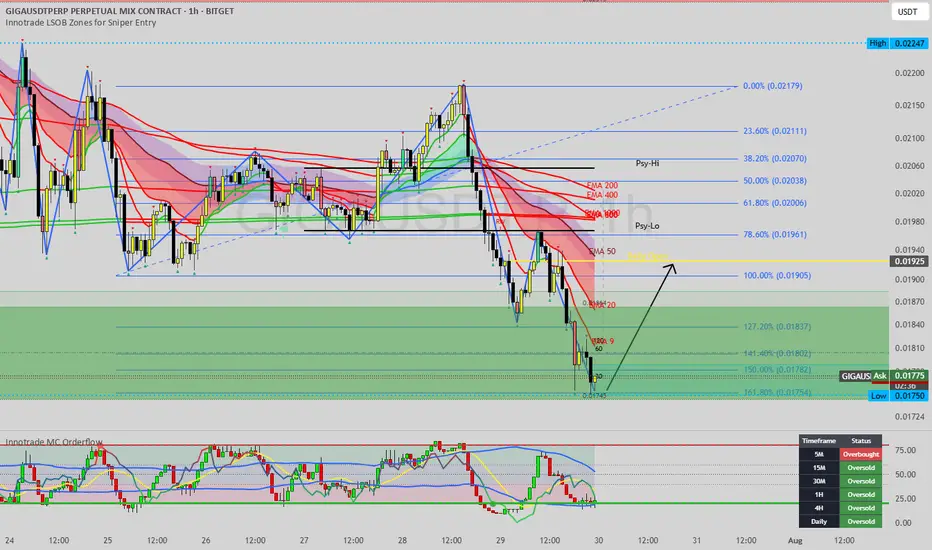
This is the single most powerful argument for a bottom. Our momentum dashboard is showing a rare and profound alignment: the 15M, 30M, 1H, 4H, and—most importantly—the Daily timeframe are all simultaneously deep in "Oversold" territory. When the daily chart becomes this oversold, it often signals a macro bottom, not just a temporary pause. This is a textbook sign of seller capitulation.
2. The Reversal Zone (Fibonacci Extension & New Demand):
Price has crashed through the 100% level and found its footing deep within the Fibonacci extension zone (127.2% - 161.8%). Historically, these deep extension levels are common termination points for corrective waves, as they represent points of maximum fear and panic. Concurrently, a new demand zone (labeled "120" / "80") is being carved out, indicating that smart money may be starting to accumulate at these depressed prices.
3. Asymmetric Risk-to-Reward:
From a trade management perspective, this setup is highly attractive. By entering near the lows, a trader can define their risk with a very tight stop loss placed just below the absolute low. The potential upside, however, is massive, with the first major target being a reclaim of the prior range. This creates a highly asymmetric opportunity where the potential reward vastly outweighs the initial risk.
The Potential Trade Plan
This is an aggressive, counter-trend trade that aims to capture the start of a new bullish impulse.
Entry Zone: The current area between $0.01750 and $0.01800 represents the point of maximum opportunity. Look for signs of a bottom forming, such as price starting to hold the lows and make small higher lows on the lower timeframes.
Stop Loss: A tight stop loss can be placed just below the absolute low, around $0.01720. A break of this low would invalidate the immediate reversal thesis.
Potential Targets:
Target 1: A reclaim of the Daily Open / 100% Fib level at $0.01925. This would be the first sign that bulls are back in control.
Target 2: A move back to the major resistance cluster and prior breakdown point around $0.02050 - $0.02100.
Target 3: A full retest of the major swing high at $0.02534.
Conclusion
While the recent price action has been bearish, the overwhelming evidence of multi-timeframe seller exhaustion, combined with the price hitting a key Fibonacci reversal zone, presents a powerful case for a major bottom. For traders with a higher risk appetite, the current levels on GIGA offer a rare, high-reward opportunity to catch the potential start of a massive recovery.
Disclaimer:
This analysis is for educational purposes only and is not financial advice. Trading involves a high level of risk, especially when attempting to trade against a strong trend. Always conduct your own thorough research and consult with a licensed financial advisor before making any trading decisions.
GIGAUSDT trade ideas

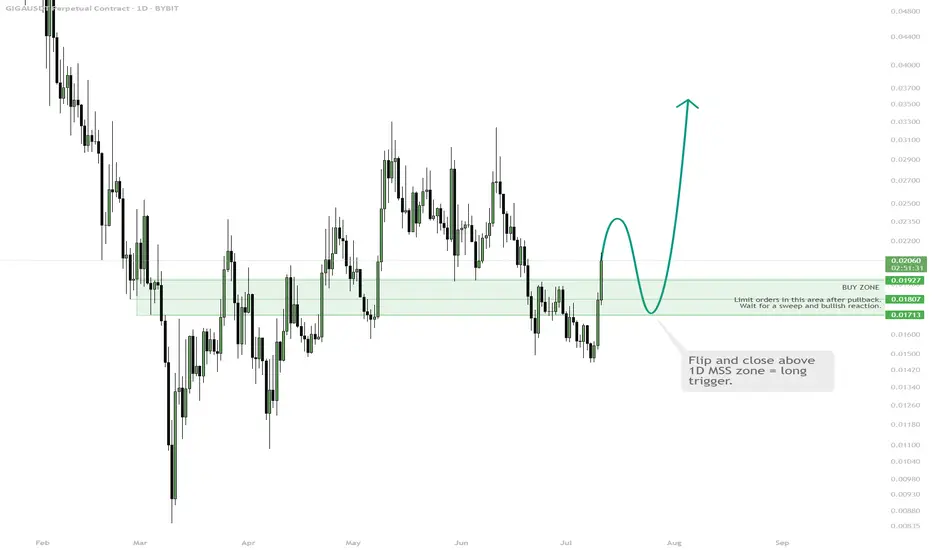
GIGA | Watch for 1D MSS Flip & Long TriggerBUY ZONE $0.0175–0.0192 — wait for pullback, enter on bullish signal.
TRIGGER: Flip and hold above 1D MSS zone.
STOP: Close below $0.0171 = exit.
TP: $0.025 / $0.03 — take profit on move up.
Wait for the break and flip above 1D MSS, then enter long on confirmation. Avoid early entry — only buy after a clear signal. Fix part of profit at resistance.
GIGA Price Slips Below Support, More Downside Ahead?BME:GIGA broke down from the rising channel, and it currently appears to be retesting.
Price is back below trendline support and the EMAs, signaling weakness.
Unless bulls reclaim the 0.020 zone, the structure favors downside continuation.
Next support? Around the 0.008–0.009 area.
We short it will SL of the daily candle high as per LTF.
Don’t fight the trend, wait for signs of strength, or stay on the sidelines.
#gigachad

GIGAUSDT: The Sleeping Giant Awakens! wait it guys
📊 Key Stats (Live Update - May 11, 2025)
- Current Price: $0.02545 (-2.19%)
- Volume: 472.36K (Low volume - accumulation phase)
📈 Critical Levels
- Strong Support: $0.025 (Today's low)
- Resistance: $0.03413 (ATH)
- Breakout Target: $0.050 (+96% potential)
🔥 Why GIGA Could Explode
1. Extreme Discount: Currently -25.4% from ATH
2. Consolidation Pattern: Forming bullish pennant on 4H chart
3. Low Float Potential: Small market cap = big move potential
🎯 Trading Plan
- Optimal Entry: $0.018-$0.020 zone
- Targets: 🚀
→ $0.030 (+20% short-term)
→ $0.034 (+34% to ATH)
→ $0.050 (+96.5% breakout)
- Risk Management:
→ Stop Loss: $0.016 (-4%) - 4H CLOSE BELOW
→ Position Size: 1-3% of portfolio
⚠️ Important Notes
1. Low liquidity - use limit orders
2. Watch for volume spikes above 1M
3. Correlate with BTC movement
💎 Unique Opportunity
GIGA presents a classic "buy low" setup with:
- Tight consolidation near support
- High volatility potential
- Clear technical levels
🔍 Key Indicators to Watch
1. RSI (4H): Currently 45 (neutral)
2. Volume: Needs confirmation above 1M
3. Order Book Depth: Check for large walls
---
📊 | Not financial advice 🖌️DYOR

GigausdtGigachad just broke a flag pattern and simultaneously completed an SHS pattern, this could lead to potential increase in price in gigachad

$GIGA GIGACHADBME:GIGA GIGACHAD (MARKET CAP $108.90M --> **$50Bil MC**)
entry PTs 0.0044 -- 0.01158 --> 12.14 = 1,070X (Timeline: End of July)
Next Target PTs 5.19-12.14 and higherrr
Returns +459X fm $108.90Mil MC-1,070X
63LfDmNb3MQ8mw9MtZ2To9bEA2M71kZUUGq5tiJxcqj9

$GIGA GIGACHAD Supernova!!!BME:GIGA GIGACHAD (MARKET CAP $144.77M --> $50Bil MC)
entry PTs 0.0065 - 0.01 - 0.014
Next Target PTs 5.19-12.14 and higherrr
Returns +345X fm $144.77Mil MC-805X
63LfDmNb3MQ8mw9MtZ2To9bEA2M71kZUUGq5tiJxcqj9

GigaUSDChannel and support/resistance for Giga. The parallel channel was drawn to show bottom and top of resistance with key support and resistance areas.

GIGA Long Swing OpportunityMarket Context:
GIGA stands out as one of the strongest meme coins, holding within a major support zone despite market fluctuations. This support area offers an attractive risk-to-reward ratio for a long swing trade.
Trade Details:
Entry Zone: $0.05 (support zone)
Take Profit Targets:
$0.071
$0.095
Stop Loss: Daily close below $0.045
This trade leverages GIGA's resilience, with profit targets set at key resistance levels. Exercise disciplined risk management! 📈

GIGA/USDT: Potential 23% Drop | Channel Breakdown |Setup:
- Short entry: Break below $0.085
- Target: $0.07 (23% downside)
- Stop: Above $0.095
- R:R = 1:2
Pattern: Channel breakdown pending
Key levels:
- Resistance: $0.095
- Support: $0.07-0.072
Watch: Channel break confirmation, volume increase
DYOR - This is not financial advice. Trade safely with proper risk management.

Best Level to BUY/HOLD GIGA 500% gains Swing Trade🔸Hello guys, today let's review 8hour price chart for GIGA. Currently pullback in progress, however price chart still looks strong with sequence of higher lows.
🔸Bullish 3 drives in progress, expecting final high at/near 30 cents, currently trading at 0.07 in wave 4 correction/pullback, expecting consolidation for 5-10 days before a push for the new ATH, get ready to scoop up low for 500% gains.
🔸Recommended strategy bulls: BUY/HOLD low at/near 0.05 in the re-accumulation range in wave 4 pullback. TP bulls is 30 cents, 500%+ gains possible in this trade.
🎁Please hit the like button and
🎁Leave a comment to support our team!
RISK DISCLAIMER:
Trading Futures , Forex, CFDs and Stocks involves a risk of loss.
Please consider carefully if such trading is appropriate for you.
Past performance is not indicative of future results.
Always limit your leverage and use tight stop loss.

GIGA/USDT Daily Chart: Rising Wedge Breakout or Breakdown?GIGA/USDT is currently trading within a rising wedge pattern on the 4-hour chart, which is typically a bearish structure. The price is at $0.07113 and appears to be nearing a breakout point. A bullish breakout could push the price toward $0.07770 or higher, potentially targeting $0.10 in the short term. However, a bearish breakdown from the wedge could lead to a retracement toward the support zone around $0.06 or even as low as $0.04, where the longer-term trendline lies.
The MACD shows mixed signals, with the histogram losing momentum, suggesting caution. Meanwhile, the Stochastic RSI is neutral, indicating room for movement in either direction. This setup requires careful observation of how the price behaves near the wedge’s apex.
In summary, GIGA/USDT is at a key decision point. A breakout above the wedge could confirm bullish momentum, while a breakdown would point to further downside. Keep an eye on these levels for confirmation.

GIGACHAD to $1 then profit takeAll the AVWAP lines drawn are curling up which usually results in bullish price action and holding those lines as support.

GIGAchad - it is worth a buy?This coin has created a head3Shoulders on its first stages...
Thsi coin also is going up despite the market conditions, which are choppy..
Like PONKE, GIGA is over performing the markets!
We have entered a second position around 0.028 and we expect to see it around 0.034 (+20)
Lets see if that is going parabolic!
Good trading!
