Moonbeam All-Time Low & Bullish Reversal—Trading 101 (PP: 1250%)GLMR (Moonbeam) has been trading at bottom prices and you know once we hit bottom, there is no other place left to go but up.
The all-time low happened in April 2025 and then we have a reversal pattern. The pattern is composed of lower highs and higher lows, the action converging and becoming compressed until finally a strong breakout happens.
We know the breakout will be bullish because of marketwide action. Ethereum (Ether) is trading at its highest price since December 2021. Bitcoin and XRP are trading at all-time highs and many of the strong projects are doing great. As the big projects grow, the smaller projects will follow. It is the natural sequence and how it always works.
GLMRUSDT has huge potential for growth as we are looking at true bottom prices. A ~1,250% target can be hit easily in the coming months. Another one around $0.66 gives 777%.
There is no need to use a stop-loss with this type of trade setup. Only one action is required here and that is to buy. After you buy, waiting comes naturally as nothing else can be done. When our target is reached; sell, collect profits and move on. Cryptocurrency Trading 101.
Namaste.
GLMRUSDT trade ideas

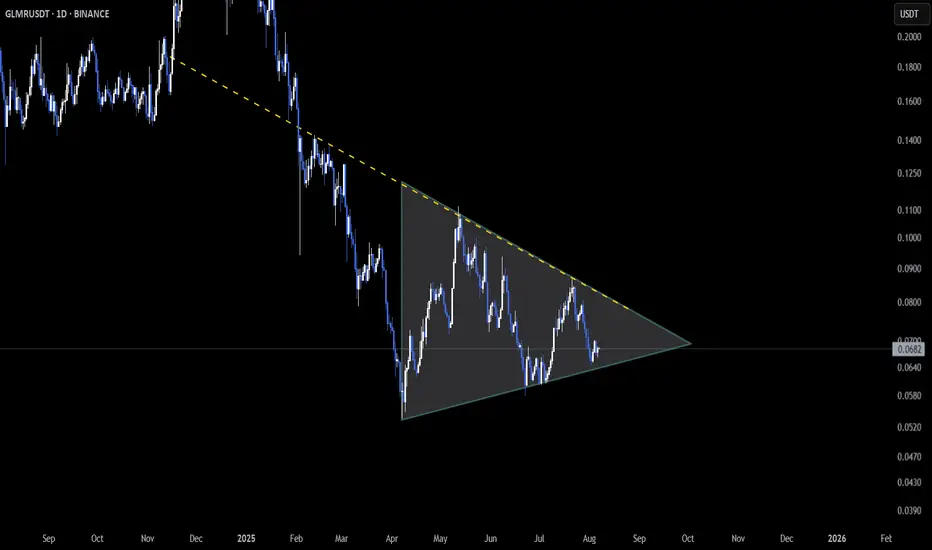
GLMR – Coiling Up for a Move!
📆 On the Daily timeframe, SEED_DONKEYDAN_MARKET_CAP:GLMR is trading inside a symmetrical triangle, with price compressing toward the apex 🔺
This kind of structure often leads to strong breakouts once momentum builds.
👀 Breakout or breakdown ahead? Stay sharp — big move incoming!
Not financial advice.
Glmr 15X soonMoonbeam
Glimmer is a token of the Moonbeam Network, Ethereum-compatible smart contracts platform on a Polkadot parachain
Everything is clear on the chart.
It's time to fly.
I wish everyone abundant profits.
Like and follow
for more.

#GLMR/USDT#GLMR
The price is moving within a descending channel on the 1-hour frame, adhering well to it, and is heading for a strong breakout and retest.
We have a bounce from the lower boundary of the descending channel. This support is at 0.0593.
We have a downtrend on the RSI indicator that is about to be broken and retested, supporting the upside.
There is a major support area in green at 0.0600, which represents a strong basis for the upside.
Don't forget a simple thing: ease and capital.
When you reach the first target, save some money and then change your stop-loss order to an entry order.
For inquiries, please leave a comment.
We have a trend to hold above the 100 Moving Average.
Entry price: 0.0634
First target: 0.0641
Second target: 0.0654
Third target: 0.0670
Don't forget a simple thing: ease and capital.
When you reach the first target, save some money and then change your stop-loss order to an entry order.
For inquiries, please leave a comment.
Thank you.

#GLMR/USDT - Buyers Are Here!#GLMR
The price is moving within a descending channel on the 1-hour frame, adhering well to it, and is heading for a strong breakout and retest.
We have a bounce from the lower boundary of the descending channel, this support at 0.0600.
We have a downtrend on the RSI indicator that is about to be broken and retested, supporting the upside.
There is a major support area in green at 0.0592, which represents a strong basis for the upside.
Don't forget a simple thing: ease and capital.
When you reach the first target, save some money and then change your stop-loss order to an entry order.
For inquiries, please leave a comment.
We have a trend to hold above the 100 Moving Average.
Entry price: 0.0615
First target: 0.0623
Second target: 0.0634
Third target: 0.0650
Don't forget a simple thing: ease and capital.
When you reach your first target, save some money and then change your stop-loss order to an entry order.
For inquiries, please leave a comment.
Thank you.

GLMRUSDTI'd like to see another sweep there then closing above the first orange line
if not i'd like to see price expanding to the second orange line then a bounce
both scenarios are for the buy
invalidation is clear

#GLMR/USDT#GLMR
The price is moving within a descending channel on the 1-hour frame, adhering well to it, and is heading towards a strong breakout and retest.
We are experiencing a rebound from the lower boundary of the descending channel. This support is at 0.0790.
We are experiencing a downtrend on the RSI indicator, which is about to break and retest, supporting the upward trend.
We are heading towards stability above the 100 Moving Average.
Entry price: 0.0800
First target: 0.0822
Second target: 0.0850
Third target: 0.0880

GLMR printing a higher low It looks like GLMR is printing a higher low here after making a higher high at 0.11 and it's presenting a good buying opportunity.
GLMRUSDT 1D#GLMR — Breakout Loading? 🚀
#GLMR is moving inside a Descending Broadening Wedge on the daily chart and is now on the verge of breaking above the wedge resistance and the daily MA50.
If a breakout confirms, watch for these bullish targets:
🎯 $0.1065
🎯 $0.1324
🎯 $0.1812
🎯 $0.2207
⚠️ Always use a tight stop-loss to manage risk and protect your capital.

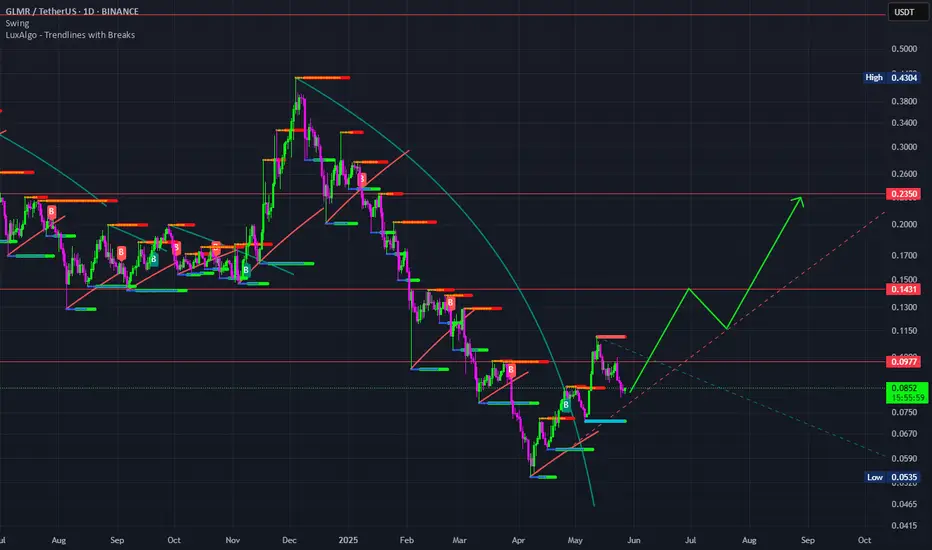
GLMR Bottomed? Watch This Key Trendline ReclaimGLMR has likely completed a full 5-wave impulsive decline, with the final leg extending after a clean deviation below the key trendline, printing a low at 0.0543. This marks a potential medium-term bottom. A corrective upside move is expected from this zone, though the broken trendline remains unreclaimed and now acts as resistance. The internal supply trendline around 0.2337 is critical — price may face strong rejection here. However, a confirmed breakout above it could open the door toward 0.757, aligning with a broader supply zone.

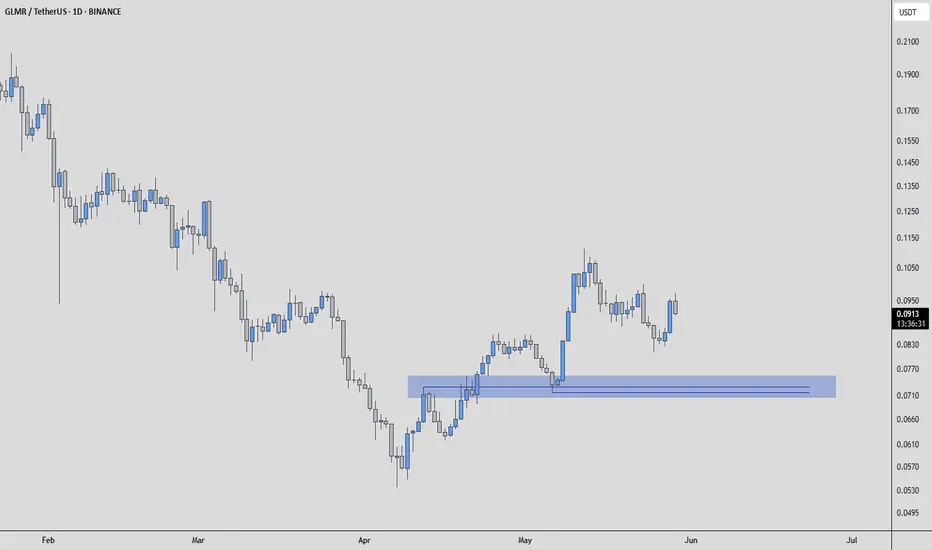
GLMRUSDT - Buyers Are Here!Observing GLMRUSDT, one identifies a notable blue box on the chart. This area, in the estimation of a discerning investor, appears to function as a significant support level.
The principle here is straightforward: when an asset's price descends to a particular zone and consistently finds buying interest, preventing further decline, that zone establishes itself as a support. This blue box suggests a concentration of demand, where those who value the asset are prepared to acquire it.
While technical patterns are not the sole determinant of value, they can illuminate where market participants are accumulating positions. A sustained defense of this blue box, particularly if accompanied by a decrease in selling pressure or an uptick in buying volume, would reinforce its significance.
Conversely, a decisive breach of such a support level would necessitate a re-evaluation, as it would indicate a shift in the balance between supply and demand. However, for the present, this blue box stands as a point of interest for those seeking to understand the potential floor for GLMRUSDT's price action.
📌I keep my charts clean and simple because I believe clarity leads to better decisions.
📌My approach is built on years of experience and a solid track record. I don’t claim to know it all but I’m confident in my ability to spot high-probability setups.
📌If you would like to learn how to use the heatmap, cumulative volume delta and volume footprint techniques that I use below to determine very accurate demand regions, you can send me a private message. I help anyone who wants it completely free of charge.
🔑I have a long list of my proven technique below:
🎯 ZENUSDT.P: Patience & Profitability | %230 Reaction from the Sniper Entry
🐶 DOGEUSDT.P: Next Move
🎨 RENDERUSDT.P: Opportunity of the Month
💎 ETHUSDT.P: Where to Retrace
🟢 BNBUSDT.P: Potential Surge
📊 BTC Dominance: Reaction Zone
🌊 WAVESUSDT.P: Demand Zone Potential
🟣 UNIUSDT.P: Long-Term Trade
🔵 XRPUSDT.P: Entry Zones
🔗 LINKUSDT.P: Follow The River
📈 BTCUSDT.P: Two Key Demand Zones
🟩 POLUSDT: Bullish Momentum
🌟 PENDLEUSDT.P: Where Opportunity Meets Precision
🔥 BTCUSDT.P: Liquidation of Highly Leveraged Longs
🌊 SOLUSDT.P: SOL's Dip - Your Opportunity
🐸 1000PEPEUSDT.P: Prime Bounce Zone Unlocked
🚀 ETHUSDT.P: Set to Explode - Don't Miss This Game Changer
🤖 IQUSDT: Smart Plan
⚡️ PONDUSDT: A Trade Not Taken Is Better Than a Losing One
💼 STMXUSDT: 2 Buying Areas
🐢 TURBOUSDT: Buy Zones and Buyer Presence
🌍 ICPUSDT.P: Massive Upside Potential | Check the Trade Update For Seeing Results
🟠 IDEXUSDT: Spot Buy Area | %26 Profit if You Trade with MSB
📌 USUALUSDT: Buyers Are Active + %70 Profit in Total
🌟 FORTHUSDT: Sniper Entry +%26 Reaction
🐳 QKCUSDT: Sniper Entry +%57 Reaction
📊 BTC.D: Retest of Key Area Highly Likely
📊 XNOUSDT %80 Reaction with a Simple Blue Box!
📊 BELUSDT Amazing %120 Reaction!
📊 Simple Red Box, Extraordinary Results
📊 TIAUSDT | Still No Buyers—Maintaining a Bearish Outlook
📊 OGNUSDT | One of Today’s Highest Volume Gainers – +32.44%
I stopped adding to the list because it's kinda tiring to add 5-10 charts in every move but you can check my profile and see that it goes on..
GLMR Short wait for good entryLike & Follow me for more details
GLMR Short,
BTC will break upward trend soon.
Will reach 103k

#GLMR/USDT#GLMR
The price is moving within a descending channel on the 1-hour frame, adhering well to it, and is heading for a strong breakout and retest.
We are seeing a bounce from the lower boundary of the descending channel, which is support at 0.0814.
We have a downtrend on the RSI indicator that is about to be broken and retested, supporting the upward trend.
We are looking for stability above the 100 Moving Average.
Entry price: 0.0860
First target: 0.0884
Second target: 0.0914
Third target: 0.0941

#GLMR/USDT#GLMR
The price is moving within a descending channel on the 1-hour frame, adhering well to it, and is heading for a strong breakout and retest.
We are seeing a bounce from the lower boundary of the descending channel, which is support at 0.0865.
We have a downtrend on the RSI indicator that is about to be broken and retested, supporting the upward trend.
We are looking for stability above the 100 Moving Average.
Entry price: 0.0891
First target: 0.0905
Second target: 0.0935
Third target: 0.0974

#GLMR/USDT#GLMR
The price is moving in a descending channel on the 1-hour frame and is adhering to it well and is heading to break it strongly upwards and retest it
We have a bounce from the lower limit of the descending channel, this support is at a price of 0.1240
We have a downtrend on the RSI indicator that is about to break and retest, which supports the rise
We have a trend to stabilize above the moving average 100
Entry price 0.1280
First target 0.1360
Second target 0.1428
Third target 0.1500

#GLMR/USDT#GLMR
The price is moving in a descending channel on the 1-hour frame and is adhering to it well and is heading to break it strongly upwards and retest it
We have a bounce from the lower limit of the descending channel, this support is at a price of 0.1130
We have a downtrend on the RSI indicator that is about to break and retest, which supports the rise
We have a trend to stabilize above the moving average 100
Entry price 0.1152
First target 0.1180
Second target 0.1212
Third target 0.1244

#GLMR/USDT#GLMR
The price is moving in a descending channel on the 1-hour frame and is adhering to it well and is heading to break it strongly upwards and retest it
We have a bounce from the lower limit of the descending channel, this support is at a price of 0.0963
We have a downtrend on the RSI indicator that is about to break and retest, which supports the rise
We have a trend to stabilize above the moving average 100
Entry price 0.0977
First target 0.0990
Second target 0.1008
Third target 0.1030

#GLMR/USDT#GLMR
The price is moving within a descending channel on the 1-hour frame and is expected to continue upward.
We have a trend to stabilize above the 100 moving average once again.
We have a downtrend on the RSI indicator that supports the upward move with a breakout.
We have a support area at the lower limit of the channel at 0.0888.
Entry price: 0.0893
First target: 0.0910
Second target: 0.0921
Third target: 0.0937

GLMR/USDT: Riding the Bull, Waiting for the Dip!🐂📉 I'm analyzing GLMR paired with USDT. 📈 While it's been in a strong bullish trend 💪, it's currently trading at a premium and looks overextended. 😬 Looking at the recent price swing, it's clear we haven't seen a significant pullback. I'm seeking a buy opportunity 💰, but not at these current levels.. I'm waiting for a retracement down to the Fibonacci 61.8% level (equilibrium) 🧘, and then looking for a bullish break in structure (BoS) after the pullback to signal a good entry point. 🎯 Everything is explained in the video. 🎬 This isn't financial advice! ⚠️
GLMR/USDT: Riding the Bull, Waiting for the Dip

GLMR Explosion or Final Trap? Yello Paradisers — are you truly ready for one of the cleanest, most deceptive setups we’ve seen on GLMR in weeks? If you’ve been following our latest insights, you already know — this is not the moment to get distracted. A decisive move is on the horizon… but the trap is also well set. The only question is: will you be the one who catches it or gets caught?
💎#GLMRUSDT has just completed a clear 5 wave rising wedge, a classic structure that often signals the end of a move and it has now pushed directly into a key resistance zone. This level has rejected price multiple times in the past (as previously marked), and unsurprisingly, price has stalled here once again.
💎The support at $0.095 is now critical. If this level holds, this current pause could easily evolve into a bullish consolidation before the next impulsive leg upward.But just below, we’re eyeing the demand zone near $0.085. If the $0.095 support breaks and price dips into this zone, we’ll be watching for signs of aggressive buying. A fast rebound here could present a golden long entry, but only if we see clear strength returning immediately after the retest.
💎To the upside, our next moderate resistance lies at $0.1313, and beyond that, the real game begins in the major supply zone between $0.145 – $0.155. That’s where smart money will likely begin distributing their positions, and you should be ready to follow.
💎However, if price breaks below $0.0709, the entire bullish structure gets invalidated. That becomes our flip level — if breached, we will turn bearish and prepare for lower lows.
Discipline, patience, robust strategies, and trading tactics are the only ways you can make it long-term in this market.
MyCryptoParadise
iFeel the success🌴

GLMRUSDT BullishGLMRUSDT – Bullish Cypher Pattern Forming | Reversal Setup 🔄🚀
Hey pattern traders 👋
GLMR (Moonbeam) is forming what looks like a textbook bullish Cypher pattern — and if this completes properly, we could be looking at a solid reversal play off key Fibonacci levels. This is the kind of setup where precision and patience pay off.
🔺 Cypher Pattern Breakdown
Let’s decode it real quick:
XA: The initial impulse leg
AB: Retraces 38.2–61.8% of XA
BC: Extends to 113–141.4% of AB
CD: Completes near 78.6% retracement of the entire XA move
If we’re completing the D-leg now, that’s where the buy zone comes in — right near the golden pocket of the move.
This isn’t just a harmonic — this is a measured, rule-based entry with a solid R:R structure baked in.
📈 Why This Matters
Cypher patterns are rare but powerful, offering reversal potential at points of max pain
Structure aligns with oversold RSI, and MACD is showing a flattening histogram — momentum might be shifting
If D completes near support, you’re looking at low-risk entries with explosive upside
🎯 Trading Plan (Example)
Entry: Near the Cypher completion zone (around 78.6% of XA)
Target 1: 38.2% retracement of CD leg
Target 2: 61.8% retracement of CD leg
Stop Loss: Below X-leg (invalidate the pattern)
This is not a hype trade — this is where pros take shots while everyone else panics at the bottom.
📌 GLMR Forming a Bullish Cypher – Reversal Could Be Near
Are you watching this pattern too? Let’s talk strategy — aggressive entry or waiting for confirmation?
#GLMRUSDT #CypherPattern #BullishSetup #CryptoTrading #HarmonicPatterns #PriceAction #AltcoinSetup #ReversalTrade #TechnicalAnalysis

#GLMR/USDT#GLMR
The price is moving within a descending channel on the 1-hour frame and is expected to continue upward.
We have a trend to stabilize above the 100 moving average once again.
We have a downtrend on the RSI indicator that supports the upward move with a breakout.
We have a support area at the lower boundary of the channel at 0.0690.
Entry price: 0.0713
First target: 0.0730
Second target: 0.0750
Third target: 0.0774

Glmrusdt Trading opportunityGLMRusdt presents an intriguing opportunity, showcasing signs of reaching a potential bottom and preparing for a bullish reversal. Two prominent bullish setups, the descending broadening wedge and the strong Inverse Head and Shoulder (IsHs) pattern, have been identified.
The final setup target aligns with the immediate target level of the wedge pattern, while the immediate setup target corresponds to the IsHs setup. These formations suggest potential upward movements for GLMRusdt.
Highlighted on the chart are crucial demand zones, pivotal for accumulation purposes. These zones serve as strategic areas for potential entry and accumulation of positions.
To accommodate market fluctuations, it's advisable to employ a wider stop-loss strategy, allowing for flexibility in volatile conditions.
Boosting this analysis and contributing your comments is appreciated to foster insightful discussions.
