GLMR SOON 50% UP???Glmr had small break of strcuture on 1h timeframe.
I call it small because it barely broke it, I will buy(Long) when it comes to demand zone drawn on chart.
Buy are would be bewteen 3.88-3.65
You can go for safer tp at 4.4 and make good 15%
You can make profit bigger by using levraeg. Since this 15% is notbad I wouldnt recommend using higher than 4 x leverage.
Set up tp at 4.4 and sl below this demand zone.
NOT FINANCIAL ADVICE,JUST SHARING MY OPINION!!!
GLMRUSDT trade ideas

Glmr/usdt symmetrical triangle H/S ideawhat we have here is a winning trade. i planned on buying at the lower trendline.
I did not open the trade based on what bitcoin. we all know btc is the driver of the show.
when btc dips 3% altcoins dip15%. so yes i had fear of losing money, a trait that needs to be eradicated when putting on a trade.
kill all fear doubt and uncertainty. Moving along...
now we have a new idea in motion. with the breakout of the symmetrical triangle.
The strategy here is buy the BCR (BREAKOUT,CLOSE,RETEST). WE Buy the re test of the breakout of the symm triangle.
good luck and i plan on posting more set ups...

GLMR inverse H&S#GLMR/USDT
$GLMR broke out from neck line of inverse head and shoulders pattern.
🐮 price can increase as high as head to reach $5

Glimmer looking bullishGlimmer has a inverse h/s. should see $5 again if we can break to the upside. it has been holding the 50 ma on the 12 pretty nicely.

GlmrusdtGlmrusdt is located in a resistance area 4.3$, if it break the 4.3$, according to the pattern it has formed, the first target is 5$.
We can buy from 4.2$ to 4.33$
Tp1 5$
Tp2 5.5$
ST3.64$

GLMRUSDTHEY GUYS what do you think about this pair? I think it Has the potential to grow to higher prices in the mid-term


GLMR currency analysisIn the 3.6$- 4$ range, it has good support, buying in this range can be very low risk.
If the number of followers reaches 100 this week, I will put pure analysis every day.
Follow fractal_analysis98

GLMR daily broke bullish out of triangle GLMR daily chart...never seen this asset before.
It seems its brand new, and the last 2 days broke
out of the traingle and is holding support at the 50 day.
next move up would be $4.20 , and then
$4.51 and $5.10....RSI is still trnding upward.
Stoch RSI is curling bullish as well.

after testing support line will bounceAfter testing, support line will bump on it for a double B and will run for 30%

GLMR: ROAD OPEN TO THE TARGETSHELLO GUYS
-Yesterday, it rebounded from the middle of the channel towards the top, but it was in front of a solid crossover, the crossover of the EMA50 line, the BOLLINGER mid-line and below the MA7 line, and the momentum may not help it to breach.
-Today, however, it has penetrated, although the momentum is weak, but it has some strength that may grow with the passage of daylight hours.
-Now the way is open to reach the TARGETS.

Tight compress, sturdy explodeOn 1H TF
BINANCE:GLMRUSDT has been happening the correction wave. It's nearly done with support at 3.4, perhaps.
And we also have a invalidation level below 3.0; that level is very important.
Right now, GLMR is moving up to 4.5 before it can break to further.
GLMR might be at 7.0 and further at 10.8. Both level are a golden ratio of impulse wave at 3.4
Wait and see

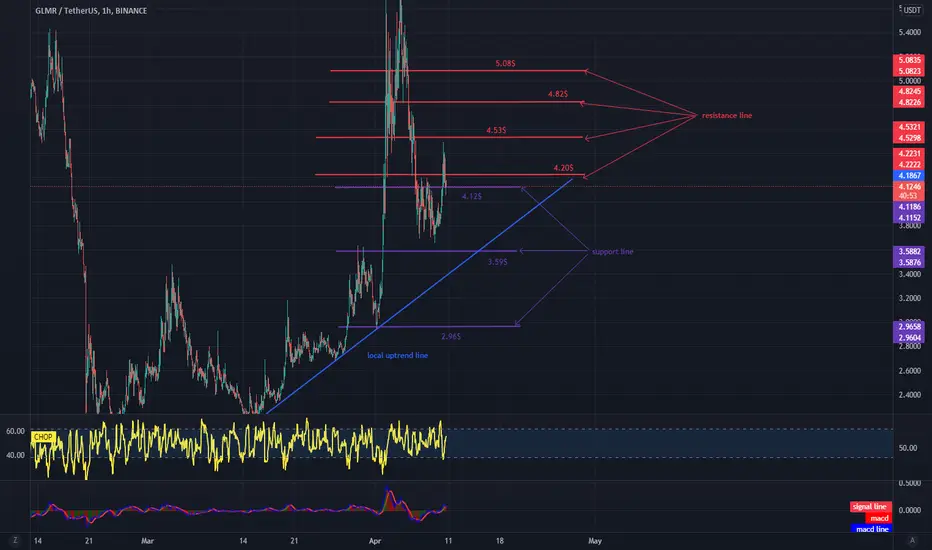
GLMR based on support.Hello everyone, let's take a look at charting the GLMR to USDT in 1 hour. As you can see, price is moving above the local uptrend line.
Let's start with the line of support and as you can see the first support where the price is currently at is $ 4.12, if the support breaks down, the next is $ 3.59 and $ 2.96.
Now let's move from the resistance line as you can see, the first resistance is $ 4.20, if you can break it, the next resistance is $ 4.53, the next resistance is $ 4.82 and the next one is $ 5.08.
It is worth paying attention to the CHOP indicator, which shows that within 1 hour we have a lot of energy for the next move.
GLMR.Usdt (Y22.P1.E5). Knowing when to buy the dipGLMR.Usdt (Y22.P1.E5). Knowing when to buy the dip
Hi All,
This is a continuation of 2 previous posts on #GLMR #MOONBEAM, and as you can see, I have been doing well with some of these calls.
As I stated in the others, I'm looking for long term gains, potentially years to holding and prospering with this project.
There isn't enough evidence that this is a descending wedge and hence this is only a guess or feeling at this point.
Anyway, there are some clues as to the strategy and if you pay attention for those who are students of TA, you will pick up some pointers.
Please give me a like and a share.
All the best,
S.Sari
==================================================================================
WARNING: This could be easily be a breakout trap and like BTC and pullback for a shakeout so have your SL tight.
BTC chart below.
=================================================================================
PREVIOUS POST\s

GLMR/USDT Bullish Cup & Handle Pattern if breaks then 200% TP#GLMR/USDT TA Update:-
$GLMR currently trading at $4.21
Currently forming Cup & Handle Pattern in Daily Time frame.
Handle Already broke out.
Big Breakout Point = $5.70
Best Entry:- $4.00-$3.80
Breakout Entry :- $5.70
Targets:- $5.7 ( First Entry Target)
Other Targets:- $9/$16/$50
Stop Loss:- $3.70
Red Box = Breakout Point

GLMR.Usdt (Y22.P1.E4).Wyckoff works
Hi All,
#Wyckoff Method #GLMR #GLIMMER #MOONBEAM
If you followed my posts, even better our group, you would have made some gains with this.
Just wanted to share how accurate this Bottom reversal was aligned to one of Wyckoff accumulation model.
Previous posts below.
Please like and share,
All the best,
S.SAri
strong resistance level
1.618

GLMRUSDT LONG PODITION the price after 6 weeks trading between 1.8 and 3.4 now the price heading to mention level

MOONBEAM (GLMR) toward 4usd targetglmr creating interesting structure which can have potential reversal zone around 4usd.
Technical analyze showing potential AB=CD pattern...we will see if glmr gonna break previous high,,,if so....then next target will be quick push towards 4usd...there is unfilled gap and above this gap there are lot of untested high which mean liquidity for big players....
lets see

GLMR broke a daily resistance with a huge volumeTarget 1 : 5.42
Target 2 : 6.74
I'll stop in case of a bearish daily close under 4.6

Possible move Market is on a bullish momentum, due to my analysis the market is might experience one more bullish movement before going into correction


GLMR.Usdt (Y22.P1.E1).Looking to go longHi All,
Moonbeam or Glimmer is one of those projects I entered in the public crowdloan offering.
I'm currently staking it for that 30% given earlier this year.
Looking to buy more, especially if we are going to have another ALT season or Bullrun in 2022 or 2023 which some data suggests, from a certain perspective. Obviously all speculative.
Refer to my live stream for what I think this is likely to be. Having said that, one must look at the chart and look to invest at the right time, and hopefully we get that > x1000 or more returns in the coming years.
One suggestion is layer in, for getting the bottom will be difficult.
With the chart, I have aligned my fibonacci to what makes sense to me and what formations are probable, all dependent on bigger players in the market.
We could have a reversal triangle bottom or wedge in the making, for now, we are waiting on the macd cross over to confirm the small time frame.
I do see crypto go up today, based on a few indicators I talked about on my live stream, here on my profile.
All the best,
S.SAri

GLMR.Usdt (Y22.P1.E3).Reversal in progressHi All,
Just using the Wyckoff chart to align it with our current scenario.
We could have one more dip, just like BTC as well which could compete the cycle or Elliot triangle ABCDE reversal formation.
#GLMR #Moonbearm
All the best,
S.SAri
