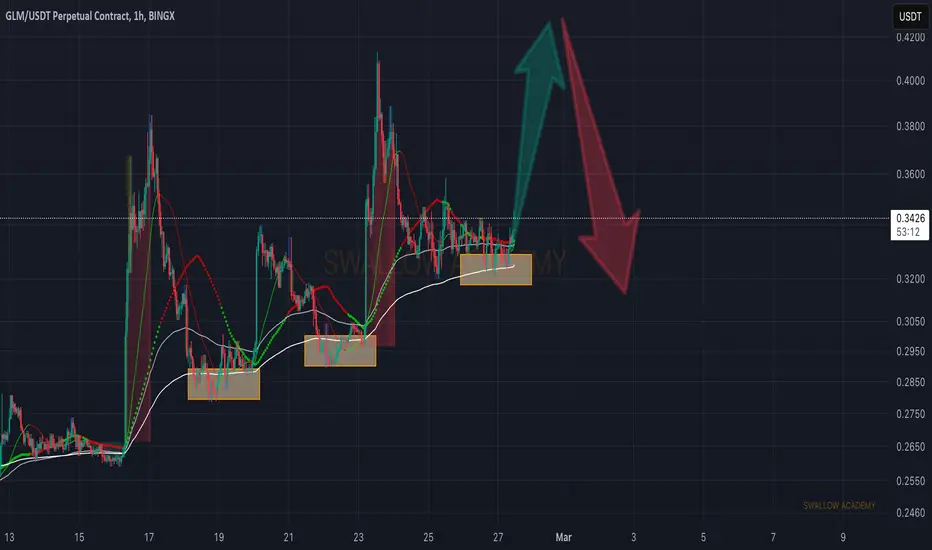
Golem (GLM): Possible Huge Pump Incoming!Golem coin has a similar pattern of touching the 200EMA mark before entering the weekend markets and then forming a huge CME gap; we might see just another one here.
Now if we see any confidence breakdowns lower than 200EMA, this idea will be invalid but the pattern seems to repeat itself so we might see yet another push and then a dump!
Swallow Team
GLMUSDT trade ideas
Maybe around $0.22This requires a new energy to attack the high levels. Perhaps this energy is obtained by touching downtrend of falling wedge (around 0.22)

GLM / USDT : Breaking out from Trendline resistance GLM/USDT: Breaking Out from Trendline Resistance – A Bullish Move Incoming?
GLM/USDT is making a strong move 📈 as it successfully breaks above a key trendline resistance zone 📊. After a period of tight consolidation, the breakout signals a potential bullish rally 💥. If the momentum sustains, we could see further upside in the coming days 🚀. Keep an eye on this pair and watch for confirmation signals before entering a trade.
Key Insights:
1️⃣ Trendline Breakout: GLM/USDT has finally broken above a long-standing trendline resistance, a key bullish signal. If this breakout holds, it could lead to a strong upward trend.
2️⃣ Volume Surge: A noticeable increase in trading volume is supporting this breakout, confirming strong buyer interest 🔥.
3️⃣ Bullish Indicators: RSI and MACD are showing strength ⚡, indicating bullish momentum could continue.
How to Confirm the Breakout:
✅ Look for a 4H or daily candle closing above the trendline for confirmation.
✅ A spike in volume during the breakout can signal strong buying pressure 📊.
✅ A successful retest of the broken resistance as new support adds further confidence.
⚠️ Be cautious of fake breakouts—watch for sharp reversals or wicks above the trendline.
Risk Management Strategies:
🔒 Use stop-loss orders to manage risk.
🎯 Ensure proper position sizing to align with your overall strategy.
This analysis is for educational purposes only and not financial advice. Always DYOR before making any trading decisions 🔍.

GLM/USDT THE BEST COIN FOR 270% POWER ATH INCREASEGLM/USDT IS THE BEST COIN FOR 270% POWER ATH INCREASE
There are more coins on the coinmarketcap, GLM l looks depending on our study the best coin for 270% BREAK And new ATH listing 2025
There is a high volume from KRW, and already 2 whales first entries made.
Let's see what the time can bring.

GET GLM/USDT BEFORE 1$ Unexpected whale increase NEW ATHThere is a High chance GLM will see in the coming time after the $0,48 a whale increase to 1 USD.
WE will follow the cycle trend to see if this gain will be a reality.

GLM/USDT INCREASE BY VOLUMWGLM/USDT INCREASE BY VOLUME
Interesting follow to see if its able to break

$GLM ANALYSIS! CSE:GLM is testing the red resistance zone 🟥. If it breaks out, the target is the green line level 🟩.

GLMTUSDT SHORT IDEAIf we happen to close below 0.3216 which is the standard deviation range point, I will place a short position aiming to tp at the untapped fvg below.
GL

GLMUSDT CHART ANALYSİS- EDUCATİONAL POSTThe Man Who Solved the Market. How Jim Simons Launched the Quant Revolution by Gregory Zuckerman (Penguin Random House)
When customer reviews on Amazon about a book on a quant trader begin by quoting phrases in Latin, you're probably onto something interesting. In his New York Times bestseller, The Man Who Solved the Market, award-winning Wall Street Journal writer Gregory Zuckerman explores "the unbelievable story of a secretive mathematician who pioneered the era of the algorithm—and made $23 billion doing it."
An extraordinary mathematician, former code-breaker for the United States government, and founder of the world's most successful financial firm (Renaissance Technologies), Simmons has an unsurpassed record of investment success, having trumped the likes of Warren Buffet and George Soros, among many others. With his data-driven approach to algorithmic investing, he has realized annual returns of 39% over three decades (!).
If you're interested at all in algorithmic investing (and we're assuming that you are since you're reading this article), then this is an excellent diversion from the usual books on the subject.

GLMUSDT(Golem) Updated till 16-02-25GLMUSDT(Golem) Daily timeframe range. finally we can see some move here. almost reached close to 0.4504. now if it can get a valid close above 0.3355 it can revisit there again. local low and support still at 0.2323.

GLUSDT 50%-77% Gains – Bullish Momentum Set to Surge!GLUSDT has recently broken out of a Falling Wedge Pattern, a technical formation that typically signals the end of a downtrend and the potential for significant price action upward. The Falling Wedge is characterized by converging trendlines, with the price action tightening as buyers and sellers reach an equilibrium before one side gains control. With a solid breakout now in play, GLUSDT is poised for a strong bullish move. The volume accompanying the breakout is good, indicating strong market participation and confirming that the move has the potential to continue. Traders are anticipating gains ranging from 50% to 77%+ as the price continues to push higher, potentially testing key resistance levels.
The breakout from the Falling Wedge pattern is a key event for GLUSDT, and with good volume supporting this move, it increases the likelihood that the price will continue its upward trajectory. Falling Wedges typically indicate that buying pressure is starting to build, and once the resistance level is cleared, the price often experiences a surge. The breakout has already set the stage for a potential rally, and traders are now looking for confirmation of the next resistance levels to determine how far the price might go. With strong technical backing and good investor interest, GLUSDT is well-positioned for substantial price gains in the near term.
Investors are taking increasing interest in GLUSDT, as the breakout from the Falling Wedge marks a key shift in sentiment. The good volume confirms that this pattern is not a false breakout, and with many traders eyeing the potential for higher returns, this project is gaining momentum. As the market shifts from a bearish to a bullish outlook, GLUSDT could see a sharp rise, testing higher price levels and delivering the anticipated 50% to 77%+ gains. The rising interest and positive market sentiment around GLUSDT further solidify its status as a potential high-reward opportunity.
Traders should closely monitor key support and resistance levels as the price action unfolds. If GLUSDT can maintain its momentum and push through further resistance, the rally could extend toward the projected gain levels. As always, it’s important to track volume and market conditions to confirm the strength of the breakout. With the current setup and positive technical indicators, GLUSDT is one of the more promising crypto pairs to watch for potential substantial gains.

GLM/USDT- BUY SETUPBINANCE:GLMUSDT
✔︎ENTRY : 0.3606
🏓TARGETS :
✔︎T1 : 0.4046
✔︎T2 : 0.4447
✘STOP : 0.3394
💡Reason for this trade:
This trade gives my trading system a sign of strength:
• My trading system is based on liquidity and reversal zones.
• When the liquidity is swept from one side under certain conditions, we will wait for the price on the other side.
The liquidity will attract the price like a magnet.
• the first side that has been swept:
1- range deviation
2- range volume profile POC
• Opposite side targets:
1- liqudity void
2- range high
💡Entry setup
1- reclaim range POC+ IFVG
⚠️WARNING:
• I'm not a financial advisor.
• Do your own research (DYOR).

GLM Buy setup (1D)It appears that GLM has entered a triangle formation at the point marked by the red arrow on the chart. Currently, it seems to be at the end of wave D.
A buy position can be considered at the green zone during wave E.
Closing a daily candle below the invalidation level will invalidate this analysis.
For risk management, please don't forget stop loss and capital management
Comment if you have any questions
Thank You

GLMGLM-USDT
Buy entry from the current price with a fraction 🟢 and if any correction occurs, we support from prices 0.49770 - 0.47670
Objectives:
$0.7870
$1.1700
Stop loss:
$0.4450

#GLM/USDT#GLM
The price has broken the descending channel on the 1-day frame upwards and is expected to continue.
We have a trend to stabilize above the 100 moving average again.
We have an upward trend on the RSI indicator that supports the rise by breaking it upwards.
We have a support area at the lower limit of the channel at a price of 0.2400.
Entry price 0.3000.
First target 0.3746.
Second target 0.4413.
Third target 0.5090.

Trading Signal: GLMUSDT - SellDirection: Sell
Enter Price: 0.3446
Take Profit: 0.31283333
Stop Loss: 0.37693333
Dear traders,
We have identified a potential selling opportunity for the GLMUSDT currency pair. Based on the EASY Quantum Ai strategy, several key factors suggest a bearish movement that aligns with the setup of this trade. Here are the reasons:
1. Technical Indicators: Recent analysis of moving averages and MACD indicate a downward trend. The exponential moving averages are converging in a bearish crossover, suggesting further downside potential.
2. Resistance Levels: The enter price is set at 0.3446, strategically placed near a significant resistance level. This imposes a cap on the upward movement, making it an opportune point to enter a sell position.
3. Market Sentiment: Currently, market sentiment around GLMUSDT appears to be weak amid broader market uncertainties. Investors are leaning towards risk-averse assets, further pressing down the currency pair.
4. Volume Trends: A declining volume trend suggests diminishing bullish momentum, reinforcing the likelihood of a downtrend continuation.
Take action with consideration of the risk levels outlined by the stop loss at 0.37693333. Ensure to monitor market developments that may affect GLMUSDT and adjust your strategy accordingly.
Happy trading!

GLMUSDT LONG IDEAhi all, glmusdt in 1hour timeframe still bullish. in 5min timeframe rsi has positive mismatch. so i will try long setup
entry : 0.3265
stop : 0.3100
target : 0.3774

Perfect example of breakout and retestGLM what a chart
Perfect example of breakout and retest. Longed some here for the culture

Long GLMUSDTGLMUSDT making a series od higher highs and higher lows, if we put entry at these points we can make a good profits

Prime Opportunity: Golem (#GLMUSDT) Major Bullish Move!I’m excited to share a trade setup for my favorite coin at the moment: Golem (#GLMUSDT).
Both the GLMUSDT and GLMBTC pairs are showing extremely bullish potential, and the price action is aligning perfectly with our trading strategy.
Key Points:
*Elliott Wave Pattern: The current chart reveals a compelling Elliott Wave pattern. Notably, wave 5 hasn't commenced yet, presenting an excellent buying opportunity, especially with the recent completion of the ABC correction.
*Perfect Pullback: This recent pullback is exactly what I've been waiting for. It marks the end of the correction phase and the beginning of a potential new upward movement.
Trade Setup:
*Entry Triggered: Today, my trade setup was triggered, offering a solid 1:3 risk/reward ratio. The current setup is highly favorable for entering a long position, capitalizing on the anticipated wave 5.
Conclusion:
Bullish Outlook: The bullish sentiment for Golem is strong, and this setup provides a promising opportunity for substantial gains. If you follow this trade, you might be thanking me later.
Happy trading!

GLM best buying opportunity...You can buy GLM on spot, as much as you can. It has formed a higher low that will remain unbroken in the future. I am expecting a 3-4x return from it in the mid-term.

#GLM/USDT#GLM
The price is moving in a 12-hour bearish channel, is very committed to it, and has just broken through it
We have a green support area at .5000 that is expected to be bounced from due to its strength
We have a trend to hold above the Moving Average 100, which is strong support for the rise
We have very strong oversold resistance on the RSI indicator to support the rise with a strong downtrend
Entry price: 5600
First target 6248
The second target is 0.6690
The third goal 0.7283

GLMUSDT 8HBuy some #GLM around its supports. It has formed a symmetrical triangle on the 8H timeframe. Targets are:
$0.7502
$0.8718
$1.0264
$1.1071
Supports are:
$0.5206
$0.4376
