Trade Signal: GMTBTC – Buy RecommendationDear Traders,
We have a potential trading opportunity for the GMTBTC pair with a recommended action to Buy . Below are the trade details based on the current analysis:
Enter Price: 0.00000176
Take Profit: 0.00000177
Stop Loss: 0.00000174
This recommendation is derived using the EASY
Related coins

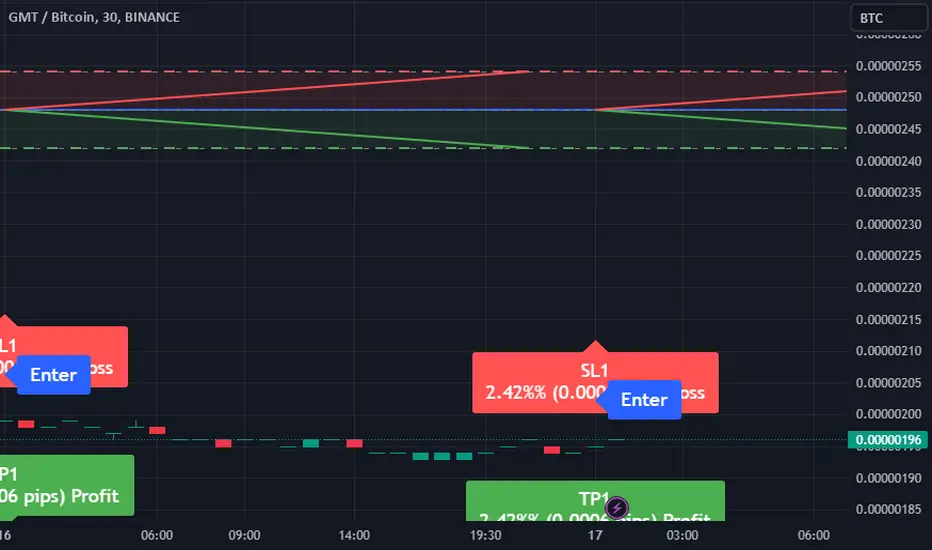
Trade Signal for GMTBTC: Sell AlertAttention traders, we have an update on GMTBTC with specific trade parameters. Our analysis, generated using the EASY Quantum Ai strategy, indicates a timely opportunity for action.
Direction: Sell
Enter Price: 2.48E-06
Take Profit: 2.42E-06
Stop Loss: 2.54E-06
Rationale for Predi
GMT time to riseGMTBTC in week timeframe has an double bottom at the mid line of the down trend channel,, so if BTC wont fall , price of GMT will rise soon


STEPN (GMT) formed bullish Shark for upto 122% rallyHi dear friends, hope you are well and welcome to the new trade setup of STEPN ( GMT )
Previously we caught a nice pump of GMT as below:
Now on a weekly time frame, GMT with BTC pair has formed a bullish Shark move for another price reversal.
Note: Above idea is for educational purpose only.

#GMTBTC - Long - Potential 49.78%T/USDT#GMTBTC provided by the pro trader BlockParty SPOT | BTC
Strategy: Long
Exchange: Multi-Exchange
Account: Spot
Entry mode: DCA Limit
Invest: 7.1%
Exit:
• ⎿ Target 5 : 3594 100%
• ⎿ Target 4 : 2695 49.97%
• ⎿ Target 3 : 2156 19.98%
• ⎿ Target 2 : 1976 9.96%
• ⎿ Target 1 : 1886 4.95%
DCA En

GMTBTCA wave is expected to close in the form of three internal waves, as it is supposed to rise from the current areas to the shaded area

STEPN vs Bitcoin | Early Signals (67% To 116% Possible Next!) I always wonder... How will they react?
In the past I used to share only Bitcoin pairs (ALTSBTC) and people would always ask for the Tether pairs (ALTSUSDT).
Now I am doing both but focusing mainly on the USDT pairs.
Once things start picking up speed I'll be back to mainly ALTSBTC.
----
Here we


$GMT/BTC 12h (#BinanceSpot) Descending channel breakoutGreenMetaverseToken is pulling back to 50MA support where it seems likely to bounce and resume bullish.
Current Price=0.00004525
Buy Entry= 0.00004405 - 0.00003909
Take Profit= 0.00005585 | 0.00006754 | 0.00008183
Stop Loss= 0.00003318
Risk/Reward= 1:1.7 | 1:3.1 | 1:4.8
Expected Profit= +34.35% |

See all ideas
Summarizing what the indicators are suggesting.
Oscillators
Neutral
SellBuy
Strong sellStrong buy
Strong sellSellNeutralBuyStrong buy
Oscillators
Neutral
SellBuy
Strong sellStrong buy
Strong sellSellNeutralBuyStrong buy
Summary
Neutral
SellBuy
Strong sellStrong buy
Strong sellSellNeutralBuyStrong buy
Summary
Neutral
SellBuy
Strong sellStrong buy
Strong sellSellNeutralBuyStrong buy
Summary
Neutral
SellBuy
Strong sellStrong buy
Strong sellSellNeutralBuyStrong buy
Moving Averages
Neutral
SellBuy
Strong sellStrong buy
Strong sellSellNeutralBuyStrong buy
Moving Averages
Neutral
SellBuy
Strong sellStrong buy
Strong sellSellNeutralBuyStrong buy
Displays a symbol's price movements over previous years to identify recurring trends.