Stepn; What Awaits GMT?Hello Traders! CTDave here again with another daily price analysis chart.
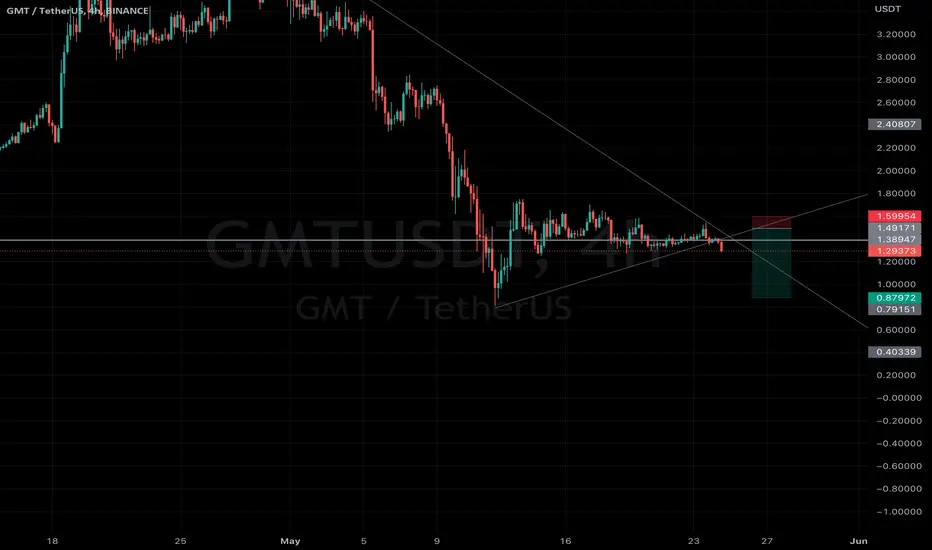
Today I will be analyzing Stepn BINANCE:GMTUSDT . This is a coin that has been one of the best performers recently. As you all probably know, GMT has suffered a great crash recently and you might be hoping for a retracement.
There has been a breakout triangle forming so there are two different outcomes that can happen. The first one, indicated by the thick red arrow, shows a breakout to the upside before going down, and the second outcome, indicated by the green arrow, goes directly down. You can see the areas of support and resistance where the price may reverse or retrace.
Thanks for reading!
As always, I encourage everyone to please like, comment, and share my ideas, and follow me for more of these posts to be kept updated. Happy trading! Thank you!
Note: I am not a financial advisor, please do not trade solely based on my trading decisions. Do your own research or consult a professional financial advisor before conducting a trade.
GMTUSDT trade ideas

Even if everyone loses We will keep winning ✅futures signal
gmt-usdt
leverage :x 5
position : short
enter point :1.37 $
exit point : 0.9176 $
profit :172 % done
congratulations to our team

GMT is Scam coin!!!!!!!!!!!!GMT Price Prediction: Is STEPN Legit Or A Scam?
Abdullah Sarwar·Cryptocurrencies·May 25, 2022, 16:02 BST
Our GMT price prediction is not looking great as the price has failed to generate any reversal signals. On 12th May 2022, Green Metaverse Token (GMT) dipped to the lows of $0.81, shedding most of its gains from the last month. A relief rally took the GMT coin to the $1.49 level, from where it faced another rejection.
Green Metaverse Token (GMT) is the native asset of the STEPN app. The app leverages NFTs for its novel move-to-earn platform. The protocol is built on Solana and allows the users to monetize their workouts like running, jogging and walking. At the time of writing, GMT price is trading at $1.38, which is 66% below its all-time high of $4.11.


Jaywise InternationalBMS..COCH..OB then set your TP and SL...
Making use of any strategy you see playing out
Make use of SMC
Maker use of Indicators
Make use of chart patterns

GMT has more to dumpGMT of the daily timeframe at pretty much critical support with prior solid bearish candle. Losing the support down below will likely test the further downwards level of support.

Will we see GMT pump after yesterday China's STEPN dump - YES !Hello TradingView community and my subscribers, please if you like ideas do not forget to support it with your like and comment, thank you so much and we will start.
Today I want talk with you about GMT chart.
I know some if you heard about stepn, some use it to make money and some think that this is scam and soon all will lose money.
I think that stepn is not a scam, but yesterday we saw that stepn will no more work in China after 15 July and flow dropped very hard.
But I want to write few words by technical picture.
I think now price trades in accumulation in range 1.70-0.80 USD.
As you can see on a history chart 2 previous times after accumulation we saw huge upward impulse.
I think this time price can do the same and I can indicate 3 main targets.
Target 1 is 2.05 USD
Target 2 is 3.05 USD
Target 3 is 4.05 USD
So, I'm waiting for this scenario.
This is my opinion, I really hope this will be useful for you.
Be ready and take care your money. Have a great profit !

Strong demand zoneGMT is not trading in a very strong demand zone and there is also a potential double bottom in 1d time frame, a good r/r ratio for long. not a financial advice, proceed with your own risk and don't forget to set a stop-loss, seemingly we are still in a bear market.

GMTUSDT Wyckoff Theory 👀👀?This is my first post 😅 and I did post the same chart but I think it's been removed So GMTUSDT is showing a movement I just spotted on the 4h candle ! Let's hope it follows this.
GMT has shown great price action, but lately it fell slightly.
It's creating a chart similar to the Wyckoff Theory, if you compare my GMTUSDT chart I've shared with you and compare with the Wyckoff Theory, if you Google the theory they look very similar and I hope it follows this theory and if it does we can go higher then $4 in the next few weeks and months! 👀🤞🏼🤞🏼
Please feel free if you want to withdraw what you invested and let the rest run or take out what you happy with or hold long term, please make this decision yourself and I am just a guide and educational purposes 😃👍🏼

GMT BREAKOUT WITH RISING OPEN INTERESTJust a quick idea of the kind of trades I like to take. I have a strategy system implemented in python that basically what it does is scanning the market to look for the following (example using Binance Futures):
1- Price moves in a tight range for some time (hours) with rising open interest and low volume.
2- Then, the price breakouts (up or down) with increasing open interest and abnormal volume. We want to see the price breaking out with conviction, and to spend time outside of the consolidation range (it can be from 5 hours to several days)
3- Then, we can now presume that the majority of the long positions that have entered in the range are potential trapped longs and the shorts where right. The majority of the shorts that have entered in that range will also defend their position and longs might close in BE if the price returns to that zone.
So we know take an step forward and put our limit buy/sell order (limit sell if the breakout was to the down and limit buy if the breakout was upside move). We want to enter in the direction of the trend. We are not guaranteed the trade will take place, of course. But we have the probabilities to win in our favor.
If the price for some reason returns back to the initial point where the first move took place most probably it will be hardly rejected again in the direction of the initial breakout.
Important notes:
- This kind of trade require to take at least a Risk Reward Ratio of 2, 2.5 or more. If your RRR is near 1 (risk 1 to won 1) the strategy is not as profitable.
- Real breakouts takes time to form. So please, do not look for this in 5 minute time-frames. Please use at least 1H candles or more.
- The open interest for each ticker can be also added to the same chart in a new price scale. If you are seeing the ticker 'BTCUSDTPERP' (Binance Futures) the open interest will be 'BTCUSDTPERP_OI'.
If you liked it, please like and comment.
Happy Trading!
Rodrigo

GMTUSTPERPWell I think this might be the downfall for GMT after the developers have been arrested for running ponzi.
Maybe the FUD is still hanging somewhere who knows???!!
So I might be risking a short here as SM TRADER. Might play out or it might not, well LIFE is full of risk.

GMT/USDT Short? #Signal @everyone Looks like GMT/USDT has finally decided to start its leg down (possibly in part due to app maintenance delays)
Regardless $2.90 area looking pretty certain
$2.05 - $2.10 wouldn't be surprising
Below that support is right down around $0.85 - $1.15,
cant see it going that low unless some project development issues arise but there is always a chance.
Trade safe guys and girls remember money management :)

✅GMT: will the Axie pattern repeat or GMT is a SCAM?Hi friends!
As we all know the 👟GMT fall close to the $1 key level because of 2 main reasons:
1️⃣ a lot of game tockens were minted. Green Satoshi Token (GST) is a gaming token of Stepn APP:
🔶GST supply on May 21 was 3.58M.
🔶GST supply is 52.9M now .
The supply increased by 1477%, which is a lot and led to a fall in the price of Stepn itself.
2️⃣ China start blocking the Stepn app on July 15. This happen due to the regulation of cryptocurrencies in the country. Naturally, this caused panic among the Chinese, massive sales and collapsed the price of the cryptocurrency by 26%. Recall that the Chinese are the main part of players in the app.
Axie and Stepn have fallen similarly after Bitcoin's fall, but will GMT repeat the AXS pattern of 2021? It would be ideal to wait for a similar trend line and open a long on a breakout. After the 80% drop, when reatail is scared and squeezed under the trend line, it would be possible to open a similar to AXS long.
📊Let's compare this two games:
1. There are actually a lot of people playing in Axie Infinity. There's a developed ecosystem, it's more than a few years old, the game is constantly evolving.
2. GMT looks like a pyramid scheme and it might scam at any time.
Friends, if you want to trade, please use the stop losses, because this is the main thing in trading that allow you to be succesfull for a long long time.
If GMT repeats the AXIE pattern, I will be posting trading setups in new updates and ideas, so stay tuned!
💻Press the "like"👍 button, write comments and share with your friends - it will be the best THANK YOU.
P.S. Personally, I open an entry if the price shows it according to my strategy.
Always do your analysis before making a trade.

GMTUSDT - SETUPGMTUSDT price hit the Support zone at 0.80$ and gained an aggressive Volume and the price sustained after a few hours. Now as the price shows momentum the first hurdle will be at 1.30$ which is the strongest one. If we see a surge of volume there, it could definitely have the potential to touch 2.50$ and 3.0$.

GMT correction fundamentally and technically ❌🧨Based on the chart, the price loses the support area and the vital round number of $1 besides we have fundamental sign for the project ✔️
we
expect to see more correction from here or from our upper resistances located on the chart ❌🧨
Please, feel free to share your point of view, write it in the comments below, thanks 🐋

GMT (stepn project) go long in 15 min Future: 10 x cross margin
Tp 1 : sooon
Tp 2 : today 😂
Hunt guys 👌🏿

GMTUSDT LONGGMTUSDT will go long and hit all this target am using 5 minutes time frame
Tp 1 : 0.86851
Tp 2:0.93599
Tp3:1.1040716


GMT at 15m intervalHello everyone, let's take a look at the GMT to USDT chart on the 15 minute time frame.
As you can see, the price is moving below the local downtrend line.
Let's start by determining the stop loss we have in the near future:
SL1 - 0.807 $$
SL2 - $ 0.208
Now let's move on to the targets we can consider:
T1 - $ 0.998
T2 - $ 1,103
T3 - $ 1,188
T4 - $ 1,272
T5 - $ 1,389
Looking at the CHOP indicator, we can see that in the 15-minute interval most of the energy has been used.

🔥 GMT Pump & Dump: Relief Rally Coming?GMT has been on a lot of inventors' minds during March and April, where it was one of the top gainers week by week on Binance.
However, now that the market has turned sour yet again, it's becoming apparent that GMT was just a Pump & Dump.
In my view, GMT has much more downside from here, think 50%. There's a lot of volatility for this token, so a relief rally will come at some point which will potentially cause a 100%-200% move. My bet is that we first have to fall all the way below $0.45 before something like that can happen.
Keep an eye on this token in the coming days, something's coming!

short GMTThis is the next shit coin to be dumped massively as there their use cases is
How can people be walking to earn real money?
GMT brief range 💡📖Based on the chart, the price has stuck in the parallel channel for a while
We expect to see range market for the price 🐋📖
Please, feel free to share your point of view, write it in the comments below, thanks 🐋

