GMT - Scalping short ideaWe can take short since coin made false breakout and it's logical to expect continuation of the movement. Be aware about btc strip.
⭐️ BTC bearish
⭐️ Trend is bearish
⭐️ Volume at top
⭐️ 3rd touch
⭐️ Base is ready
⭐️ 105 ATR
Will enter when price squeezes to the level on lower timeframes, the base will form and the strip will get faster.
Fix profit by parts:
3% - 1/3
6% - 1/3, stoploss to breakeven
What's left, hold to the maximum
What do you think of this idea? What is your opinion? Share it in the comments📄🖌
If you like the idea, please give it a like. This is the best "Thank you!" for the author 😊
P.S. Always do your own analysis before a trade. Put a stop loss. Fix profit in parts. Withdraw profits in fiat and reward yourself and your loved ones
GMTUSDT trade ideas

GMT possible trendBTC will soon hit its support around 30k and will rebound back. So there is a great chance of GMT also rebounding from this support. But GMT is facing its resistance which it had failed repeatedly. GMT might fail again this time. Let's see.
This is not a financial advice.

GMTUSDT - 1Dsee and watch :)
The $ 2 to $ 2.20 range is a good support range and if this range is broken it will be very bad and we will most likely see a heavy dump that will lower the price to the range of 70 to 80 cents ... If this is supported Range We will probably see an upward movement up to the range of $ 3 ...


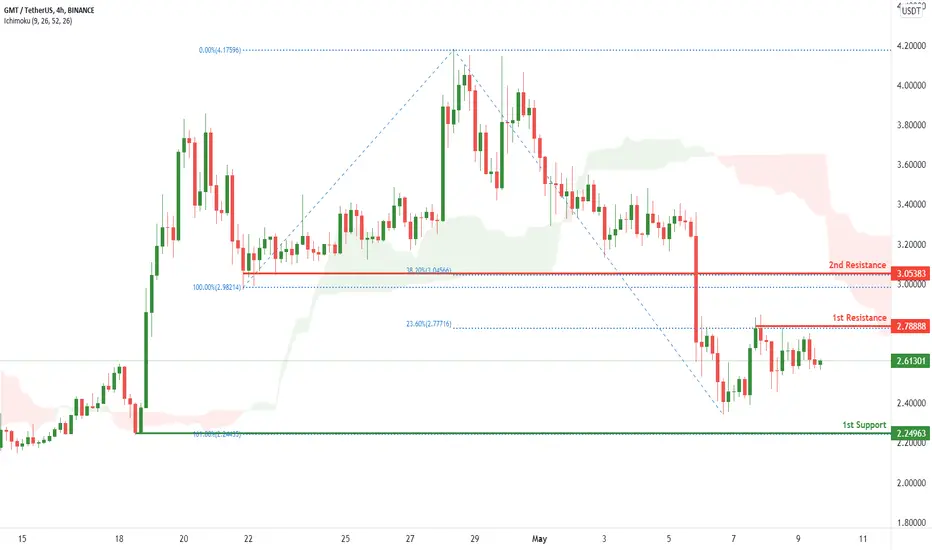
GMTUSDT potential for a drop! | 9th May 2022On the H4, with price expected to reverse off the ichimoku cloud resistance, we have a bearish bias that price will drop from our 1st resistance at 2.77392 where the horizontal swing high resistance and 23.6% Fibonacci retracement is to our 1st support at 2.24956 in line with the 161.8% Fibonacci extension . Alternatively, price may break 1st resistance structure and head for 2nd resistance at 3.05192 where the 38.2% Fibonacci retracement and horizontal pullback resistance is.
Any opinions, news, research, analyses, prices, other information, or links to third-party sites contained on this website are provided on an "as-is" basis, as general market commentary, and do not constitute investment advice. The market commentary has not been prepared in accordance with legal requirements designed to promote the independence of investment research, and it is therefore not subject to any prohibition on dealing ahead of dissemination. Although this commentary is not produced by an independent source, FXCM takes all sufficient steps to eliminate or prevent any conflicts of interest arising out of the production and dissemination of this communication. The employees of FXCM commit to acting in the clients' best interests and represent their views without misleading, deceiving, or otherwise impairing the clients' ability to make informed investment decisions. For more information about the FXCM's internal organizational and administrative arrangements for the prevention of conflicts, please refer to the Firms' Managing Conflicts Policy. Please ensure that you read and understand our Full Disclaimer and Liability provision concerning the foregoing Information, which can be accessed on the website.


GMT brief correction ❌🧨Based on the chart, the price has stuck in the channel for a while ✔️
we
expect to see brief correction at least to our channel support ❌🧨
Please, feel free to ask your question, write it in the comments below, and I will answer.🐋


GMTUSDT potential for a drop! | 9th May 2022On the H4, with price expected to reverse off the ichimoku cloud resistance, we have a bearish bias that price will drop from our 1st resistance at 2.77392 where the horizontal swing high resistance and 23.6% Fibonacci retracement is to our 1st support at 2.24956 in line with the 161.8% Fibonacci extension. Alternatively, price may break 1st resistance structure and head for 2nd resistance at 3.05192 where the 38.2% Fibonacci retracement and horizontal pullback resistance is.
Any opinions, news, research, analyses, prices, other information, or links to third-party sites contained on this website are provided on an "as-is" basis, as general market commentary, and do not constitute investment advice. The market commentary has not been prepared in accordance with legal requirements designed to promote the independence of investment research, and it is therefore not subject to any prohibition on dealing ahead of dissemination. Although this commentary is not produced by an independent source, FXCM takes all sufficient steps to eliminate or prevent any conflicts of interest arising out of the production and dissemination of this communication. The employees of FXCM commit to acting in the clients' best interests and represent their views without misleading, deceiving, or otherwise impairing the clients' ability to make informed investment decisions. For more information about the FXCM's internal organizational and administrative arrangements for the prevention of conflicts, please refer to the Firms' Managing Conflicts Policy. Please ensure that you read and understand our Full Disclaimer and Liability provision concerning the foregoing Information, which can be accessed on the website.
GMTUSDTmy opinion ; falling till 2$ ..then will increase like always and suddenly till 5.2$ ..time to buy now in each falls..and of next week reaches %150

$GMT RISING WEDGE (D)Another Rising Wedge pattern.
IMO i think if it break out of the wedge i will short and have a tight stop loss. With the BEAR MARKET i think GMT can go down but no clue high low. Rather risk a small loss to be able to capture a bigger move than sit on the sideline.... happened to me on WAVES at its peak so lets just see how it plays out
NON FINANCIAL ADVICE - journaling your trades
QoverQ

Gmt-usdtif breake ..
.
This Analysis will be updated ...
⚠️(DYOR)
If you apperciate my work , Please like and comment , It Keeps me motivated to do better

GMT possible Elliott Wave TriangleWatching these converging trendlines. If it gets a break below would be a nice anchor for the count and complete a possible impulse. For me an ideal move for clarity would be a move down to the PTT but triangles can be tricky.

GMT/USDT - buy ur shoes before it doubleAs u see its in the bottom of the channel with double bottom setup so a trade with 1:2.4 is availble.

GMT WITH A SHORT BULL RUNGMT may pull up a bit from here.
This season is a bloody one, hence you have to trade with care.
Share your opinion


GMT updateAs I already said, a rising wedge is forming for GMT in addition to a symmetrical triangle drawn in the red lines

StepN | UpdateUpdate to my initial analysis on $GMT.
TLDR;
*GMT + GST Losing strength due to trickle down effect in the M2E category.
ie. people taking profits and rolling into other M2E projects to maximize profit potential on their "steps".
*General market strength has persons diversifying out to other tokens/ people taking profit.
*A question of sustainability. Can $GMT continue this rapid growth in this current market?
--------------------------------------------------
Current short term price action is displaying one of my favorite momentum patterns where price rides a Moving Average onto support or resistance and then eventually breaks the level with volume; more or less known as an ascending or descending triangle.
Diagram to the left shows exactly how these usually play out. (This specific diagram is a reverse of the same pattern on 4/24).
For a short term trade/ momentum following, this seems to be an okay area to go short with a tight stop above recent highs and also the 21EMA.
There is potential for price to fall back to previous ATHs and also the 100MA and find support. In addition to the above, its also possible that price have an even bigger pullback to fill some price inefficiencies.
Refer to the posts linked below as I will be updating them as well, as time goes on. The linked video goes into detail on an intraday chart about the short term trend change on GMT & GST, which is the beginning of this current pattern.

GMT predictionsOn the GMT hourly chart, the rising wedge is still in play. We haven't seen a break of the support yet.
When the price breaks the support, its target will be 15% bellow the breaking line.

GMTUSDTHello Crypto Lovers,
Mars Signals team wishes you high profits.
This is a 4-hour-time frame analysis for GMTUSDT
It is clear that the price is fluctuating in the middle of the channel. It is expected to move to the first support line. If it moves upward, it is able to break the first resistance line and even move to the second resistance line.
Warning: This is just a suggestion and we do not guarantee profits. We advise you analyze the chart before opening any position.
Wish you luck

Bye bye Bull, welcome bearmost coins and tokens dumb hard. the same goes for GMT.
short term, it might re-test the green dash line. But overall
is sideway downward to < 0.9


GMT Price Target of the CorrectionI think GMT is heading to the $2.10 strong support from which it can consolidate before showing some strenght once again.
Looking forward to read your opinion about it.
