Swing setup for GMX - Safe 50% profitReally not liking this coin, but a trade is a trade. Think this is a pretty safe setup, so basically we should see a push towards 40$ coming weeks, which would be a nice 50% profit.
Opened a small long here at current levels :)
Stay safe!
GMXUSDT trade ideas

GMX is starting to move.. GMX is bullish today
We have some buy signals with an uptrend
This coin was been sleeping until now..
My brother has it and he was upset that it doesnt move :))
Take Care !

GMXUSDT is BullishPrice is consistently printing higher highs and higher lows, after bullish divergence appeared on 1H time frame. According to Dow theory, HH's and HL's are classic signs of bullish rally, hence new highs are expected. Targets are mentioned on the chart.

GMXUSDT (Bullish)Harmonic Pattern Completion: If the pattern completes, the price might rise towards the D point, which is typically at the 88.6% retracement of XA.
Fibonacci Support: The 61.8% Fibonacci level (27.63) is a strong support zone, suggesting a possible reversal from this point.
Elliott Wave Theory: The corrective wave (ABC) aligns with the harmonic pattern, adding confluence to the analysis.
-The analysis suggests a potential bullish reversal from the current level (around 27.68), aiming towards the D point of the harmonic pattern. However, keep an eye on key support levels and validate the pattern completion with price action before making any trading decisions. Always consider using stop-loss orders to manage risk.

GMXUSDTmy entry on this trade idea is taken from a point of interest ABOVE an inducement.. I extended my stoploss area to cover for the whole swing as price can target the liquidity there before going as i anticipate.. just a trade idea, not financial advise

GMX Triple Bottom?GMX is a Decentralized Perpetual Exchange. I use it, and as the old adage says: "Buy What You Use".
gmx.io
Yes the SEC is suing Uniswap and probably other decentralized exchanges. The last time I checked, the SEC doesn't have jurisdication over the world and is only protecting Americans from scams like FTX and buying Bitcoin under $300 when the first ETF was proposed.
The thesis for GMX:
A utility token where holders will get fees from traders using the exchange.
If we do have a long-term bear market, GMX will allow people to short or hedge their positions.
Technicals:
- All Time Low was hit yesterday.
- Triple bottom.
Stop loss: weekly close below $23.

GMX LONG SETUP ALL trading ideas have entry point + stop loss + take profit + Risk level.
hello Traders, here is the full analysis for this pair, let me know in the comment section below if you have any questions, the entry will be taken only if all rules of the strategies will be satisfied. I suggest you keep this pair on your watchlist and see if the rules of your strategy are satisfied. Please also refer to the Important Risk Notice linked below.
Disclaimer


GMX cycle rotationRotations are great. Cycles repeat.
Im watching and waiting for bull divs to form on my nami indicator momentum waves with clear signals.
I do believe GMX is a solid project and will rotate back up.
Im looking to paper trade long because i simply do this for fun. wink.
Not
Financial
Advice
Ever

SHORT #GMXUSDTSHORT #GMXUSDT from $39.39
4h TF. Attention! A signal to test the level confirmed by several touches. The volumes are falling. The seller is active. The instrument removed liquidity from 59.95. According to the law of reverse liquidity. Namely, the price will tend to the level of the beginning of the impulse that launched this movement. At the breakdown, be ready!! To the stake. If everything goes smoothly, the goal is 36.18. We close the imbalance with abnormal volumes.
GMXUSDT DailyHi Dear Friends
based on Waves theory I think a good opportunity on this chart, please let me know what you think!!!
Best regards!

GMX---Bullish $100+Hello guys, CryptoGao with another trade analysis:
I am expecting GMX to start pumping any time soon, theres a clear inverse head n shoulder pattern that seems that wants to break to the upside. It will retest the resistance line and then break above to ATH according to the pattern.

Gmx longGmx is about to have a run. Going on a 10x leverage. Take profits at your best fib level. like and comment for more free signals.
#diplomats💪🏻

📈GMX: Support and Short Opportunities🔒🔍Today the market is taking a breather, and the analysis focuses on the coin GMX, which has broken the line at $54.01 from our previous analysis, triggering a 23% short position. Currently, it's testing support at $44.24, having faked out once and reacted twice.
✅If you opened a short position at $54.01 and haven't taken profit yet, I suggest closing a small portion to secure some gains. If you've taken profit, wait to see how it reacts at $44.24. If it breaks down, expect lower targets; if it holds, consider closing your position to lock in profits.
📉If you don't have an open position, the next trigger is $44.24, which could accompany the next wave. Currently, volume has decreased compared to before, typical for weekends.
⚡️The RSI indicator lacks a precise trigger, but considering the downward momentum on the 4-hour timeframe, opening a position could be warranted. If the price continues to range for an extended period, assess new market structures before opening positions.
🔑Note that all downward movements are corrective, and any coin could pump at any moment. If you have confirmation, you can consider longing after the breakout of $48.02.
🧠💼It's important to acknowledge the inherent risks in futures trading, with the potential for margin calls if risk management is neglected. Always adhere to strict capital management principles and utilize stop-loss orders, ensuring that the initial target offers a risk-to-reward ratio of 2

📈Weekly Analysis: Bullish Signals for MANA🔥🔍Today is Sunday, marking the end of the week and typically low trading volume. Hence, we'll analyze the weekly timeframe for Mana against USD for potential insights. On this timeframe, Mana has reached a supply zone, evidenced by a bearish engulfing candle. However, the current candle is showing signs of buyer strength.
📈If this candle closes bullish, we can consider a pullback to the level of $0.5517, supported by the 7-period Simple Moving Average (SMA). Additionally, Fibonacci retracement levels indicate that we've reached the 1 extension point, suggesting a consolidation phase. For higher targets, $1.0989 could be considered, overlapping with the 1.414 extension.
📊Volume is decreasing during this correction, signaling a healthy trend. The Relative Strength Index (RSI) previously faked an overbought condition and could potentially surge upwards again.
🛒Buying on the confirmation of the current candle closing bullish seems opportune.
🧠💼Just remember, jumping into trades too quickly before the main trigger can be risky. Always manage your money wisely and be aware of the risks involved.

GMXUSDT Buy opportunityThe GMXUSDT trading pair is displaying initial stages of an Elliott Wave formation, characterized by leading diagonal structures, with the completion of the Wave 1 to Wave 2 sequence.
The price is currently forming a robust bullish continuation pattern, identified as an Inverse Head and Shoulders (IH&S), with the pattern's price target indicated on the chart.
Additionally, the projection for the culmination of the current Wave 3 is also delineated. The designated accumulation zone on the chart represents an opportune area for initiating long positions.
As always, it is prudent to engage in trading with due diligence, implementing a suitable stop-loss strategy to manage risk effectively.
We welcome your engagement with our analysis in the form of comments and likes.

GMX/USDT getting ready for potential shift? 👀 🚀 GMX Analysis💎Paradisers, prepare for an engaging trading opportunity as #GMXUSDT shows signs of an upcoming pivotal move. The market dynamics indicate a strong push from a crucial demand level at $58.88, with the price aiming to breach a significant supply zone. Our strategy hinges on confirming this transition from supply to demand before making our move.
💎Targets Post-Breakout:Upon successfully navigating past the current supply level, our sights are set on the next target at $64.55. Surpassing this will open the door to approach a higher supply threshold at $71.89. It's essential to tread carefully, as the market may present psychological traps during these transitions. A solid strategy backed by clear confirmation is crucial for moving forward.
💎Preparing for Volatility:The unpredictable nature of the market necessitates readiness for diverse outcomes. Should #GMX retreat below the $58.88 support, a bullish resurgence from the $54.10 support level might be our next focal point. A fall below this marker signals a need to recalibrate our approach, potentially considering short positions to align with the prevailing market sentiment.
💎Strategic Market Navigation:Embracing all potential market scenarios is what makes us proficient traders. By keeping a vigilant eye on market movements and maintaining a patient and strategic approach, we can navigate through market uncertainties effectively. Rest assured, the Paradise Team is here to support and guide you through every twist and turn of this thrilling trading venture!

GMX Decentralized Perpetual ExchangeThe Current market of GMX is 529 million.
This feel criminally too small.
I link the Long Setup Here.

GMX/USDT upward trajectory?👀 🚀GMX Today analysis💎 Paradisers, turn your attention to #GMXUSDT as we gear up for a potential bullish shift. It's currently challenging a key resistance, hinting at a possible change in direction.
💎 #GMX is on the brink of breaking through its resistance at $49.89. If it manages to push past this level and keep up the momentum, there's a high chance we'll see it embark on a bullish journey, aiming for higher resistance levels. For now, we're expecting a slight pullback to the demand zone.
💎 There's a possibility that #GMX may not maintain the momentum needed to break out initially. Should this happen, a period of downward consolidation might occur before it tests our defined support level at $45.85 again. A successful retest of this level could pave the way for a substantial upward move.

📈GMX Futures: Potential Long Opportunities🚀🔍In the 4-hour timeframe, GMX exhibits a clear ascending trendline providing consistent support, yet to be breached. It once faked out the trendline, followed by higher lows, demonstrating resilience and breaking the resistance at 59.2 with conviction.
📈Following the break, two significant red candles with substantial volume are observed, serving as potential pullbacks. Should the current candle engulf the previous one, it presents a favorable opportunity to enter a long position in futures. Aim for a risk-to-reward ratio of at least 2, ensuring the use of stop-loss orders to mitigate potential losses.
💎For those waiting on the sidelines, patience until the trigger at 64.35 is advisable before considering entry.
✅The target for long positions, apart from the risk-to-reward ratio of 2, could be set at 71.66, although current price levels may pose a challenge for immediate attainment.
📉In the event of a reversal at 59.2, a more aggressive entry could be considered at 57.52 in lower timeframes. However, exercise caution and promptly secure profits to avoid substantial losses.
🐢For a more conservative approach, waiting for confirmation at 54.01 before considering short positions is prudent.
🧠💼It's important to acknowledge the inherent risks in futures trading, with the potential for margin calls if risk management is neglected. Always adhere to strict capital management principles and utilize stop-loss orders, ensuring that the initial target offers a risk-to-reward ratio of 2.

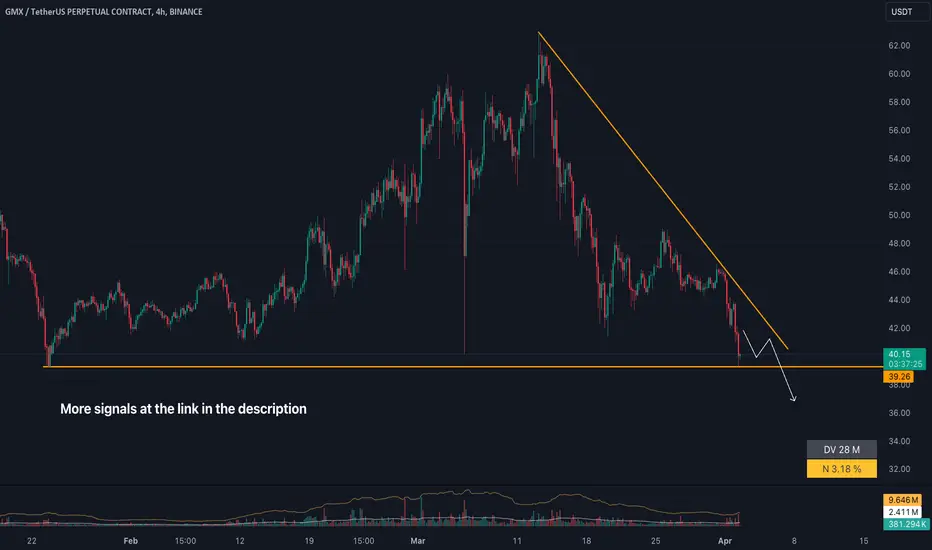
GMXUSDT Faces Retest of Weekly Resistance: Breakout or RejectionGMXUSDT is poised for a retest of a critical resistance level on the weekly chart at $59.3517. This resistance zone has been tested seven times on the daily chart, with the last two attempts accompanied by decent buying pressure.
Technical Analysis:
Resistance: $59.3517 (Weekly)
Support: $40.1870
Volume: Increased buying pressure on recent touches of resistance
Key Observations:
GMXUSDT is approaching a crucial resistance level on the weekly chart. A breakout above this level could signal further upward momentum.
The repeated tests on the daily chart, particularly with the recent buying pressure, suggest a potential upcoming breakout.
If the price manages to overcome the resistance, the next resistance level on the daily chart is $71.745.
Conversely, if the price fails to break above resistance, it could find support at $40.1870.
Conclusion:
The upcoming price action for GMXUSDT hinges on its ability to overcome the key weekly resistance level. A successful breakout could lead to a surge towards $71.745, while a rejection might trigger a pullback towards the $40.1870 support zone.
This information is for educational purposes only and should not be considered financial advice. Please conduct your own research before making any investment decisions.

GMX is going up after the pullbackGMX is going up after the pullback
🔵Entry Zone 54.75 - 57.19
🔴SL 50.74
🟢TP1 62.09
🟢TP2 72.10
🟢TP3 89.48
Risk Warning
Trading Forex, CFDs, Crypto, Futures, and Stocks involve a risk of loss. Please consider carefully if such trading is appropriate for you. Past performance is not indicative of future results.
If you liked our ideas, please support us with your likes 👍 and comments.

GMX has broken above the channelGMX has broken above the channel, after the pullback it will continue the trend
🔵Entry Zone 53.44 - 55.45
🔴SL 50.33
🟢TP1 59.28
🟢TP2 66.84
🟢TP3 74.88
Risk Warning
Trading Forex, CFDs, Crypto, Futures, and Stocks involve a risk of loss. Please consider carefully if such trading is appropriate for you. Past performance is not indicative of future results.
If you liked our ideas, please support us with your likes 👍 and comments.
