GMXUSDT.PInternal structure trading. Pretty riskier but patterns repeat itself. Taking a buy from an order block below the inducement, extending my stoploss to the swing low and taking profits on the targeted structure.
JUST A TRADE IDEA, NOT FINANCIAL ADVICE!
GMXUSDT trade ideas

GMX is bearish in this bullish marketAfter completing wave E of the big triangle above, which I marked with a red arrow, we have entered a large pattern consisting of wave A and B.
Wave A is a diametric wave and wave B is a triangle, and now we are in the last wave of the triangle. I expect wave C to start a downward spiral soon.
For risk management, please don't forget stop loss and capital management
When we reach the first target, save some profit and then change the stop to entry
Comment if you have any questions
Thank You

short GMXTSX:GMX broke through the support level and the ascending trendline. Decline to support level at $30 is expected to happen.

GMXUSDT Highly touted exchange on low fees l2 arb
High revenue each q during bear market so likelihood is that continues into the bull 2024

#GMX/USDT is testing the Trendline and PWL resistance level in 4#GMX/USDT is testing the Trendline and PWL resistance level in 4-Hour TF!
TSX:GMX needs to reclaim it as a support to gain bullish momentum. In case of rejection, we can short it.

GMX USDT By HesamUNT ( New update )hey traders
we got the rejection from daily and Weekly Swap and broke down the short and mid-term Demand zones
also we had potential demand zone at daily TF around 39-43 $ and PA confirmed this lvl so many times
Now we break it down and price still playing below this zone
so i can take it as a potential Swap and resistance area in next touches and working as a supply zone in higher TF Chart. also this Swap confirmed by Long-term short scenario fib EXT and EMA 200, EMA 50-200 still bearish in Weekly Daily 4H TF, but we have bullcross in 30m and 1H TF
thats why we can expect some buy pressure around 30$ to the 39$ which is our Supply zone and swap and fib areaa
what u think ?
share ur chart and leave a comment

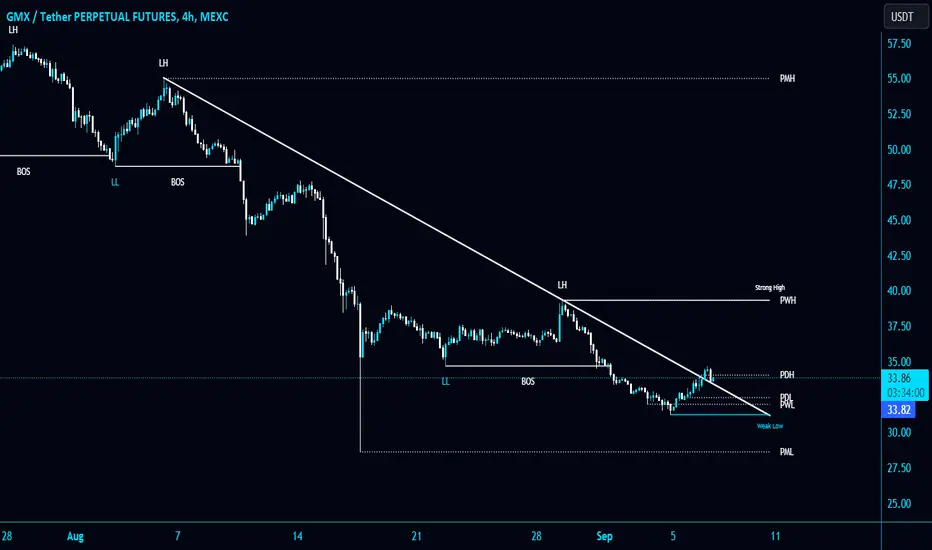
GMXUSDT-IN BEARISH TRENDGMXUSDT.P is in a bearish trend price made a double top with bearish divergence and the price is now starting to make a series of LLs and LHs, bear can push the price towards our target easily, what do you guys think about this? let me know.

GMXUSDT⛔"Daily crypto market analyses I provide are personal opinions & not financial advice. Trading carries risks, so do your own research & seek advisor's help.#DYOR"
Don't forget to like and comment

GMX Bearish Pattern 🤔↘️🤔↗️🤔↘️Hi dear traders
GMX has formed bearish pattern.
Possible price return to support area for small correction and then rise and breakout falling wedge in daily time frame.
Let's see what happens
This is not financial advice ( DYOR )
Good luck

GMXUSDT - Trade SetupThe initial trade suggests a long position on GMXUSDT with an entry range between 31.53 and 32.30. For risk management, set your stop loss at approximately 6% to 8% of the trade value. The risk-to-reward ratio for this trade is 1:5, making it potentially profitable. However, it's important to monitor smaller timeframes for continued higher highs, as the 1-day timeframe currently shows a bearish trend. Your target for taking profit should be around 45.

GMX 1d is bullish but keep in mind... GMX is bullish on the 1d and 3d charts
It will be bullish once it closes 1d above $36.23.
But keep in mind if it closes below the red line, then you have two scenarios
1. It touches the last support then it rebounds
Or
2. It goes to the assigned area for the harmonic pattern
All the best insha Allah!

GMX Buy Limit 😎✅😎✅😎✅Hi dear traders
The price retest resistance area act as support.
Now we can open long position and take some profit 📈 in short term.
Let's see what happens
This is not financial advice ( DYOR )
Good luck

🔥 GMX Falling Wedge Continued: Reversal InboundAs of a few days ago, GMX has successfully bounced from the bottom support of the falling wedge pattern. With BTC trading sideways, it's likely that alts will see a surge because money flows away from sideways price action.
I'm looking at the top resistance of the pattern as a short-term target. Pattern is still bearish, so we're keeping our target close.

#GMX/USDT breaks the Diagonal Trendline and currently retesting #GMX/USDT breaks the Diagonal Trendline and currently retesting it in 4-Hour TF!
Open a long on successful retest. Expecting some bullish momentum.
GMXUSDT By HesamUNTHey traders
what u think about GMX ?
share ur chart and leave a comment
Additional information will be in the updates

GmxusdtBullish divergence
Breaking into a bullish chuvashov fork
Lows around 27 ASX:RAN last liq run
Still the largest volume revenue perp dex apparently
Arthur hayes just bought
Angelo is back on the timeline after sec lost the etf case
Should be near the bottom if not quite close...
Nfa but pump it imo..

GMXUSD ❕ rebound50EMA has broken upwards through 200EMA at 1H TF.
The price is testing 200EMA as support at 30m TF.
I believe the asset will continue to rise after holding support.

long GMXTSX:GMX broke through the descending trendline and the resistance level. Bullish movement to resistance level at $44.6 is expected to happen.

GmxusdtLooks ready to start a new uptrend
Macd curling htf
Bullish div forming
Falling wedge low
Range low

GmxusdtQuite the sell-off
10% here to the top of the range..
Macd looks bottomed
Testing the early q1 low before inital hypewave..

a Good long position!It has an interesting order block
It can be a good profit potential
It should be monitored

GMX analysis for short positionGMX crypto analysis
According to the chart, it is placed inside the overblock area and it can have a good potential for #short position.
You can monitor and wait for #login trigger and #confirmation candle.
Do capital management and meet the appropriate risk and reward
Good luck and be profitable

$GMX - IN TROUBLE?Is something under the hood of TSX:GMX - Perpetual Arbitrum DEX not good?
Or are we about to see another big altcoin flush and this chart is just showing it very well?
Mega bearish on the technicals of GMX.
