Long x20Smart Money Concepts (SMC) trading is an alternative approach to price action that employs classic Forex principles such as supply and demand, price patterns, and support and resistanc
GMXUSDT trade ideas


short GMXTSX:GMX broke through the support level and the ascending trendline. Beamish movement to $43.5 is expected to happen next.

GMXUSDTGMXUSDT is in bearish phase potentially printing LH and LL.
There is no divergence or reversal pattern shown .
We wait and watch for the breakout of last LL.

GMX (GMX.USDT) GMX price today is $56 with a 24 hour trading volume of 30 million dollar. GMX price is up 4% in the last 24 hours and 380% growth in only six month
but what is GMX? Its a decentralized spot and perpetual exchange that supports low swap fees and zero price impact trades
GMX on Arbitrum has seen meaningful growth in both daily users and transactions. this is in part due to the recent GMX token listing on Binance, the growth of Arbitrum, and its recent upgrade with Arbitrum Nitro. If you check candle shadows you see that GMX can be extremely volatile so always be sure that you know your targets and using stop loss
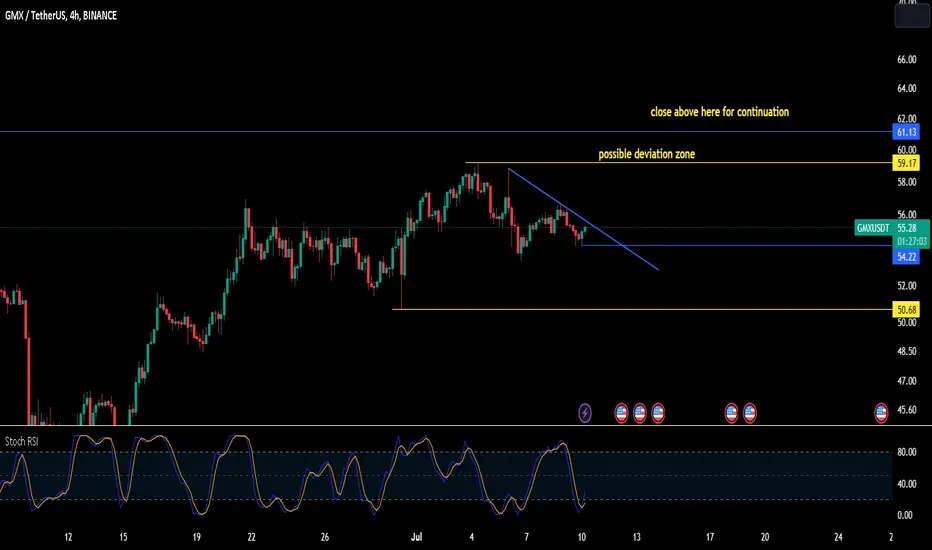
RSI could give a good signal on gmx and If you manged to buy at 30$ zone its time to take profit and if you trade in short time or you do scalp, 59$ is very important level

GMX longBullish on GMX!
A daily close above 56.40 and I looking for a long position. For the daily time frame I see a 10% trade, Target1, can play out quite fast.

GmxusdtHi guys I think it is a good deal. You should take a position according to your own analysis and with your own responsibility

GMX plan for coming weeksGMX has been in downtrend for few weeks, tapping to a H4 demand zone, we may see a quick bounce to retest recent BO level and it will continue downtrend to mitigate FVG and then bullish wave to mitigate bearish FVG.

GMX shortGMX broke trough off the lower boundary of ascending channel. Asset broke trough the support level. Bearish movement to support level at 43.6 is expected to happen.

Brief Analysis ——GMXAfter the FUD of SEC, as representatives of Optimistic-Rollup, OP and ARB rebounded stronger than many other tokens. In the second half of the year, ETH will usher in an important upgrade, Dencun, which will reduce the transaction fee of L2, which is beneficial to OP and ARB. And it is likely that other L2-tokens will appear in the second half of the year, making Layer 2 a new focus. Today we bring the brief analysis of OP, ARB and GMX.
GMX is the largest DEX on Arbitrum. GLP mechanism has been imitated by many protocols. An ecosystem around GLP has been derived. In the context of CEX being sued by the SEC, GMX, which has both DEX and L2 stories, has attracted more traders' attention.
After the FUD of SEC, GMX quickly repaired the loss. Price rose with callback. Under such a process, the bears gradually increases (shown by the red arrow). In the near term, the bears is on the offensive again after the pump. The strength of bulls and bears is close, more like in the process of fluctuation.
Conclusion: Mostly fluctuation. The strength of the bears has increased and the upward slope has decreased. So we think GMX will remain fluctuating. We set resistance level at 64 and support level at 51.
If you have any ideas, welcome to communicate with us:)
Disclaimer: Nothing in the script constitutes investment advice. The script objectively expounded the market situation and should not be construed as an offer to sell or an invitation to buy any cryptocurrencies.
Any decisions made based on the information contained in the script are your sole responsibility. Any investments made or to be made shall be with your independent analyses based on your financial situation and objectives.

GMX high trader grade on token MetricsGMX presents a bullish opportunity with positive indications from the Token Metrics Trader Grade ratings and chart analysis.
The price action on GMX is forming an ascending triangle pattern, suggesting a higher likelihood of a breakout to the upside. Based on this pattern, the measured move indicates a potential gain of 42%.
Additionally, there is a noticeable gap in the Volume-Weighted Price (VRP) all the way up to the measured move level, indicating potential momentum for further upward movement.
When considering the technical indicators, both the Moving Average Convergence Divergence (MACD) and the Relative Strength Index (RSI) suggest the possibility of a retracement towards the lower boundary of the triangle. This could be considered a riskier entry point but offers greater potential rewards.
Alternatively, a more conservative approach would be to wait for the price to break above the upper boundary of the triangle and retest it as support. Setting alerts on both the upper and lower trendlines would be prudent. Monitoring smaller timeframes like the 5-minute chart can provide additional insights for determining an entry point.
Overall, GMX appears to have a bullish outlook with multiple factors aligning in favor of a potential upward move. As with any trading decision, it's important to conduct thorough analysis and consider personal risk tolerance before entering a trade.

long GMXTSX:GMX bounced off the support level and the ascending trendline. Bullish movement to $60 is likely to happen.

#GMX/USDT 8h (Binance Futures) Descending channel breakoutGMX just regained 50MA support and seems to be ready for a rally towards 200MA resistance, probably after a last dip.
⚡️⚡️ #GMX/USDT ⚡️⚡️
Exchanges: Binance Futures
Signal Type: Regular (Long)
Leverage: Isolated (3.0X)
Amount: 6.4%
Current Price:
49.74
Entry Targets:
1) 47.36
Take-Profit Targets:
1) 58.39
Stop Targets:
1) 39.99
Published By: @Zblaba
TSX:GMX #GMXUSDT #Gambit #DEx
Risk/Reward= 1:1.5
Expected Profit= +69.9%
Possible Loss= -46.7%
Estimated Gaintime= 2-3 weeks
gmx.io

GMX climbing wave to 62~662h time frame
-
GMX just broke the falling wedge.
It shows more chance to keeping going upward.
TP: 61.3~63.6 and 66.8 is the final targer
SL: 52.7


GmxusdtThis exchange redistributed ~50-70% of its marketcap in ethereum to gmx stakers in q1 alone
Heavily undervalued as long as people keep using it
Look poised to start a new uptrend here first higher low then off we go?

long GMXTSX:GMX broke through the descending trendline. Bullish movement to resistance level at $57.82 is expected to happen.

GMXUSD ❕ broke up the channelGMX broke up 50EMA (1H TF)
On the 30m Timeframe, the chart has fixed above the 200EMA.
I believe the asset will continue to rise.

GMX breaking out of descending channelGMX seems to be breaking out of the descending channel from the last few months.
im long here since 49.17

GMX: Channel DownTrade setup : Price appears on the verge of bullish breakout from Channel Down pattern, which could be a beginning of a bullish trend reversal. We wait for confirmation – price needs to break and stay above $53 resistance zone. If it does, price could revisit $60 next. This is a higher risk trade setup since the overall trend is down. We highlighted GMX in Dec 2022 as our “Coin Pick” fundamental research as a big beneficiary of FTX fallout.
Pattern : Price is trading in a Channel Down pattern. With emerging patterns, traders who believe the price is likely to remain within its channel can initiate trades when the price fluctuates within its channel trendlines. With complete patterns (i.e. a breakout) – initiate a trade when the price breaks through the channel’s trendlines, either on the upper or lower side. When this happens, the price can move rapidly in the direction of that breakout.
Trend : Downtrend across all time horizons (Short- Medium- and Long-Term).
Momentum is Mixed as MACD Line is above MACD Signal Line (Bullish) but RSI ~ 50 (Neutral).
Support and Resistance : Nearest Support Zone is $40, then $26. The nearest Resistance Zone is $53 (previous support), then $60.

GMX ready to $1321D time frame
-
GMX retesting well so far.
Entry is good around 50.
Target: 132.3
SL: 37.9 (need to carefully manage your position)

GMXI've made the decision to buy some GMX with a target of 58, 64, 67 and a stop at 52.
The information provided here is for informational purposes only and should not be considered as financial or investment advice.
