Change your life with GOAT!As i have earlier mentioned a lot of times! AI coins would do bangers, but I am not like some to spread FUD but on analysis. GOAT goes below the black line, done its gone but still its time for you to bag all the amount of money you wish to through this. Mark my words and save this. Consider seeing my old analysis as well.
GOATUSDT trade ideas

Trading 101 : How to be a GOAT and eat grass Well you tell me how? While i tell you its going to go 2 dollarssssss sooonn!

BE the NO 1 GOAT!So being goat or if someone calls you goat? How you feel? Well nice right?
WOAH see a double dead cat bounce, imagine the pain all longs took just to see it go wash away, i would anticipate for new buys again once it reaches red line, 35% buys also good, and rest on red line, and stances as marked.

#GOAT vomited up everything he ate.this shitcoin vomited up everything he ate.
Can't even maintain profit for a day
#GOAT

#GOATUSDTIt needs to break an important level to climb. In case of failure, it can be reviewed by observing the loss limit.

#GOAT #shitcoinPay attention to this chart, every time it goes up, it drops three times.
The meme coin is worth investing in if the pump and dumps must standard, not pump for the empty the coins and exit the market.
These increases are because a number of traders are reducing volume and exiting from this shitcoin.
So every pump is an opportunity to exit this shitcoin.
It is a big mistake to think that the price has reached the lowest level and has the possibility of another pump and can make you a billion.
If one day this shitcoin grows by 200%, rest assured that other coins will grow by 1000%.
#GOAT #shitcoin
Pay attention to the social media and community of this shitcoin. It is completely closed and they are just watching the destruction of those who sold the coin to them at the highest price and are enjoying themselves with their money.

GOAT(USDT)
#GOATT he price is rebounding from a key support zone and forming a potential breakout pattern on the weekly timeframe.
Key Price Targets:
🎯 Target 1: $0.80956
🎯 Target 2: $1.07772
🎯 Target 3: $1.38485
This structure indicates a strong potential for upward momentum if the support level holds.

#GOAT/USDT is rejecting from the Diagonal Trendline#GOAT/USDT is rejecting from the Diagonal Trendline after multiple times.
🚀 Plan: Wait for Breakout & Market Structure ?Shift (MSS) to long $GOAT.
🔑 Key Level:
Resistance: PML $0.3872
#GOAT shitcoin Never invest in shitcoin like this. #GOAT
A shitcoin that does not have a proper community is not worth investing in at all.
It may be pumped again one day, but you should never invest in a shitcoin whose owners sell their coins at a high price
because you will have to wait years for it to bounce back due to market fluctuations.
I have already warned that this shitcoin will eventually approach zero.

GOAT has likely bottomed- after a 75% drop in price, GOAT is at an area of value in terms of R:R
- the original AI meme/agent coin
- in a falling wedge that likely gets resolved to the upside
- lower timeframes are extremely constructive (comments)

#GOAT/USDT is rejecting from the Diagonal Trendline#GOAT/USDT is rejecting from the Diagonal Trendline after multiple attempts.
🚀 Plan: Wait for Breakout/Retest to long $GOAT.
🔑 Key Levels:
Support: PWL $0.3366
Resistance: PMH $0.9275

GOAT is on the Verge of Falling Wedge Breakout!GOAT is on the Verge of Falling Wedge Breakout!
Will definitely long once it reclaims $0.42

GOAT descending channelGOAT / USDT
Know nothing about this coin but i see giant descending channel which is bullish pattern
As long as holding above red trend line support its bullish .. primary target is upper trendline and if we got a breakout strong move will occur
Keep an eye on it

$GOAT/USDT CRYPTO ANALYSIS Crypto Analysis: $GOAT/USDT
The price trades within a descending channel and a potential breakout is brewing!
Entry Zone: CMP
Target 1: $0.43609
Target 2: $0.60962
Target 3: $0.96106
Stop-Loss (SL): Below $0.29196
The RSI is at 37.60, signaling possible bullish momentum as the price nears oversold territory.
Watch for a breakout above the channel for confirmation! 👀

$GOAT - Entry on RetestHere's a straightforward strategy for range trading - RETEST:
If you missed the initial price drop, we can wait for the price to hit the immediate resistance and then enter the trade on a valid retest.
In this scenario, we observed a gap around .315, which could serve as a potential retest area, similar to what we saw at the high.

Eyes on $GOATSEUS: Strong Bids Under 30cLooking for bids under 30c on $GOATSEUS.
End of the month or early February should fill those orders. If not, I’ll try to play the breakout or reclaim into 40c.
I’ve been extremely cautious with my entries lately, as things still seem weak on the altcoin side. However, with ETH close to 3k, SOL nearing 160, and BTC potentially bottoming closer to the mid-80ks, we could see MEXC:GOATUSDT drop below 30c.
I’ll cut if there’s a clear break below 20c.

#GOAT/USDT Short-Term Rally or Wave 5 Decline ?#GOAT/USDT is currently forming a descending channel with a 5-wave Elliott Wave structure. The price shows potential for a short-term upside move toward $0.69, which acts as a crucial resistance level at the upper boundary of the channel. If rejected at this level, the price may continue its downtrend toward $0.32, aligning with the lower channel boundary and Wave (5) target. Traders should watch for a breakout or rejection at $0.69, as it will determine the next significant move. A breakout could signal further bullish momentum, while rejection would confirm the continuation of the bearish trend. BYBIT:GOATUSDT.P

#GOAT/USDT swept liquidity below PML $0.3861.#GOAT/USDT swept liquidity below PML $0.3861.
🚀 Wait for a Market Structure Shift (MSS) to confirm a long position.
📈 Key resistance level: PWH $0.637.

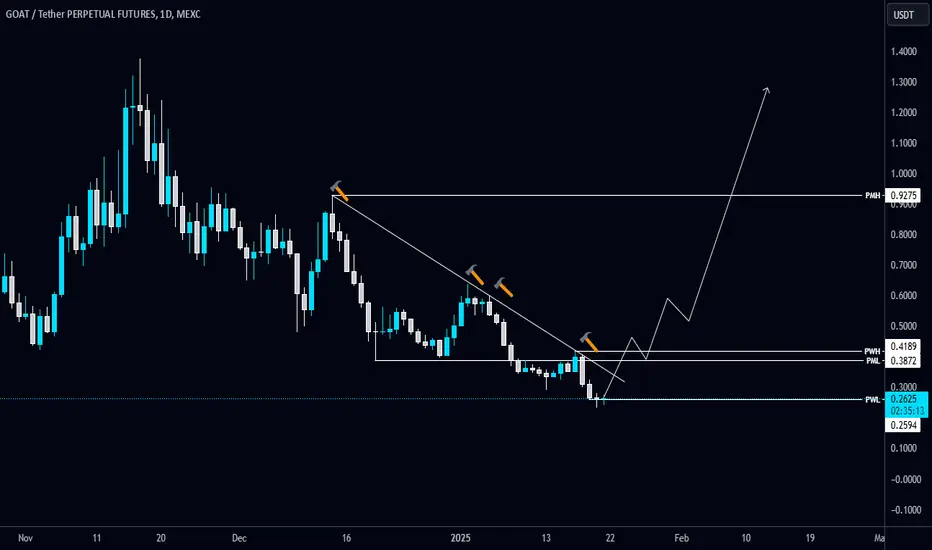
GOAT is No MORE! WHATS NEXT?GOATSEUEESSSS is eaten by shorters or bears, I never knew bears like goat so much, anyways the weekly low is broken and ideal longs are marked, Scalps do it, if youre lucky enough a new tpo magnet will pull you up. rest arrows marked to follow

GOAT/USDT Straight To The TargetDropped to the deep hell 360% + (20x Lev) profit for those who trusted our Elliott Wave analysis and rolled with my calls. While everyone else was chasing longs, we spotted the perfect short and nailed it. Enjoy the gains ! For more killer trades, follow me @wsaetos.

GOAT/USDT Elliott Wave Analysis Short-Term The chart highlights a descending channel pattern integrated with Elliott Wave analysis, indicating possible short-term price movements. Currently, the price is navigating through Wave 4 and nearing a key resistance zone.
Key Observations
The price action reflects an Elliott Wave corrective structure within a descending channel.
The ongoing Wave 4 suggests an upward move towards $0.69, a significant resistance level.
After testing this resistance, the price could retrace to $0.32, completing Wave 5.
Strategic Implications
Watch for potential rejection or breakout signals around the $0.69 resistance zone for short-term opportunities.
The projected dip to $0.32 could be a better area to re-enter for short-term trades.
Focus on confirmation of Wave 5 completion to reassess the trend and strategy.
Short-term traders should remain cautious and agile as the pattern unfolds.

GOATUSDT 1DGOAT ~ 1D
#GOAT This is the main support block that has been keeping the price from dropping any lower. buy gradually from here, target 20%++

$GOAT - Potential Pullback ZoneMIL:GOAT pulled up 62% off the lows, and it's now retracing as Bitcoin dominance rises up.
Level that we're watching now for potential bounce is around 0.45 to 0.42 (4H demand)
We'll be looking to long at this area, targeting .60s-.70s
