Lingrid | GOLD Weekly MARKET Update: Price Coiled for Major Move OANDA:XAUUSD has formed an inside bar pattern on the monthly timeframe, creating a high-probability setup for the next major directional move. May's candle sits completely within April's range, with this compression typically preceding explosive moves in either direction. The 4H chart shows a complex corrective structure following multiple failed breakout attempts from the April high around. The recent bounce from support, which is May's low, suggests potential accumulation, though the overall structure remains corrective with descending highs.
Current price sits near the middle of the critical range. A break above May's high at 3,400 could trigger rapid acceleration toward 3,500-3,600, while breakdown below 3,120 would likely target major support around 3,000-3,050. Multiple fake breaks on shorter timeframes suggest accumulated stops on both sides, potentially fueling rapid acceleration once genuine breakout occurs. The A-B-C corrective pattern visible suggests the recent decline may be nearing completion.
The monthly inside bar pattern's resolution will likely determine gold's trajectory through the summer months. A bullish breakout could reignite the broader uptrend toward new highs, while a bearish resolution might trigger a deeper correction that tests major support levels. Either outcome would likely provide substantial trading opportunities for those positioned correctly when the pattern resolves.
The broader fundamental backdrop continues to support gold's long-term bullish case, though short-term technical factors may drive the immediate direction. Central bank policies, geopolitical tensions, and currency debasement concerns provide underlying support, while technical positioning suggests the market is primed for significant movement.
Traders, if you liked this idea or if you have your own opinion about it, write in the comments. I will be glad 👩💻
GOLD trade ideas

GOLD increased in the short term, approaching an important levelFrom a recent price action standpoint, the move on Gold may have offered cues of encountering weakness, and could serve as a key trigger for bearish traders. This is why I’m anticipating further short-side follow-through. The negative outlook is not confirmed yet, however a bounce off the trendline could once again attract sellers, for a decent move to 3,240 support zone . This latter zone, could be a key turning point that if broken, would lead to a good opportunities for buyers looking to get involved on the dips, anticipating a potential shift in momentum.
But a strong move up and break of trendline at around 3335-3340, would allow Gold to reclaim the 3400 mark and climb even further.
On Monday in my last analysis I predicted that the price gold would fall as low as 3290, after which the price has rebounded short term. All this being said, I am closely watching how price will react when it encounters the trendline as shown and I will wait for any confirmation clues.
Please note that I will not get involved without proper confirmation

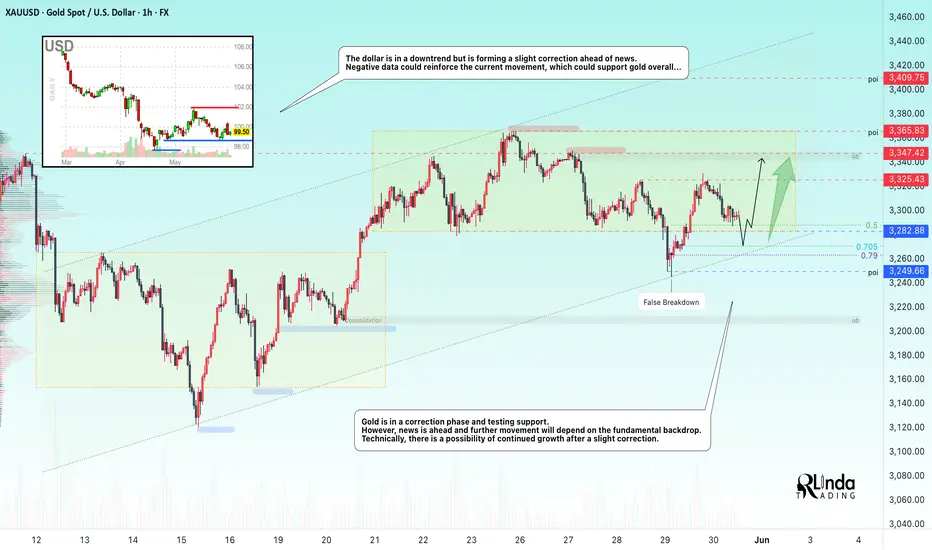
GOLD → Consolidation ahead of news. Retest of resistanceFX:XAUUSD remained above the key support level of 3280 and is testing intermediate resistance. Against the backdrop of the dollar's decline, the metal has a chance to continue its growth...
Gold is trading in consolidation ahead of the Fed meeting minutes. Easing trade risks and the dollar's recovery triggered a correction from the recent peak of $3366. Against the backdrop of the dollar's correction, the metal is entering a phase of local rally and testing resistance at 0.5f
The Fed is maintaining a cautious tone, and the market is waiting for signals on interest rates. The escalation of the conflict in Ukraine and the threat of new sanctions from Trump did not cause significant concern in the markets. Investors are waiting for drivers
Resistance levels: 3322, 3348, 3363
Support levels: 3290, 3282, 3265
A small correction may form from 3322 before growth continues. The market is interested in liquidity in the 3348-3363 zone, and the price is likely to test this zone. However, further developments depend on the fundamental background. Rising economic risks or hints of interest rate cuts could support the price of gold.
Best regards, R. Linda!

In Theory, You’re a Great Trader — In Practice, You’re Human🧠 10 Ways Trading Theory Falls Apart in Real Practice
Because in theory, you're rich. In practice, you panic-sold at support.
“In theory, there is no difference between theory and practice. In practice, there is.”
— Yogi Berra
Welcome to trading — where you read about patience and discipline, and then blow up your account chasing a breakout at 3AM.
Let’s explore the top 10 ways trading theory gets wrecked by real-world execution, complete with painful honesty and maybe a laugh or two (because crying is for after market close).
________________________________________
1. 🎯 In theory: You always follow your trading plan.
In practice:
You make a new plan after every trade.
That loss wasn’t part of “the plan,” so obviously the plan was wrong. Let’s fix it — during the trade — in real-time — while it bleeds. Genius.
________________________________________
2. 🧘♂️ In theory: You manage risk carefully.
In practice:
"Let me just move the stop... just this once... just 10 more pips..."
Before you know it, your stop loss is in the next timezone, and your trade is now a long-term investment.
________________________________________
3. 📊 In theory: Backtesting proves the strategy works.
I n practice:
Backtest = you, alone, with no emotions, clicking replay in TradingView.
Live trading = markets screaming, Twitter panicking, and you entering on the 1-minute chart because “it felt right.”
________________________________________
4. 💻 In theory: You’ll be objective.
In practice:
You saw one green candle and whispered:
“This is it. The reversal. I feel it.”
You weren’t objective. You were in a situationship with your trade.
________________________________________
5. 💰 In theory: R:R 2:1 minimum.
In practice:
You close at +0.3R “just to be safe” — and then it hits target 10 minutes later while you re-enter worse, and get stopped.
________________________________________
6. 🕒 In theory: You wait for confirmation.
In practice:
You anticipate confirmation. You hope for confirmation.
Spoiler: hope is not a strategy. But hey, at least you learned… again.
________________________________________
7. 🤖 In theory: You’re a rules-based, emotionless trader.
In practice:
You meditate, breathe deeply, journal, and then buy Gold after CPI with no stop loss and max leverage.
So much for being the Terminator.
________________________________________
8. 📚 In theory: More knowledge = better performance.
I n practice:
You read five books, memorized all candlestick names, and still entered long into resistance because it “looked bullish.”
Trading isn’t trivia night. It’s controlled decision-making under fire.
________________________________________
9. 😤 In theory: You’ll accept losses calmly.
In practice:
First you rage-quit. Then you revenge trade. Then you open ChatGPT and ask:
“Should I hedge this 80% drawdown?”
________________________________________
10. 📆 In theory: You’ll be consistent.
In practice:
You traded London Open on Monday, Asian Session on Tuesday, and New York close on Friday.
Consistency? You don’t even use the same time frame twice in a row.
________________________________________
🚧 So… how do you bridge the gap?
1. Journal your trades — honestly. Especially the emotional mess-ups.
2. Create rules you can actually follow — not Instagram-quote rules.
3. Simulate real conditions — including drawdowns, boredom, and fakeouts.
4. Accept that mistakes are part of the job — and build for resilience, not perfection.
5. Trade small enough that you don’t care much — so you can learn while surviving.
________________________________________
🎯 Final word:
Trading theory is like a clean whiteboard.
But the market? It’s a chaotic toddler with crayons and no rules.
If you can operate inside that chaos — with clarity and emotional control — that’s when the theory starts working.

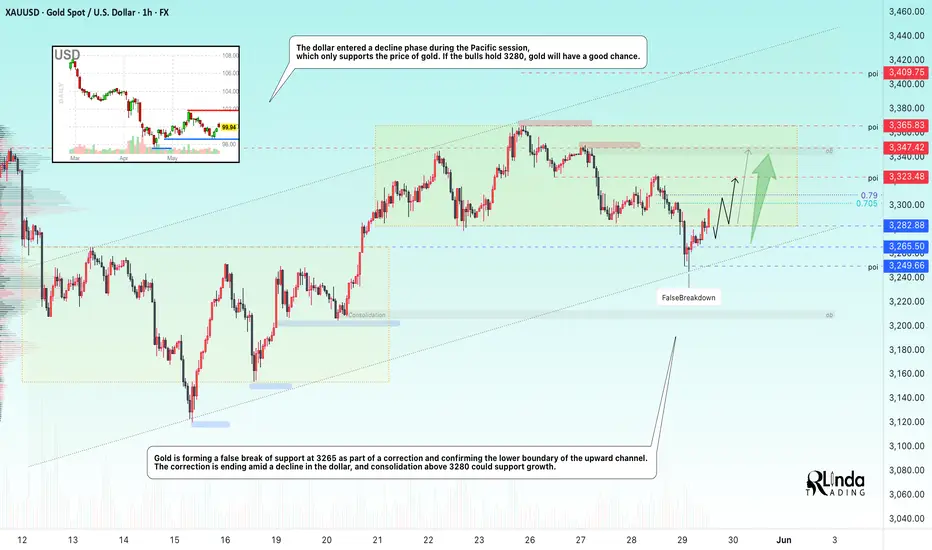
GOLD → False breakdown and support from the falling DXYFX:XAUUSD , as part of a correction, confirms the upward trend line and returns to the consolidation (range), making a false breakdown of support amid the dollar's correction...
The US dollar remains stable thanks to the Fed's hawkish minutes and the court's decision to block Trump's tariffs. Investors are waiting for Friday's inflation data (PCE), which could weaken the dollar and give gold a chance to rebound. Additional influence will come from US GDP data, jobless claims, and geopolitical news.
On D1, gold is rebounding from strong support and heading towards resistance at the rising trend line. If economic risks remain high, gold could continue its rally despite conflicting bearish patterns...
Resistance levels: 3300, 3310, 3325
Support levels: 3290, 3285, 3265
Gold is forming a false breakdown of support at 3265 as part of a correction and confirming the lower boundary of the upward channel. Consolidation above 3280 will confirm that bulls are holding the market amid high economic risks. Gold may test 3300-3310 and form a correction before continuing its growth towards 3325.
Best regards, R. Linda!
GOLD → Correction before possible growthFX:XAUUSD entered a liquidation phase (rally) within the trading range at the opening of the session. The dollar's rise is to blame. The focus is on supporting consolidation...
Investors remain interested in gold as a safe haven asset amid geopolitical risks and declining demand for US assets.
The key drivers remain news about tax reform in the US, trade negotiations, and upcoming macro data.
Gold is consolidating, but since the opening of the session, the price has been heading towards support. Against the backdrop of an upward trend, a trigger for bearish liquidity is likely to form before growth.
Against the backdrop of the dollar's growth, gold is entering a correction phase. At the moment, all attention is on support and the liquidity zone of 3265. A false breakdown will trigger a price buyback.
Resistance levels: 3322
Support levels: 3282, 3265
Since the price is still within the range and a countertrend correction is forming in the market, in our case, it is worth considering an intraband trading strategy. A false breakdown of support could trigger growth to intermediate resistance or to the upper border of the channel.
Best regards, R. Linda!

Gold long again: Completion of Double CombinationYesterday's long gold idea was invalidated and turns out that Gold has decided to do a double combination instead of a single A-B-C correction.
Now that I've seen a completion of a Double Combination, I think it is time to try to long gold again.
The stop is below $3240.

GOLD 1H CHART ROUTE MAP UPDATE & TRADING PLAN FOR THE WEEKHey Everyone,
Please see our updated 1h chart levels and targets for the coming week.
We are seeing price play between two weighted levels with a gap above at 3305 and a gap below at 3271. We will need to see ema5 cross and lock on either weighted level to determine the next range.
We will see levels tested side by side until one of the weighted levels break and lock to confirm direction for the next range.
We will keep the above in mind when taking buys from dips. Our updated levels and weighted levels will allow us to track the movement down and then catch bounces up.
We will continue to buy dips using our support levels taking 20 to 40 pips. As stated before each of our level structures give 20 to 40 pip bounces, which is enough for a nice entry and exit. If you back test the levels we shared every week for the past 24 months, you can see how effectively they were used to trade with or against short/mid term swings and trends.
The swing range give bigger bounces then our weighted levels that's the difference between weighted levels and swing ranges.
BULLISH TARGET
3305
EMA5 CROSS AND LOCK ABOVE 3305 WILL OPEN THE FOLLOWING BULLISH TARGETS
3334
EMA5 CROSS AND LOCK ABOVE 3334 WILL OPEN THE FOLLOWING BULLISH TARGET
3359
EMA5 CROSS AND LOCK ABOVE 3359 WILL OPEN THE FOLLOWING BULLISH TARGET
3389
EMA5 CROSS AND LOCK ABOVE 3389 WILL OPEN THE FOLLOWING BULLISH TARGET
3428
EMA5 CROSS AND LOCK ABOVE 3428 WILL OPEN THE FOLLOWING BULLISH TARGET
3478
BEARISH TARGETS
3271
EMA5 CROSS AND LOCK BELOW 3271 WILL OPEN THE FOLLOWING BEARISH TARGET
3227
EMA5 CROSS AND LOCK BELOW 3227 WILL OPEN THE SWING RANGE
3185
3146
As always, we will keep you all updated with regular updates throughout the week and how we manage the active ideas and setups. Thank you all for your likes, comments and follows, we really appreciate it!
Mr Gold
GoldViewFX

Lingrid | GOLD Key SUPPORT Zone Bounce OpportunityOANDA:XAUUSD is consolidating after a rejection from the descending resistance trendline near 3345, with price now approaching the prior demand zone around 3265. If this support holds, a bullish reaction could propel price back toward the 3345–3350 zone for another retest. The broader pattern reflects a potential higher low forming against the downward trendline. A bounce here would confirm bullish interest and set the stage for continuation higher.
📈 Key Levels
Buy zone: 3265
Buy trigger: bullish reaction from support or breakout above 3300
Target: 3345
Sell trigger: break below 3265
💡 Risks
Failure to hold 3265 support could trigger sharp downside
False breakouts near 3345 remain a threat
Market-sensitive data could increase volatility
Traders, if you liked this idea or if you have your own opinion about it, write in the comments. I will be glad 👩💻

Lingrid | GOLD potential LONG trade From the SWAP zoneOANDA:XAUUSD is testing the SWAP zone, aligning closely with the rising trendline support near 3244. If bulls defend this level again, a move toward 3400 remains in play, with the downtrend line offering resistance on the way up. A higher low formation here would signal renewed bullish interest. We should watch for a breakout or rejection to confirm next direction.
📈 Key Levels
Buy zone: 3244–3255
Buy trigger: break and retest above 3287
Target: 3400
Sell trigger: drop below 3244
💡 Risks
Rejection from descending trendline
Failure to form a higher low structure
Breakdown of channel support near 3240 would invalidate the bullish thesis
Traders, if you liked this idea or if you have your own opinion about it, write in the comments. I will be glad 👩💻

GOLD → Correction after distribution. Bullish trendFX:XAUUSD is testing the liquidity zone at 3350 and forming a false breakout of resistance within the uptrend. A correction is possible before growth continues.
The fundamental background is quite controversial in the market. In the current situation, the focus is on relations between Russia and Ukraine, especially after the escalation that took place over the weekend. Everyone is watching the ongoing negotiations in Turkey. In addition, we should not forget about the situation with tariffs, which is still quite tense.
Gold has been rallying since the opening of the session and has reached the order block. A false breakout of resistance is forming, which could trigger a correction to the zone of interest. The dollar is hitting support, which could form a local correction before continuing its movement. This could also affect the price of gold, which remains bullish in the market.
Resistance levels: 3350, 3365, 3409
Support levels: 3303, 3264
The price has broken out of consolidation, with resistance tested and liquidity above 3350 realized. Relative to the current level, a correction is possible with the aim of retesting support before continuing to rise.
Best regards, R. Linda!

GOLD conditions seem to remain bearish: Pay attention to hintsFor now, we can see that Gold’s bullish momentum has stalled and since Friday Gold has been under pressure from 3325. Not surprisingly though, the market structure performed as expected this past week.
I believe that short-term price action in gold may remain choppy next week due to Trump’s temporary tariff measures so caution is advised.
My bias is still the same as before, I think that on Monday the market will open bearish likely pushing price lower initially.
As you can see in my previous analysis, the forecasted move played as expected:
So this being said I plan to react based on how price behaves at support of 3270-3250 on the lower side in the short term.
If price tags the support as shown on my chart, I’ll be watching for a possible rebound toward 3300. This range in particular should not be overlooked . This area aligns with the point of control, and given how price often gravitates back to high-volume zones after sharp moves, a recovery to that level would be a natural reaction.
The key point lies in how the market will open and how price will behave, as well as the overall sentiment.
Gold's next move won’t be random, there are strong confluences at play that will guide and give us hints, so it’s up to us to stay attentive.
If we were to break upside above the $3,330 level, then we can see more bullish outlook next
The other scenario, to be taking into account would be to start with a strong bullish candle and reach 3330 before a drop.
Wishing you a profitable trading weekend ahead. This is just a forecast and should not be considered financial advice.

GOLD → Retest support before news...FX:XAUUSD is in a correction phase amid a rising dollar. The price is heading towards the liquidity zone, which may support gold. Markets are awaiting PCE data...
Gold is back in the red: PCE inflation and tariff news will decide everything. On Friday morning, gold fell, retreating from its recent rebound from weekly lows of around $3245. The price is under pressure from the strengthening US dollar, which was supported by court rulings on Trump's tariffs, but the situation around tariffs remains tense on all sides...
The focus is on PCE inflation data. A weaker result could weaken the dollar and support gold. Traders remain cautious in anticipation of volatility.
Support levels: 3282, 3270, 3260
Resistance levels: 3325
A retest of 3282-3270 could end in a false breakdown, but only if the fundamental backdrop is against the dollar, which would only support the price of gold. The price is most likely to be stopped by trend support, but no one can rule out the fundamental factor of surprise...
As a target, during a bullish impulse, it is worth considering intermediate highs...
Best regards, R. Linda!
Lingrid | GOLD ABC Correction Complete, Next Resistance in FocusOANDA:XAUUSD continues to ride an upward channel, recently rebounding from trendline support after a flag breakout. The price tested resistance near 3430 before pulling back slightly, forming a potential bullish retest setup. If the 3337 support holds, a continuation toward the 3430 zone remains in play.
📈 Key Levels
Buy zone: 3330–3340
Buy trigger: bounce from channel support
Target: 3430
Sell trigger: close below 3330
💡 Risks
Break below channel invalidates bullish structure
Resistance at 3430 may cap upside
Weaker momentum could trigger another flag-style retracement
Traders, if you liked this idea or if you have your own opinion about it, write in the comments. I will be glad 👩💻

XAUUSD Analysis Today: Technical and Order Flow !In this video I will be sharing my XAUUSD analysis today, by providing my complete technical and order flow analysis, so you can watch it to possibly improve your forex trading skillset. The video is structured in 3 parts, first I will be performing my complete technical analysis, then I will be moving to the COT data analysis, so how the big payers in market are moving their orders, and to do this I will be using my customized proprietary software and then I will be putting together these two different types of analysis.

Gold at Key Rejection Zone: Will the Drop Resume from $3310?By examining the gold chart on the 4-hour timeframe, we can see that after some consolidation between $3294 and $3302, the price finally began a sharp drop, correcting down to $3245. This area was a key demand zone on lower timeframes, which triggered a rebound, and gold is now trading around $3310. If the price gets rejected from the $3310–$3313 zone, we can expect another potential decline.
Please support me with your likes and comments to motivate me to share more analysis with you and share your opinion about the possible trend of this chart with me !
Best Regards , Arman Shaban

GOLD ROUTE MAP UPDATEHey Everyone,
Please see the update on our 1H chart route map - playing out exactly as analysed.
We started the week with a bearish gap at 3352 being hit, followed by an EMA5 cross and lock below 3352, which opened up the next level at 3317, also hit perfectly.
Yesterday, we found support above the 3282 retracement level, leading to a solid bounce into 3317. However, there was no EMA5 lock above 3317, and price faced rejection today once again, pushing it back toward 3282.
We are now looking for support to hold above 3282 to give us fresh bounce opportunities and upper Goldturn tests. However, a lock below 3282 will open up lower levels as we move deeper into the retracement range.
We are expecting continued reactions within this retracement range, in line with our plan to buy dips. Our updated levels and weighted levels help us track downward movements and catch bounce setups.
We'll continue to buy dips using our key support levels, targeting 20 to 40 pip moves. As always, each level structure provides consistent bounce zones, offering great opportunities for both entry and exit. If you backtest the levels we’ve shared every week over the past 24 months, you’ll see how effectively they work with or against short to mid term swings and trends.
Remember:
Swing ranges yield bigger bounces than weighted levels — that’s the key difference.
BULLISH TARGET
3389
EMA5 CROSS AND LOCK ABOVE 3389 WILL OPEN THE FOLLOWING BULLISH TARGETS
3428
EMA5 CROSS AND LOCK ABOVE 3428 WILL OPEN THE FOLLOWING BULLISH TARGET
3478
EMA5 CROSS AND LOCK ABOVE 3478 WILL OPEN THE FOLLOWING BULLISH TARGET
3517
BEARISH TARGETS
3352 - DONE
EMA5 CROSS AND LOCK BELOW 3352 WILL OPEN THE FOLLOWING BEARISH TARGET
3317 - DONE
EMA5 CROSS AND LOCK BELOW 3317 WILL OPEN THE FOLLOWING BEARISH TARGET
3282
EMA5 CROSS AND LOCK BELOW 3282 WILL OPEN THE FOLLOWING BEARISH TARGET
3233
EMA5 CROSS AND LOCK BELOW 3233 WILL OPEN THE SWING RANGE
3185
3146
As always, we’ll keep you all updated with real time analysis and management of active setups throughout the week. Thank you for your continued support, your likes, comments, and follows mean a lot!
Mr Gold
GoldViewFX

Gold (XAU/USD) – Inverse Head & Shoulders Breakout Setup🧠 Chart Pattern Identified: Inverse Head & Shoulders
🟡 Left Shoulder ➡️ Formed at a local dip.
⚫ Head ⬇️ Deepest low around 3,274.103.
🟡 Right Shoulder ➡️ Bouncing near the same zone.
🔁 This is a classic bullish reversal pattern — a break above the neckline could signal a strong upside move.
📊 Key Levels & Zones
🔵 Support Zone:
🟦 Area: 3,274 – 3,294
✅ Strong bounce seen here (highlighted by the head and shoulders base)
🔵 Resistance Zone:
📏 Just below 3,305 (marked as neckline)
✋ Price must break this to confirm the reversal
🔵 Target Point:
🎯 3360 📈
📏 Based on the height from head to neckline
🔵 Stop Loss Zone:
❌ 3,274.526
🔻 Below the head for safe risk control
⚙️ Trading Setup Summary
🔹 📍 Entry Point:
📌 Around 3,294.449
🚪 Enter on breakout above neckline
🔹 🎯 Target Point:
🏁 3360
🔹 🛑 Stop Loss:
🚫 3,274.526
🔹 Risk-Reward Setup:
🔍 Targeting a move of ~65 points
⚖️ Risk of ~20 points → solid R/R ratio
📈 Indicator:
🧮 EMA 70 ➡️ 3,305.005
⏳ Price currently testing it — a break above EMA would boost bullish confirmation.
📅 Economic Events:
📆 Multiple event icons suggest upcoming news — expect volatility!
⚠️ Be cautious during these times.
✅ Final Thoughts:
📊 Pattern suggests a bullish breakout is near 🚀
🔒 Use stop-loss and enter after breakout to manage risk effectively
🎯 Keep an eye on volume during breakout — it confirms strength

GOLD NEXT MOVE (expecting a mild bullish move)(03-06-2025)Go through the analysis carefully and do trade accordingly.
Anup 'BIAS for the day (03-06-2025)
Current price- 3355
"if Price stays above 3332-35, then next target is 3365, 3375, 3400 and 3432 and below that 3320 and 3310 ".
-POSSIBILITY-1
Wait (as geopolitical situation are worsening )
-POSSIBILITY-2
Wait (as geopolitical situation are worsening)
Best of luck
Never risk more than 1% of principal to follow any position.
Support us by liking and sharing the post.

GOLD ROUTE MAP UPDATEHey Everyone,
Please see update on our 1H chart route map from yesterday.
Another great day on the charts with our analysis playing out like we said.
Yesterday we stated; no EMA5 lock above 3317, forcing a rejection back to the retracement range.
We then stated that we are expecting continued reactions within this retracement range, inline with our plans to buy dips. Our updated levels and weighted levels help us track downward movements and catch bounce setups.
- This played out perfectly with the reaction from the retracement range into 3317. We will now look for a lock above this level for a continuation or failure to lock will follow with a rejection back into the lower Goldturns for support and bounce.
We'll continue to buy dips using our key support levels, targeting 20 to 40 pip moves. As always, each level structure provides consistent bounce zones, offering great opportunities for both entry and exit. If you backtest the levels we’ve shared every week over the past 24 months, you’ll see how effectively they work with or against short to mid term swings and trends.
Remember:
Swing ranges yield bigger bounces than weighted levels — that’s the key difference.
BULLISH TARGET
3389
EMA5 CROSS AND LOCK ABOVE 3389 WILL OPEN THE FOLLOWING BULLISH TARGETS
3428
EMA5 CROSS AND LOCK ABOVE 3428 WILL OPEN THE FOLLOWING BULLISH TARGET
3478
EMA5 CROSS AND LOCK ABOVE 3478 WILL OPEN THE FOLLOWING BULLISH TARGET
3517
BEARISH TARGETS
3352 - DONE
EMA5 CROSS AND LOCK BELOW 3352 WILL OPEN THE FOLLOWING BEARISH TARGET
3317 - DONE
EMA5 CROSS AND LOCK BELOW 3317 WILL OPEN THE FOLLOWING BEARISH TARGET
3282
EMA5 CROSS AND LOCK BELOW 3282 WILL OPEN THE FOLLOWING BEARISH TARGET
3233
EMA5 CROSS AND LOCK BELOW 3233 WILL OPEN THE SWING RANGE
3185
3146
As always, we’ll keep you all updated with real time analysis and management of active setups throughout the week. Thank you for your continued support, your likes, comments, and follows mean a lot!
Mr Gold
GoldViewFX

GOLD ROUTE MAP UPDATEHey Everyone,
Great start to the week with our chart idea playing out as analysed.
We started the day with our Bullish target hit at 3305 followed with ema5 cross and lock confirmation for 3334, which was hit perfectly with a further lock opening 3359 also completed.
We now have a cross and lock above 3359 opening 3389. We will continue to track the movement using cross and lock and any rejections on the levels will see price test the lower Goldturns for support and bounce.
We will keep the above in mind when taking buys from dips. Our updated levels and weighted levels will allow us to track the movement down and then catch bounces up.
We will continue to buy dips using our support levels taking 20 to 40 pips. As stated before each of our level structures give 20 to 40 pip bounces, which is enough for a nice entry and exit. If you back test the levels we shared every week for the past 24 months, you can see how effectively they were used to trade with or against short/mid term swings and trends.
The swing range give bigger bounces then our weighted levels that's the difference between weighted levels and swing ranges.
BULLISH TARGET
3305 - DONE
EMA5 CROSS AND LOCK ABOVE 3305 WILL OPEN THE FOLLOWING BULLISH TARGETS
3334 - DONE
EMA5 CROSS AND LOCK ABOVE 3334 WILL OPEN THE FOLLOWING BULLISH TARGET
3359 - DONE
EMA5 CROSS AND LOCK ABOVE 3359 WILL OPEN THE FOLLOWING BULLISH TARGET
3389
EMA5 CROSS AND LOCK ABOVE 3389 WILL OPEN THE FOLLOWING BULLISH TARGET
3428
EMA5 CROSS AND LOCK ABOVE 3428 WILL OPEN THE FOLLOWING BULLISH TARGET
3478
BEARISH TARGETS
3271
EMA5 CROSS AND LOCK BELOW 3271 WILL OPEN THE FOLLOWING BEARISH TARGET
3227
EMA5 CROSS AND LOCK BELOW 3227 WILL OPEN THE SWING RANGE
3185
3146
As always, we will keep you all updated with regular updates throughout the week and how we manage the active ideas and setups. Thank you all for your likes, comments and follows, we really appreciate it!
Mr Gold
GoldViewFX

XAUUSD Daily Outlook — Monday, June 2, 2025“Compression in Premium: Is Gold Building for the Drop?”
👋 traders — let’s prepare the battlefield.
Gold continues to range inside a tight compression box just under the May High. The current daily structure is showing clear signs of distribution inside premium, with multiple failed attempts to break higher. Each upside wick has been absorbed near 3328–3350, and price is now hovering just above key support near EMA50 + PNL (3228–3232).
This setup is classic: lower highs + equal lows + trapped liquidity = imminent breakout. We now anticipate either a clean breakdown below support, or one final inducement wick before the move begins.
🔹 Daily Structure Breakdown
Structure Element Status
Market Bias 📉 Bearish short-term (distribution signs)
Trend Sideways in premium, LH forming
Current Price ~3289 USD
April ATH 3500 (untouched since)
Last CHoCH/BOS BOS confirmed early May → bullish, but no follow-through
Current Setup Range-bound inside lower high, testing OB support
🔹 Refined Daily Zones
📍 Zone Type Key Levels What to Watch
🔺 Rejection Zone #1 3328 – 3342 Daily supply + previous bearish wick zone. Watch for rejection or inducement spike.
🔹 Key Support Zone 3232 – 3228 PNL + EMA50 cluster. Critical line — a clean break opens downside continuation.
🔹 Demand Block 3190 – 3180 Micro OB from May low. If support fails, this is the next magnet.
🔻 Breakdown Target 3044 Unfilled imbalance + clean demand zone from April breakout leg.
🔹 EMA & Momentum Check
✅ EMA 5/21/50: Still aligned bullish
⚠️ Price is sitting on top of EMA50 → breakdown threat if today's candle closes below 3228
RSI likely showing divergence — lower highs in price, weakening momentum
🔹 Daily Bias & Scenarios
📉 Bearish Bias below 3328
✅ Compression inside premium = expect breakout
🎯 Target 1: 3190 | 🎯 Target 2: 3044
❗ Bullish continuation only valid above 3342 with strong PA
🧠 Strategy Plan for Monday:
Sell Setup:
If price retests 3328–3342 early → watch for rejection → short toward 3190
Breakdown Setup:
Clean close below 3228 → open short continuation toward 3180
Buy Setup:
Only valid on deep retracement into 3180 with strong rejection + M15 structure shift
OR bullish breakout and hold above 3342 → target retest of May high
💬 Final Thoughts from GoldFxMinds:
Gold is compressing just below premium rejection — exactly where smart money distribution begins. This is not the moment to long blindly. Let the market show its hand — either break support, or spike into one final trap before dropping.
Trade with structure. Not emotion.
💡 Found this helpful?
📍 Follow GoldFxMinds for intraday sniper-entry updates, refined zones, and structured trade planning
💬 Drop a LIKE if you’re prepared to let the trap trigger before you react
👇 Comment below: Will gold hold 3228 or flush into 3190 this week?
Let’s start June with clarity and control.
— GoldFxMinds

THE KOG REPORT THE KOG REPORT
In last week’s KOG Report we said we would be looking for price to attempt the high, fail and make the move downside. This worked well in the early part of the week giving traders a fantastic capture for the short trade into the red box target levels which were all complete. During the week we update trades with the plan to long, and although there was a break from the red box, our lower red box bounced price giving the long trade completing the move.
It was only towards the end of the week where we started ranging that we only managed to capture short scalps on the upside move before the suggesting we call it a day, thankfully before the small decline from the level.
So, what can we expect in the week ahead?
We have a key level here of 3310-6 which has been a previous pivot in this range and is holding price down at the moment. This now make a crucial support region forming at the 3280-5 level with extension of the move into 3275. If this level holds and the red box reacts, we can see price push up from here and attempt to target the 3400 level again, which is towards the top of the range.
It’s this lower red box that needs to be watched for the break, as a break here will target the 3250-55 region initially and then go for the potential swing low around the 3210-2- region which in this scenario maybe the ideal long trade.
As always, we’ll update traders through the week with our analysis and red box target levels but for now, let’s see if we gap on open. Please remember, the market gaps with intention, the intention is usually to get traders in chasing the gap as soon as they see immediate exhaustion, this hardly ever works on gold and BTC especially. We’ve back tested the stretch, so please play caution on chasing gaps.
More choppy and ranging price action expected!
KOG’s bias of the week:
Bullish above 3285 with targets above 3306, 3310, 3321 and 3335
Bearish below 3285 with targets below 3267, 3255 and 3240
RED BOXES:
Break above 3290 for 3297, 3306, 3310, 3320 and 3330 in extension of the move
Break below 3280 for 3277, 3270, 3267 and 3255 in extension of the move
Many of our followers and traders have seen the power of the red boxes, Imagine this on your own TV screen, 4H for swing trading, 1H for day trading and 15min for scalping. Any pair on any chart 23hrs a day. Add to that the Knights indicator giving you swing points, key levels and retracement levels and our custom volume indicator telling you when to long, when to short and when to stand back from your trades.
LEARN AND GENERATE YOUR OWN SIGNALS. You don't need any of us to guide you.
KEY LEVEL 3237!
Please do support us by hitting the like button, leaving a comment, and giving us a follow. We’ve been doing this for a long time now providing traders with in-depth free analysis on Gold, so your likes and comments are very much appreciated.
As always, trade safe.
KOG
