XAUUSD – Bullish Reversal or Just a Deep Correction?Last week was a wild one for Gold.
After a quiet start and some choppy price action, the market dropped hard on Wednesday, breaking not only the 3300 key level but also the 3280 horizontal support — and what followed was anything but calm.
As expected after a strong move, the price pulled back to retest the broken support.
But Friday changed everything.
Instead of continuing down, Gold reversed sharply, fueled by weaker-than-expected NFP data. Price surged 800 pips from low to high, breaking above both the 3310 resistance zone and the weekly high around 3335.
________________________________________
🧭 Key Question:
Are we back in the bullish trend, or is this just a strong correction of the 3440 → 3270 drop?
Since May, Gold has lacked a clear trend — so a step-by-step trading approach is the most advisable to adopt.
________________________________________
🔍 Outlook:
Given the strength of the reversal and the break above two important resistance levels, my bias is bullish.
• 📌 Support: 3335 — a pullback into this zone could offer a buy opportunity in line with the recent momentum.
• 📌 Resistance: 3375 is the next key level to watch.
• ❌ Invalidation: A drop below 3310 would cancel the current bullish scenario.
🧠 Final Thoughts
Gold’s recent move challenges both bulls and bears.
Yes, the bounce was strong. Yes, key resistance levels broke.
But with no clear trend since May, chasing long term direction can be risky.
That’s why a step-by-step approach is the most advisable to adopt — let the market confirm each move before committing to the next.
For now, the breakout above 3310 and 3335 leans the bias to the upside.
However, staying reactive — not being stuck with an idea — is the smartest approach.
Disclosure: I am part of TradeNation's Influencer program and receive a monthly fee for using their TradingView charts in my analyses and educational articles.
GOLD trade ideas

Gold is still stuck in range.Gold is still stuck in range before big move. The Yellow metal Is forming this wedge pattern for fourth days. I'm out of trade now. In any case I'm ready to sell it tomorrow with respect on its develope.

GOLD in 1HHello to all traders. 😎😎
I hope all your deals will hit their targets. 🎉🎉
On the first day of August, gold surged strongly due to news about tariffs imposed by Trump on imported goods. It gained nearly $60 in a single powerful candle.
Currently, I expect a pullback from the $2362–$2370 range down to around $2347–$2352, followed by a potential rebound back to $2370.
⚠️⚠️⚠️⚠️Don’t forget to apply proper risk management!
What Do You Think?
Which scenario do you think is happen? **Share your thoughts!** ⬇️
Don't forget that this is just an analysis to give you an idea and trade with your own strategy. And don't forget the stop loss🛑🛑🛑
❤️❤️❤️The only friend you have in financial markets is your stop loss❤️❤️❤️
Please support me with your ✅' like'✅ and comments to motivate me to share more analysis with you and share your opinion about the possible trend of this chart with me 🙏😊
Be Happy , Ali Jamali
XAUUSD: Market Analysis and Strategy for August 5th.Gold Technical Analysis:
Daily chart resistance: 3430, support: 3300
4-hour chart resistance: 3400, support: 3334
1-hour chart resistance: 3385, support: 3350.
Gold prices have continued their upward trend since breaking through $3335 last Friday, with an overall bullish outlook. Currently trading around $3356, support lies at $3350, a key defensive barrier for bulls. If this level breaks, gold could fall further to $3328 or even the $3300 mark. Conversely, upward resistance lies at $3385 (previous high), $3400 (round number), and $3430 (trend line resistance). If gold successfully breaks through these resistance levels, it could retest the year's high of $3500. During NY trading, focus on the $3388-3405 range above and the $3350-3334 support range below. Keep an eye on the bull-bear dividing line at 3350!
BUY: 3350
SELL: 3345
SELL: 3385

GOLD 1Hello to all traders. 😎😎
I hope all your deals will hit their targets. 🎉🎉
In my opinion, gold is currently moving within an ending pattern with a slight upward slope. This type of pattern is typically a reversal formation, and I believe it could lead to a drop in gold prices.
At the moment, I think gold might revisit the $3390–$3400 zone, and from there, we could see a deeper decline—first toward the bottom of the ending pattern at $3370, and if the pattern breaks, possibly down to $3340 or even lower.
However, if gold breaks above the $3400 level with strength, this analysis would be invalidated, and we could then expect a move toward the $3440 area.
⚠️⚠️⚠️⚠️Don’t forget to apply proper risk management!
What Do You Think?
Which scenario do you think is happen? **Share your thoughts!** ⬇️
Don't forget that this is just an analysis to give you an idea and trade with your own strategy. And don't forget the stop loss🛑🛑🛑
❤️❤️❤️The only friend you have in financial markets is your stop loss❤️❤️❤️
Please support me with your ✅' like'✅ and comments to motivate me to share more analysis with you and share your opinion about the possible trend of this chart with me 🙏😊
Be Happy , Ali Jamali

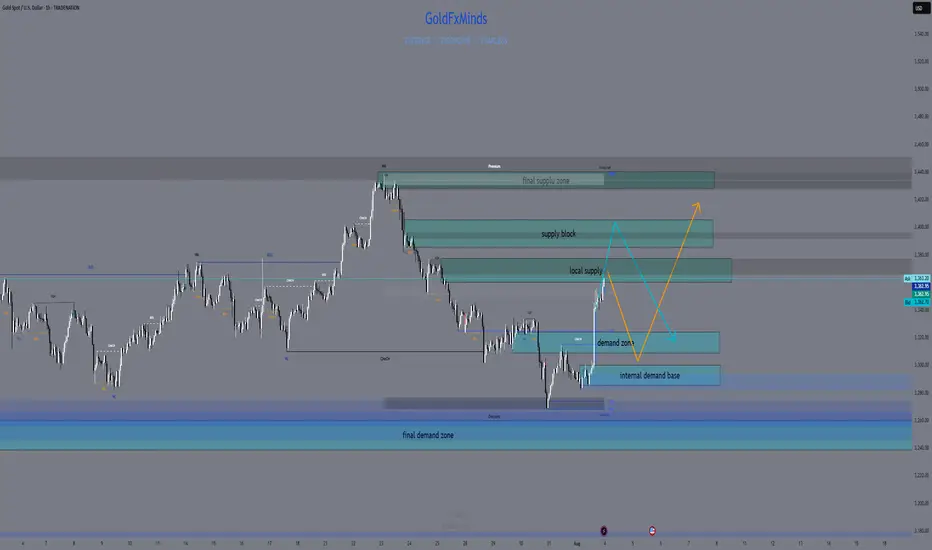
XAUUSD Daily Sniper Plan – August 4, 2025🧠 Macro & Context
Gold is surging back toward premium structure after sweeping 3287. With no major news today, flow is dictated by structure, liquidity, and the residual strength from July’s closing push. Bulls have reclaimed internal control, but are now pressing into major resistance zones. This is the perfect battleground for sniper entries.
🔥 Bias: Bullish short-term, but hitting premium exhaustion
The current candle is testing prior supply and imbalance. Unless we break 3375–3380 cleanly, price remains vulnerable to rejection from premium. Above that, clean air until external zones. Any pullbacks into discount (under 3310) remain buyable — if the structure holds.
🎯 Daily Sniper Zones
🔷 3360–3375 – Decision Supply
📍 Where we are now
This is the current premium pressure zone. Built from a bearish OB + unmitigated imbalance from late July. First contact is live. If price rejects this level, sellers may regain control short-term. But if buyers break and hold above 3375 → bullish expansion is open. This is our Decision Zone.
🔷 3387–3405 – External Supply Block
📍 Premium target for breakout move
Clean HTF OB + imbalance resting above liquidity. If 3375 gives way, this is the next sniper target. Expect strong reaction — either reversal or inducement wick. Ideal for shorts if price shows exhaustion and BOS on LTF.
🔷 3430–3439 – Final Supply Cap (Weekly)
📍 Extreme supply wick
This is the highest defined zone on the Daily/Weekly chart before unknown territory. Full wick zone, untouched since early May. Reactions from here tend to be sharp. A strong rejection could initiate a new sell cycle.
🔷 3310–3325 – Mid-Demand Support
📍 Pullback buy zone
If price rejects 3375 and pulls back, this is the first area to monitor for higher low formation. Built from bullish OB, Fibonacci 50%, and alignment with internal structure. RSI supports buyers here if retested cleanly.
🔷 3285–3300 – Key Reversal Demand
📍 The origin of the current rally
Strong institutional footprint. Last BOS + OB confluence area. Any retest here is valid for sniper buys as long as no bearish HTF shift appears.
🔷 3240–3260 – Final Daily Demand Base
📍 Only valid if structure breaks down
If we lose 3285, this is the last demand zone holding Daily structure. Deep discount + HTF mitigation block. A visit here would require bearish breakdown first.
🧠 Game Plan Summary
⚠️ Right now, we are in a decision zone (3360–3375). Do not rush. Wait for confirmation.
✅ If we break 3375, next bullish target = 3405, then 3439.
🔻 If we reject 3375, watch for controlled retracement into 3325 or 3300 for buys.
⛔️ Do not sell blindly into current price — we are at equilibrium.
💬 If this sniper breakdown sharpened your vision, show some love ❤️
Comment, follow, and hit that like to stay locked in with GoldFxMinds.
More sniper updates dropping 💥
Powered by Trade Nation – for clear structure and no chart noise.
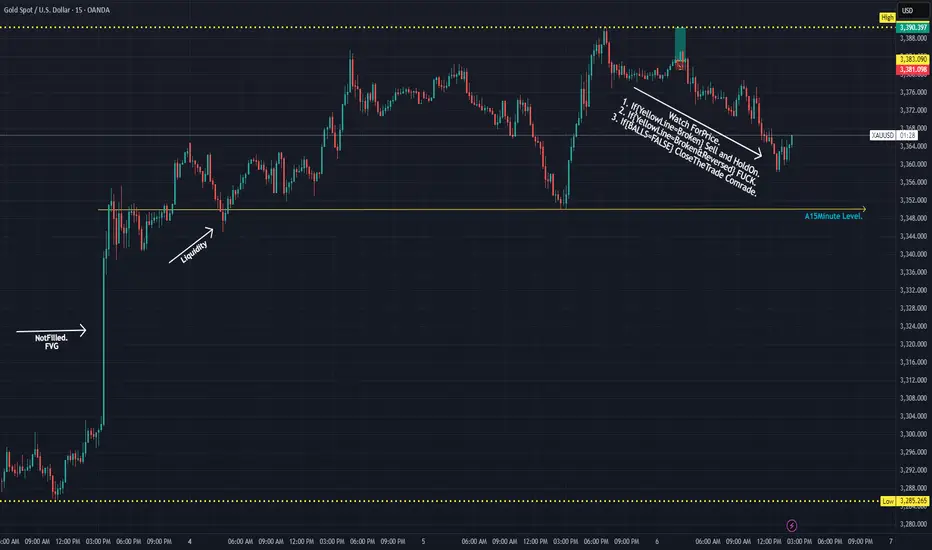
GOLD 15MInute PLan. Enjoy..So the Image is Simple as it is.
Currently @15$ gonna keep trading it.
Started @10$ Last Night.
GOLD BULLS STILL HAVE LAST PUSHBULLS 15M still have power still we have 3414 area need to be tested before we get good correction (BEAR IN MIND GOLD LONG TERM IS BULL)
We will only get this correction if 3414 area holds
Most likely will hold cos i can see 2985 area before we creating new highs for GOLD (2985 AREA WILL BE GOOD PLACE TO BUY AND HOLD)
Any way ONLY TIME WILL TELL
GOOD LUCK

The triangle pattern is about to break through and hit 3400#XAUUSD
Although the price of gold was too high last night due to the rise in risk aversion, the upward momentum weakened significantly in the evening, and it fluctuated sideways at a high level. Gold is currently consolidating within a triangle pattern, with a short-term price increase reaching the triangle's boundary. A break above 3385 could lead to significant intraday gains. Meanwhile, the downside is defending short-term support at 3365. As long as this support level remains intact, the bullish trend remains intact. If the European session gives an opportunity to fall back to the 3375-3365 support area without breaking, you can consider going long and look at 3395-3405, and if it breaks, look at 3415.
Gold (XAU/USD) - Market Structure Analysis Points to Next MoveThe provided 4-hour chart for Gold (XAU/USD) displays a market structure analysis incorporating concepts like Break of Structure (BOS), Change of Character (CHoCH), Fair Value Gaps (FVG), and defined support and target (resistance) levels. The price has shown a recent bullish trend, marked by higher highs and higher lows, confirmed by BOS signals. Currently, the price is consolidating around the 1st support level after reacting to a FVG.
Current Position: Consolidating around the 1st support level (approximately $3,365.028 - $3,353.094).
Support Levels:
1st support: Immediate support zone.
2nd support: Lower support zone ($3,328.619 - $3,320.000).
GL Zone & Support Zone: Confluence of a Golden Level and support ($3,299.096 - $3,290.067).
MAJOR SUP ZONE: Significant historical support area ($3,280.000 - $3,273.685).
Resistance Levels (Targets):
1st TG: Target/resistance zone ($3,392.891 - $3,402.807), containing a FVG.
2nd TG: Higher target/resistance zone ($3,413.659 - $3,423.805), also containing a FVG.
Market Structure: Evident bullish market structure with BOS confirmations, although a recent CHoCH suggests a potential shift or at least a temporary pause in the aggressive uptrend. Multiple FVGs indicate areas where price might find support or resistance.
Potential Trading Scenarios
Bullish Continuation: If the price respects the 1st support level and moves to fill the lower FVG within the 1st TG, a long opportunity could arise targeting the 2nd TG. Confirmation would be a break above the upper boundary of the 1st TG.
Bearish Retracement: If the 1st support fails to hold, the price could retrace towards the 2nd support level. A break below the 1st support and a failure to hold the FVG within the 1st TG would signal this scenario.
Range Trading: The price could consolidate between the 1st support and 1st TG levels, offering short-term trading opportunities within this range.
Explanation of Specific Elements
BOS (Break of Structure): Indicates a continuation of the current trend. A bullish BOS occurs when the price makes a higher high, confirming the uptrend.
CHoCH (Change of Character): Suggests a potential shift in the market's behavior. A bearish CHoCH after a bullish trend might indicate weakening buying pressure and a possibility of a reversal or a significant pullback.
FVG (Fair Value Gap): Represents an inefficiency in the market where there were aggressive price movements with less trading volume on one side. These gaps can act as future support or resistance levels as the market often tries to fill them.
Support Levels: Price levels where buying pressure is expected to outweigh selling pressure, potentially halting a downtrend.
Target/Resistance Levels (TG): Price levels where selling pressure is expected to outweigh buying pressure, potentially halting an uptrend.
GL Zone & Support Zone (Golden Level): This likely refers to a support level coinciding with a Fibonacci Golden Ratio level, often considered a high-probability reversal zone.
MAJOR SUP ZONE: A significant historical support level where strong buying interest has been seen in the past.
TradingView "Publish Idea" Post Based on the Chart
Title: Gold (XAU/USD) - Bullish Structure Consolidating at Support with Breakout Potential
Analysis:
Gold (XAU/USD) on the 4-hour timeframe shows a clear bullish market structure confirmed by multiple Breaks of Structure (BOS). After a strong upward move, the price is currently consolidating around the 1st support level ($3,365.028 - $3,353.094), which also aligns with a Fair Value Gap (FVG).
The presence of a recent Change of Character (CHoCH) suggests that the aggressive bullish momentum might have temporarily subsided, and we could be seeing a period of accumulation before the next move. The price action within the FVG near the 1st TG ($3,392.891 - $3,402.807) will be crucial.
Potential Scenarios & Trading Plan:
Bullish Continuation: If the 1st support holds and the price breaks above the upper boundary of the FVG within the 1st TG, it would signal a likely continuation of the bullish trend.
Long Entry: Upon a confirmed breakout above $3,402.807.
Target 1: The 2nd TG zone ($3,413.659 - $3,423.805), which also contains a FVG.
Stop Loss: Place below the 1st support level (e.g., below $3,353.000) to manage risk.
Bearish Retracement: Failure to hold the 1st support could lead to a deeper retracement.
Short Entry: On a confirmed break below $3,353.000.
Target 1: The 2nd support zone ($3,328.619 - $3,320.000).
Stop Loss: Place above the 1st support level.
Key Levels to Watch:
Support: $3,365.028 - $3,353.094, $3,328.619 - $3,320.000, $3,299.096 - $3,290.067.
Resistance (Targets): $3,392.891 - $3,402.807, $3,413.659 - $3,423.805.

GOLD: Local Bearish Bias! Short!
My dear friends,
Today we will analyse GOLD together☺️
The in-trend continuation seems likely as the current long-term trend appears to be strong, and price is holding below a key level of 3,375.02 So a bearish continuation seems plausible, targeting the next low. We should enter on confirmation, and place a stop-loss beyond the recent swing level.
❤️Sending you lots of Love and Hugs❤️

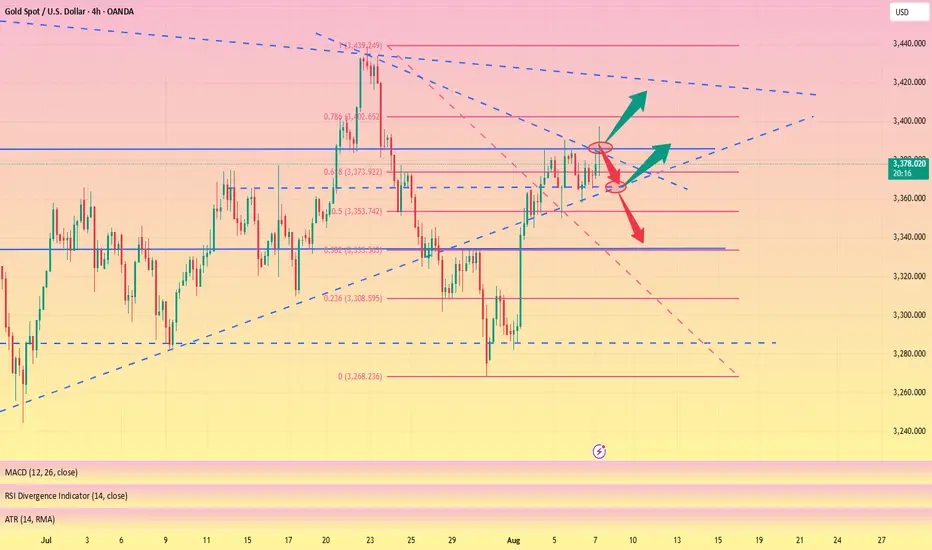
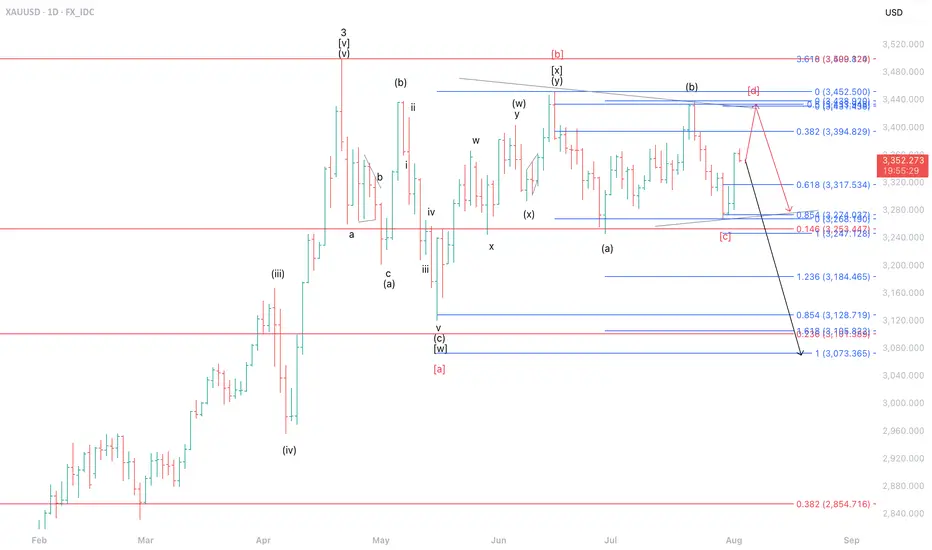
Potential Reversal After Complex CorrectionThe current movement of gold (XAUUSD) is estimated to be forming part of wave ii of wave (c) of wave under the black label scenario. This implies that XAUUSD has the potential to undergo a deeper correction, targeting the 3,073–3,184 range.
However, under the alternative red label, the price action appears to be developing a triangle pattern as part of wave of wave 4. In this scenario, XAUUSD still holds the potential for further upside toward the 3,394–3,438 area, which also coincides with a Fibonacci cluster zone, serving as a critical resistance region.
Gold-Buy ScenarioChange of structure, ABC retracement formation, Inverse Heed and shoulders formation and bullish flag formation

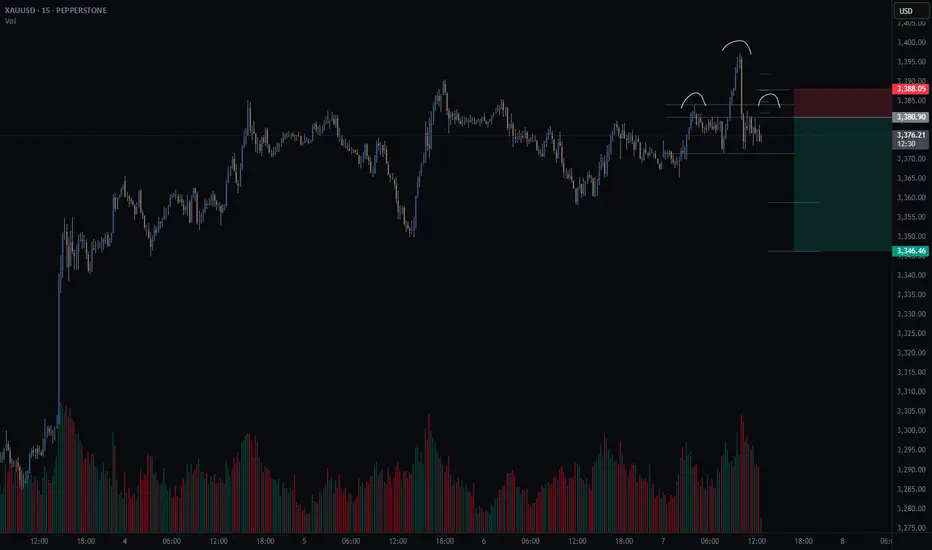
Gold short – Head and Shoulders Setting Up on 15min?There’s a potential head and shoulders pattern forming on the 15-minute chart.
📌 What I’m watching for:
A 15min candle close back inside the neckline range
Lower volume on the right shoulder vs. the left (to confirm weakening momentum)
🧠 Trade Idea (Short bias)
🎯 Entry: 3380.9
❌ Stop Loss: 3388.0
✅ Take Profit 1 (50%): 3358.9
✅ Take Profit 2 (50%): 3346.3
⚖️ Risk/Reward: 3.8R
This setup lines up with my trading method that focuses on structure, volume, and clean risk/reward.
🤔 What are your thoughts on gold today?
Are we about to roll over — or will bulls push through resistance?
short term selling (scalp) xau usd (gold)sell from 3375, target 3365/3355-
SL will be 3380
plesee note: trend is bullish. and this trade is against the main trend but this will be traded with half of the lots size..
XAUUSD Update 03 Augt 2025 BOUNCINGAs we knew on last weekend, price has bounced from 3267 level. It wont touch 3245-50 as a support.
From this reaction, we will follow on this week, is the price will break 3378 resistance ?
Is the price will retest 3400 level again and again ?
And if it so, it seemlikes a bullish momentum.
Just becarefull, waiting for the price make a correction first.
Have a blessing week ahead !

SELL THE RALLIES ON GOLD 🟡 Gold Daily Time Frame Analysis
🔍 Market Structure Overview
Gold has been consolidating in a broad range near its all-time highs, indicating a bullish exhaustion. This prolonged sideways movement is characteristic of a distribution phase, often preceding a potential trend reversal.
The current price action lacks strong directional momentum, as buyers appear exhausted near record highs.
The distribution pattern implies that institutions may be preparing to offload long positions and potentially build short positions for a future bearish move.
---
🟥 Red Rectangle – Resistance Zone (Potential Distribution Area)
Price has repeatedly tested this zone without a successful breakout.
This zone likely contains heavy sell-side liquidity and institutional supply.
Key Resistance Levels within this zone:
$3,400
$3,425
$3,480
This repeated failure to break higher reinforces the possibility of a trend reversal from this area.
---
🟦 Blue Rectangle – Minor Support (Liquidity Engineered Zone)
Gold is reacting to this minor support zone, showing temporary buying interest.
This may indicate that institutions are building liquidity, luring in buyers to drive price back toward the red zone.
Once sufficient liquidity is accumulated, smart money may offload remaining long positions into resistance, and initiate a bearish trend.
Key Support Levels:
$3,300 – immediate minor support
$3,200
$3,100
$3,000 – major psychological and technical support
---
📈 Institutional Price Behavior
This price behavior aligns with Wyckoff Distribution Theory, where:
Price consolidates near the top
Demand weakens
Institutions offload to late buyers
Downtrend begins after liquidity sweep or Upthrust (UTAD)
---
🧠 Conclusion
Gold’s ranging structure near ATH suggests we may be in a distribution phase. The reaction to the minor support implies a liquidity-building move to draw price back to resistance before a potential markdown phase (bearish trend) begins.

Time is equal to price !Will gold visit again the LL at 3268 or it will pull back from 3340/3344 !
If so we may see gold making a new top at 3400 /3450/3500/3550/3600 .

XAUUSDGold (XAUUSD) has been undeniably one of the most rewarding instruments to trade this year. Whether that be longs or shorts.
Well, after the latest drop let’s be clear on one thing…. There is another big one to come.
There is a 4 year cycle of behaviour to not be ignored. Question, what happened this time in the Gold charts 4 years ago?
If you know the answer then you need to be setting up for sells.
Of course there have been many highs made this year and some are anticipating a new ATH before the drop. It is possible based on price action in 2025.
If history is to repeat itself, the open of Asian Session tonight (030825) could see a continuation up of the explosion up of Friday (010825). This should result in the sweeping out of stop losses of any sells that have been held over the weekend.
The closure of the sells will create buying pressure sending price further up to retest at least the most significant swing high. At and from this level and a few more above, we can look out for sustained selling to break below 3300 and beyond.
It is just theory at this point but should be taken into account.
Potential sell areas:
3368-3370
3378-3380
3400-3405
3412-3416
3428-3430
3433-3438
3444-3450
Of course risk management is key. But from the highest point that price reaches early next week could be the start of a very good sell.
All entry zone me should have an initial 1:2RR while holding partial sells with extended TPs as far as 3233,3217,3198,3159,3099.
Good luck 🤞
This is not financial advice and should be taken with a pinch of salt.

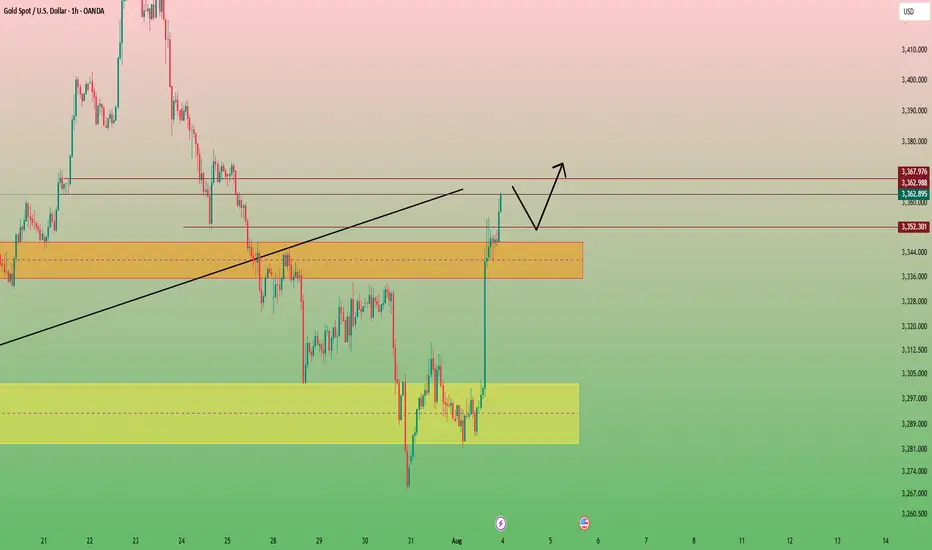
Gold – Party’s Over… or Just Getting Started?Yesterday was… interesting, but honestly, not that surprising. Price shot up to 3385 like it was chasing the last drink at a party. The real question now is: what happens after the party? Because today, the confetti’s still in our hair, but someone has to clean up this mess.
This analysis will go deeper than usual, because we’ve got geopolitical drama on the horizon that could seriously shake up the price of gold.
The Setup – Trend or Just a Power Nap?
Gold is taking a breather – not the end of the trend, just a little post-party nap. The 1-hour EMAs are still pointing upwards, but there’s a slight hesitation showing. Watch the 50 EMA (the orange one) – that might be the judge and jury for gold’s fate. If price breaks below, we could see a quick visit to the 3340 zone.
Trend strength? Still strong at 41. Translation: The party isn’t over yet. But on the 1-hour chart, this bullish move is starting to lose steam – trend strength is above the horizon but flattening. What’s more, our short line is sneaking up toward the horizon too… if price dips further, that line might peek above. That’s a classic “trend fatigue” signal – like a boxer taking a breather between rounds.
Yesterday RSI punched through the overbought zone, then promptly got smacked down from 3385. Now it's calmly drifting lower. Currently, RSI is below the 4-hour RSI-EMA, which is a shortish sign… but hey, we never enter trades based on RSI alone, right? 😉
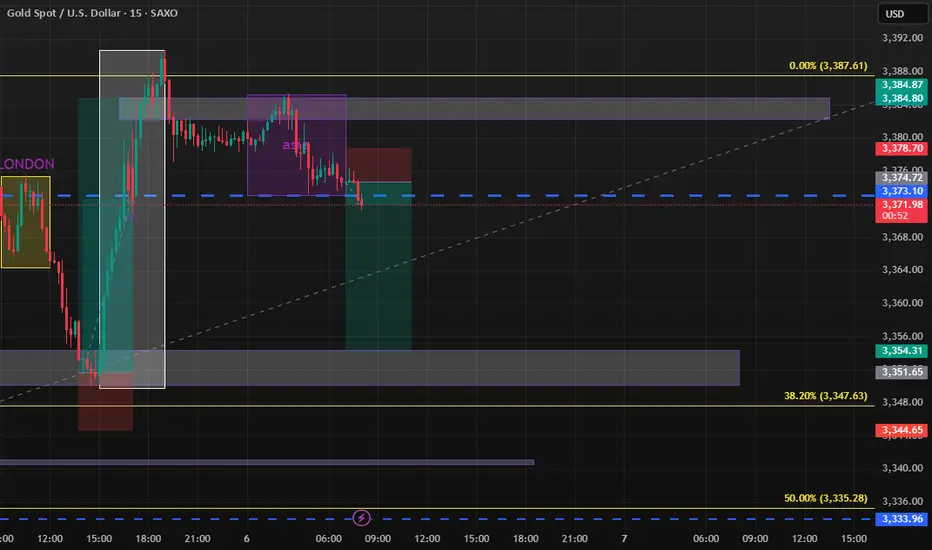
Bonus: That Fair Value Gap (FVG)
Gold left us a beautiful FVG on the chart – like bulls sprinting so fast they spilled their coffee on the carpet. This created a “gap” around 3300–3340. Markets hate mess. They’re perfectionists. And they often go back to clean up spilled coffee before moving on. This gap will likely be filled – the only question is: when?
Will we get it today? Not likely.
But hang tight… we’re not done.
🔮 My Take…
Today I expect a gentle slide. Price feels drawn to 3355 like a moth to flame. 3340 looks like solid support, if price decides to keep sliding. Do I think we’ll fill the entire FVG today? Nah. There’s not enough momentum behind this right now.
But there’s a wild card: the Geopolitical Joker.
If Israel launches a full-on ground offensive in Gaza, that’s like tossing a boulder into a calm lake.
War = Uncertainty = FEAR.
And fear drives money into gold like it’s a medieval castle during a dragon attack.
When fear hits, RSI doesn’t matter. FVG? Forget it. EMAs? Irrelevant.
Money flees risk assets (stocks, crypto) and dives headfirst into the safety of gold.
Two Battle Plans Ahead:
1. The Cleaning Crew Scenario:
No geopolitical drama yet. Price slides gently, fills part of the FVG, maybe tests 3340. If we reach 3330, gold might chill there, gather strength at the 3315 support, and maybe bounce for a new bullish run.
2. The Iron Dome Scenario:
The news hits. Boom. Fear skyrockets. Gold ignores all technicals, skips the cleaning, and rockets toward 3400, maybe even 3440. No questions asked.
What Would I Do Today?
Time for the sniper strategy.
No chasing the herd. No standing in front of a speeding train.
We wait for clear signals.
Buying now? Risky – price might retrace.
Shorting in this bullish mess + geopolitical tension? Market suicide.
Patience is key. If price just chops sideways while everyone holds their breath over the headlines… entering a trade now could backfire spectacularly.
Not financial advice – just a gold-obsessed human sharing thoughts.
What about you?
Will gold clean up the mess, or will the fear-fueled stampede into gold send us sky-high?
And now… for my fellow gold-hunters, the same analysis in Hungarian, because some things just hit harder in your mother tongue
A tegnapi nap érdekes volt, de lehetett rá számítani. Most az a kérdés mi jön a buli után mert 3385-ig felnyomták az árat. A mai elemzés kicsit részletesebb lesz mert vannak geopolitikai hírek ami nagyon befolyásolhatja az arany árát. A jelenlegi megpihenés még nem a trend végét jelenti, csak rápihenés a tegnapi bulira. Konfetti még a hajakba, de rendetlenséget hagytak, így a takarítás ideje jött el. Az EMA-k az 1 órás charton felfelé trendet mutatnak, de ott is látszik egy kicsi megtorpanás. Az 50-es EMA (narancssárga) lehet az a pont, ami eldönti az arany sorsát. Ha átszakítjuk, akkor jöhet a 3340-es szint.
Arena TrendIQ: A trenderő még mindig erős. 41-es értékkel mutatja, hogy itt nincs vége a bulinak. Jelenleg a felfelé menő trend kezd gyengülni az 1 órás charton de még a horizont felett van. Ami érdekes hogy a short vonalunk is megközelítette a horizontot. Ha még lejjebb fog ereszkedni az ár akkor mennyire befigyel horizont fölé.
Arena RSI: Tegnap is benéztünk a túlvett szint felett azóta szépen csorog lefelé ami látszik a charton is. Felszúrt 3385-ig túlvett szint megvolt majd kapott egy pofont és lefelé vette az irányt. Jelenleg a 4 órás RSI-EMA alatt van, ami önmagában shortos jel, de csak RSI-re nem lépünk be pozícióba.
Mit látunk még? Azt hogy hagyott nekünk egy szép FVG-t az aranyunk. A bikák annyira siettek felfelé, hogy "kiöntötték a kávét" a szőnyegre. Ez a grafikonon egy üres terület, egy "rés", amit az árfolyam otthagyott maga után (kb. a 3300-3340 közötti zónában). A piac pedig perfekcionista, utálja a rendetlenséget és a foltokat. Nagyon gyakran visszatér, hogy feltakarítsa maga után kiöntött kávét, és még tovább menne. Ezt hívjuk Fair Value Gap (FVG) betöltésnek.
Számíthatunk rá? Hogy a viharba ne... De nem ma!
🔮szerintem...
Ma finom lecsorgás lesz a piacon. A 3355-ös szint vonzza most az árfolyamot. A 3340-es sáv jó támasznak ígérkezik, ha tovább szeretne lefelé menni. Szerintem ma nem tölti be a teljes FVG-t, mert nincs mögötte ebben a pillanatban azaz erő, ami odáig levinné az árat. És van itt még valami, ami totál áthúzhatja a szép finoman lecsorgás elméletét, ami nem más, mint a Geopolitikai Joker. Ha Izrael valóban megindítja a szárazföldi hadműveletet, az egy hatalmas kő a tóba dobva. A mechanizmus: Háború és bizonytalanság = FÉLELEM. A félelem pedig a befektetőket a legősibb menedékbe, az aranyba hajtja. Ilyenkor nem számít az RSI, az FVG, vagy a mozgóátlag. A pénz a kockázatosabb eszközökből (pl. részvények, kripto) az aranyba menekül. Az arany ilyenkor olyan mint a viharban a stabil, masszív kőház. Amikor kint dörög az ég és villámlik, mindenki oda akar bejutni, biztonságba. Most van két forgatókönyvünk tehát, így a helyzet ravasz és furfangos. A technikai kép egy kisebb, egészséges visszahúzódást, a "takarító hadműveletet" valószínűsíti. A fundamentális kép pedig ennek az ellenkezőjét.
A Takarító Brigád Forgatókönyv: A geopolitikai helyzet nem szól bele azonnal. Az árfolyam szépen lecsorog, hogy feltöltse az FVG egy részét, de a 3340-ig totál egészséges lenne. Ha meg lesz a 3330 ott erőt gyűjthet esetleg az alatta lévő 3315-ös támaszon és onnan indulhatna egy új stabilabb emelkedésnek.
A Vaskupola Forgatókönyv: Jön a hír... A félelem-faktor az egekbe szökik. Az arany ignorál minden technikai szintet elfelejti a takarítást és azonnal kilő célba véve a 3400-as, majd a 3440-es szinteket.
Én mi tennék ma? A legjobb stratégia most a "lesben álló mesterlövése". Nem rohanunk a csorda után és nem is állunk a vonat elé. Megvárjuk, amíg a piac dönt. A jelenlegi szintről vásárolni kockázatos a visszahúzódás miatt. Shortolni pedig egy ilyen bikás trendben és geopolitikai helyzetben öngyilkosság. Várjunk a jelekre, mert ha csak simán oldalazás lesz se le, se pontosan azért mert mások is figyelnek a háttérre, akkor nagyon megszívhatjuk. Ez nem befektetési tanács, csak egy aranyrajongó véleménye. Ti hogyan látjátok? Jöhet a takarítás, vagy a menedék aranyban most mindent visz?

XAUUSDXAUUSD longterm its going to 5K
Short/midterm its going to 3500
H4 still on a consolidation.
The best thing to do is to wait for the end of the summer.

Gold is under pressure. Can the upward trend continue?On Thursday, gold rose rapidly in the European session, reaching around 3397, but failed to successfully break through the 3400 integer mark; it currently fell back slightly and fluctuated around 3375. Judging from the 4-hour chart, the price is currently running close to the middle track of the Bollinger band; since the market opened this week, the gold price has continued to run above the middle track of the Bollinger band. Despite the slight decline, it has remained within the upward trend channel and has continuously set new highs.
The current upward pressure position remains at 3390-3400, and the key support level is around 3370, which is also the crossover position of the current MA5, 10, and 20 moving averages. The RSI indicator remains above its midline, indicating that bullish momentum remains.
Quaid believes that as long as the price remains above 3370 in the US session, any pullback will be a sign of accumulating upward momentum. Gold still has the trend of hitting the 3400 integer mark.
Trading strategy:
Go long near 3370, stop loss at 3360, profit range 3380-3390-3400.
Short near 3400, stop loss at 3410, profit range 3375-3365-3355.

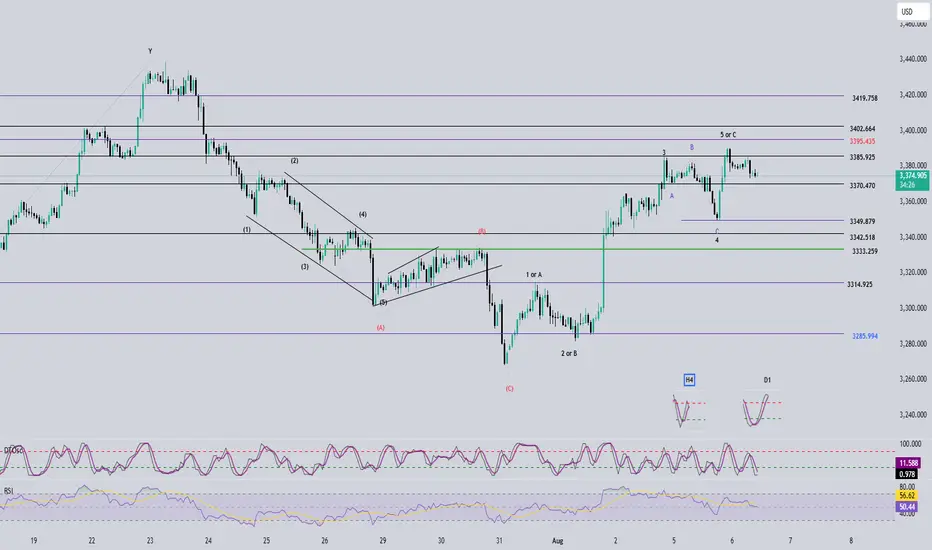
Elliott Wave Analysis – XAUUSD August 6, 2025📊
________________________________________
🔍 Momentum Analysis
• D1 Timeframe:
Daily momentum is showing signs of a potential bearish reversal. However, we need to wait for today’s candle to close to confirm the signal. While waiting for confirmation, price may still experience a minor upward move on lower timeframes, but the current bullish momentum is weak and unlikely to extend far.
• H4 Timeframe:
Momentum is also preparing to reverse. We need to observe the current H4 candle for confirmation. Notably, the reversal signal is forming just below the overbought zone, suggesting there may be one more upward push before a potential decline.
• H1 Timeframe:
Momentum is approaching the oversold zone. It may take 1–2 more bearish candles before a short-term bullish rebound occurs.
________________________________________
🌀 Elliott Wave Structure Update
Yesterday’s bullish move was disappointing — instead of pushing directly to the 3402 or 3419 target zones to complete Wave 5, price only broke slightly above 3385 before reversing. This behavior complicates wave analysis by introducing conflicting possibilities.
We currently consider two main scenarios:
Scenario 1: Wave 5 is not yet complete
• Given that D1 momentum is preparing to reverse downward, it’s unlikely that the current move is Wave 1 of Wave 5. A more likely scenario is that Wave 3 of Wave 5 has completed and price is currently in Wave 4.
• The current corrective structure has stopped at the 0.382 Fibonacci level. As long as price remains above 3370 (the 0.5 Fib level), this strengthens the case for a Wave 4 retracement before another leg up in Wave 5.
• Since bullish strength appears limited, we now focus on two main target zones for Wave 5: 3395 and 3402, instead of the previous high at 3419.
Scenario 2: Full 5-wave structure is complete – now in correction
• If the 5-wave pattern has already finished, the current decline marks the beginning of a corrective phase.
• With current momentum conditions, this is still a viable scenario. However, due to the remaining upside possibility, we recommend waiting for today’s D1 candle to confirm momentum before taking any trade.
________________________________________
📌 Trade Plan
For experienced traders:
• Wait for price to reach the 3395–3402 zones.
• Look for reversal signals in those areas to enter short positions.
Suggested trade plan for newer traders:
• Sell Zone: 3395 – 3398
• Stop Loss: 3408
• Take Profits:
o TP1: 3385
o TP2: 3370
o TP3: 3349
________________________________________
✅ Note:
This trade plan should be reassessed after today’s D1 candle closes for confirmation of the momentum shift.