Gold Bullish intradayOverall bias is bullish on gold for today . im looking at price to break out of this wedge and either retest the zone where there was volume or it may just shoot up . im already in the trade but this could ne another entry up with stop loss a few pips as buffer beneath the zone .
GOLD trade ideas

Smart Money Concept (SMC) XAU/USD Bearish Analysis – SMC
1. Market Context
The price is coming off a bullish expansion that mitigated areas of interest, but failed to break through supply structures with force, leaving an imbalance (FVG 4H) and pending liquidity at lower levels.
2. Consolidation Zone
After the surge, the market entered a consolidation phase (accumulation/distribution), forming BOS and ChoCh without generating new HH, a sign of buying weakness.
3. Fake Out and Rejection
A fake out trapped buyers and the price returned to the range, indicating liquidity absorption by institutional investors.
4. Bearish Interest
The previous LL and LH levels were not mitigated and act as price magnets. This creates bearish interest, with a high probability of seeking that liquidity.
5. Trading Plan
• Entry: Rejection at the resistance zone
• Confirmation: Failed retest and rejection (SMA rejection)
• Target: Next LL at the support zone
• Stop Loss: Above the resistance zone/fake out
Summary: The price is showing a distribution structure with accumulated liquidity below the support, increasing the probability of a bearish continuation.
GOOD LUCK TRADERS….

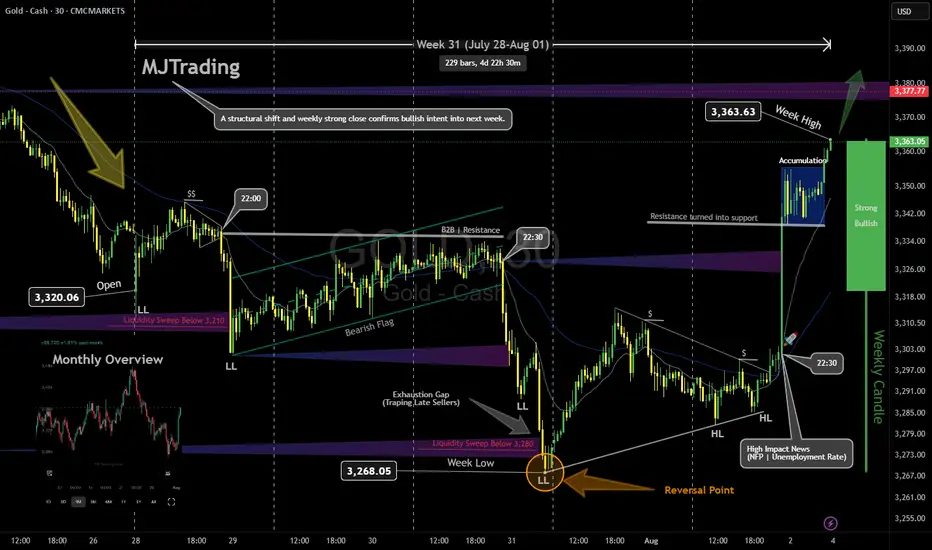
GOLD Weekly Recap & Outlook (Week 31 | July 28 – Aug 01)Note: Some elements may shift depending on your screen size. View the full snapshot in perfect layout:
📈 CAPITALCOM:GOLD
Timeframe: 30m | MJTrading View
⸻
🔹 Weekly Performance
• Open: 3,320.06
• High: 3,363.63
• Low: 3,268.05
• Close: 3,363.05
Gold delivered a classic Smart Money move this week: liquidity sweep, structural shift, and bullish expansion.
⸻
🔹 Price Action Breakdown
1️⃣ Early Week: Bearish Continuation
• Price opened around 3,320 with a gap and extended last week’s bearish leg.
• Formed lower lows (LL) and a bearish flag, signaling continuation.
2️⃣Midweek: Liquidity Grab, Reversal Point and
• Last Bearish leg marks the exhaustion gap and stop run.
• Market printed a liquidity sweep below 3,310 then 3,280 (weekly low), trapping late sellers.
• Smart Money likely absorbed sell-side liquidity before initiating the reversal leg.
• This aligns perfectly with SMC principles: sweep → accumulation → expansion.
3️⃣ Late Week Rally
• Following NFP & Unemployment Rate news, price broke 3,333 and rallied strongly to 3,363.63 confirming a Bullish Market Structure Shift (MSS).
• Resistance turned into support, validating the accumulation phase.
• Price rallied strongly to 3,363.63,.
• The weekly candle flipped bullish, closing near the high, with Smart Money leaving a clear footprint of accumulation and expansion.
⸻
🎯 Key Levels & Outlook
• Support: 3,355 → 3,333 - 3,340
• Resistance: 3,377 → 3,380+
• Bias: Bullish above 3,333.
• Watch for liquidity sweeps of intraday lows to catch new long entries, targeting 3420-3440.
⸻
💡 MJTrading View:
A structural shift and weekly strong close confirms bullish intent into next week.
As long as 3,333 holds, dips are buying opportunities.
⸻
Please share your opinions...
#MJTrading #GoldAnalysis #SmartMoney #LiquiditySweep #PriceAction #MarketStructure #Forex #TradingView #ChartDesigner #BullishMarket
Fortnight Overview:
Psychology Always Matters:
GOLD short term Analysis. - 15 mins. Gold (XAU/USD) – Harmonic Pattern Analysis (15m Chart)
As of: August 5, 2025
🔶 Pattern Observed: Bearish Harmonic (likely Gartley or Butterfly)
Pattern Completion: Near 3385–3390 zone
The price has tested the PRZ (Potential Reversal Zone) and started showing early signs of weakness.
A clear "Short only below here" marker is drawn just below 3370, signaling key support.
🔻 Short Trade Thesis:
If price breaks and sustains below 3370, bearish confirmation is triggered.
This confirms the harmonic pattern's validity and opens the path for impulsive downside targets.
🎯 Downside Targets (if 3370 breaks):
First target: 3310–3320
Second target: 3265–3270
Final target (extended move): 3180–3200
⚠️ Invalidation:
If price breaks above 3395–3400, the harmonic setup is invalidated.
In such case, avoid any short setups and re-analyze price action for new trend direction.
Conclusion:
This harmonic pattern suggests a high-probability short setup below 3370, with clean targets mapped out. However, it's critically important to wait for confirmation (break and retest or strong momentum candle) before entry. If the price starts moving up from current levels without breaching 3370, this setup becomes invalid.
⚠️ Disclaimer:
This analysis is for educational and informational purposes only and should not be considered as financial advice. Trading commodities and financial instruments involves significant risk and may not be suitable for all investors. Please perform your own due diligence or consult with a licensed financial advisor before making any trading decisions. The author is not liable for any losses incurred based on this analysis.

Gold Poised for a Surge: 3400 in Sight, 3430 Within ReachToday, gold retreated to a low of around 3350 before rebounding again, reaching a high of around 3390. During this process, we seized the opportunity to go long on gold near 3356 and closed the trade by successfully hitting TP: 3380, making a profit of 240 pips!
Although gold retreated after reaching 3390, I had originally planned to short gold near 3395, but gold didn't reach that level during the rally, so our shorting plan had to be shelved. Currently, it's trading in a narrow range around 3380. Clearly, I'm not considering shorting gold after a pullback.
Although gold retreated to around 3350 during the day, it did not destroy the current bullish structure of gold. In addition, gold regained the 3370-3375 area again during the rebound, and the gold bulls became even stronger. Therefore, I have now lost the desire and interest to short gold. Gold has currently reached a high near 3390. Given its current structure and strength, I don't believe 3390 is the current high. Gold is likely to attempt to break through 3400, and even has the potential to continue its rise to the 3420-3430 range. As the center of gravity of gold shifts upward, the current short-term support has moved up to the 3375-3365 area; and the relatively strong support is located in the 3360-3350 area.
Therefore, for short-term trading, I prefer to start trying to go long on gold after it retreats to the 3375-3365 area, and expect gold to hit 3400 as expected, or even continue to the 3420-3430 area.

GOLD NEXT MOVE (expecting a mild bullish(24-07-2025)Go through the analysis carefully and do trade accordingly.
Anup 'BIAS for the day (24-07-2025)
Current price- 3357
"if Price stays above 3345, then next target is 3370, 3320 and 3400 and below that 3330 and 3310 ".
-POSSIBILITY-1
Wait (as geopolitical situation are worsening )
-POSSIBILITY-2
Wait (as geopolitical situation are worsening)
Best of luck
Never risk more than 1% of principal to follow any position.
Support us by liking and sharing the post.

GOLD 1H CHART ROUTE MAP UPDATE & TRADING PLAN FOR THE WEEKHey Everyone,
Please see our updated 1h chart levels and targets for the coming week.
We are seeing price play between two weighted levels with a gap above at 3348 and a gap below at 3328 . We will need to see ema5 cross and lock on either weighted level to determine the next range.
We will see levels tested side by side until one of the weighted levels break and lock to confirm direction for the next range.
We will keep the above in mind when taking buys from dips. Our updated levels and weighted levels will allow us to track the movement down and then catch bounces up.
We will continue to buy dips using our support levels taking 20 to 40 pips. As stated before each of our level structures give 20 to 40 pip bounces, which is enough for a nice entry and exit. If you back test the levels we shared every week for the past 24 months, you can see how effectively they were used to trade with or against short/mid term swings and trends.
The swing range give bigger bounces then our weighted levels that's the difference between weighted levels and swing ranges.
BULLISH TARGET
3348
EMA5 CROSS AND LOCK ABOVE 3348 WILL OPEN THE FOLLOWING BULLISH TARGETS
3369
EMA5 CROSS AND LOCK ABOVE 3369 WILL OPEN THE FOLLOWING BULLISH TARGET
3397
EMA5 CROSS AND LOCK ABOVE 3397 WILL OPEN THE FOLLOWING BULLISH TARGET
3422
BEARISH TARGETS
3328
EMA5 CROSS AND LOCK BELOW 3328 WILL OPEN THE FOLLOWING BEARISH TARGET
3305
EMA5 CROSS AND LOCK BELOW 3305 WILL OPEN THE SWING RANGE
3289
3267
As always, we will keep you all updated with regular updates throughout the week and how we manage the active ideas and setups. Thank you all for your likes, comments and follows, we really appreciate it!
Mr Gold
GoldViewFX

Why do you always miss the real opportunities?Judging from the current gold trend, gold rose to a high of around 3368 and then entered a narrow range of fluctuations. Our previous long plan failed to continue to hold at the high level. Although some brothers may feel regretful, the market is always full of variables. We must flexibly adjust our thinking according to market changes. At present, there is a need for a retracement on the technical side. This retracement is not a trend reversal, but provides space for subsequent bullish momentum. Overall, the bullish trend is still dominant, but the current price is approaching the important pressure area of 3370-3385. The short-term carrying capacity has weakened, and it is not advisable to chase highs blindly. It is recommended to be cautious at high levels in operations. In the short term, it can be given priority to try to intervene with short positions in batches in the 3370-3385 area, waiting for a technical correction. If it subsequently retraces to the key support area of 3350-3335 and stabilizes, you can consider the long position layout again and continue to participate in the main bull trend.
Gold operation suggestion: short in batches in the 3370-3385 area, with the target at 3355-3350. If it falls back to the 3350-3335 area and stabilizes, consider entering a long position at the right time.
Gold Surges on Non-Farm Data; 3330 Key Next WeekGold was strongly boosted by the significantly bullish non-farm payroll data, surging sharply like a rocket 🚀, with gains that completely "wiped out" all the weekly losses. The current gold trend, as if injected with super momentum, has completely broken the previous long-short stalemate. Starting from the 3300 level, it has been breaking through obstacles all the way up to 3350. At present, 3330 is like a critical "battleground" ⚔️ fiercely contested by both long and short sides.
This week, when gold was still "lingering" below 3300, I emphasized repeatedly that a rebound was inevitable – we just needed to stay calm and wait for the opportunity. As it turns out, our judgment was spot on, and we successfully took profits around 3340, reaping good gains 💴. Now, gold prices are oscillating back and forth in the 3340-3350 range. Based on a comprehensive analysis of the current trend, I boldly predict that gold is likely to pull back to around 3330 next week, so everyone can prepare in advance 🤗
⚡️⚡️⚡️ XAUUSD ⚡️⚡️⚡️
🚀 Sell@ 3350
🚀 TP 3330 - 3320 - 3310
🚀 Buy@ 3300 -3310
🚀 TP 3320 - 3330 - 3340
Daily updates bring you precise trading signals 📊 When you hit a snag in trading, these signals stand as your trustworthy compass 🧭 Don’t hesitate to take a look—sincerely hoping they’ll be a huge help to you 🌟 👇

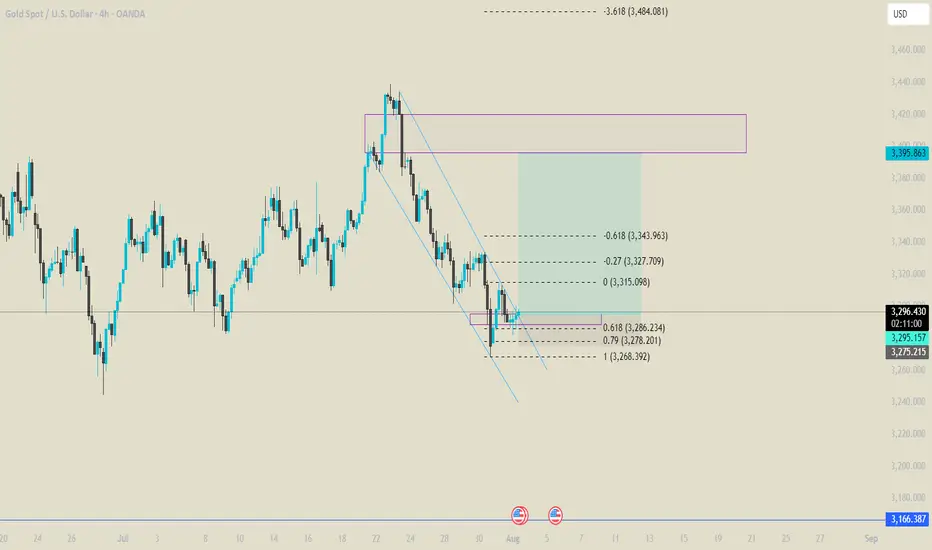
July 31, 2025 - XAUUSD GOLD Analysis and Potential OpportunitySummary:
The Fed held interest rates unchanged, and Powell’s remarks reduced the likelihood of a rate cut in September — this is fundamentally bearish for gold. Until new fundamental developments emerge, the strategy remains: sell on rallies into resistance.
After reviewing the 4H chart, I see two possible scenarios:
Price continues down to 3245, pulls back to 3283, then resumes the drop toward 3245 or even lower.
Price pulls back immediately toward 3300, then resumes the downtrend toward 3245.
These are ideal cases — I will still wait for clear confirmation before taking action.
🔍 Key Levels to Watch:
• 3323 – Resistance
• 3309 – Resistance
• 3300 – Psychological level
• 3283 – Key resistance
• 3268 – Short-term support
• 3260 – Support
• 3245 – Major support
• 3233 – Support
📈 Intraday Strategy:
• SELL if price breaks below 3268 → target 3265, then 3260, 3255, 3250
• BUY if price holds above 3283 → target 3289, then 3295, 3300, 3305
👉 If you find this helpful or traded using this plan, a like would mean a lot and keep me motivated. Thanks for the support!
Disclaimer: This is my personal view, not financial advice. Always use proper risk control.
Gold Trade Plan 06/08/2025Dear Traders
I am expecting a drop in gold to the targets of 3309 and 3282. I see a pattern on the chart, and if the price doesn't fix above 3390, a drop to 3290 and 3282 is inevitable.
First Target : 3330
Second target : 3309
third Target : 3290
Regards,
Alireza!

Gold long from 3295I think this might be the bottom .
Next week gold will be sitting at 3400$ level.
GOLD RAID ON – Bullish Limit Orders Are LIVE! XAU/USD💰GOLD HEIST IN PROGRESS! XAU/USD BULLISH RAID BEGINS! 🏴☠️📈
Asset: XAU/USD – Gold vs U.S Dollar
📊 Plan: BULLISH ROBBERY
🎯 Target: 3460.00
🛑 Stop Loss: 3330.00
📥 Entry: ANY level – vault is wide open!
👑 THIEF MODE ACTIVATED – Time to raid GOLD like a pro. We’re stacking multiple limit orders (layering entries) just like setting traps for those greedy bears 🐻💥
🚪💼 Entry strategy:
“The vault is unlocked – grab your bag and go!”
Place buy limits at recent swing lows (15m/30m) or jump in live with your bullish crew. Use alerts to catch price at key pullback zones.
🛑 SL placed at: 3330 – Just below thief territory. Adjust based on your lot size + number of entries 🔐
🎯 Target: 3460 – Hit and run, or trail that SL and let the gold rain! ☔💸
🧠 Thief Tactics for GOLD:
Only trade Long-side – scalpers, swing traders, all aboard 🚂
Use trailing SL to protect your loot
Avoid trading during high-impact news (CPI, NFP, Fed, etc) ⚠️
Stay alert for manipulations + fake-outs at key levels – it's a trap game out here 🎭
📰 Before the Heist:
🧾 Read Fundamentals • COT Report • Sentiment • Macro Outlook
📌 Always stay updated, news can flip the market faster than a backstab 🗡️
🗣️ Boost this idea if you’re robbing with us!
💥 Smash that LIKE if you believe in the heist
🚨 Follow for more high-voltage thief trades
💎 Daily playbooks. Clean getaways. All signals, no noise.
Join the crew. Trade like a THIEF. Get rich or get smarter.
🕵️♂️💰🚀🔥🐱👤📈

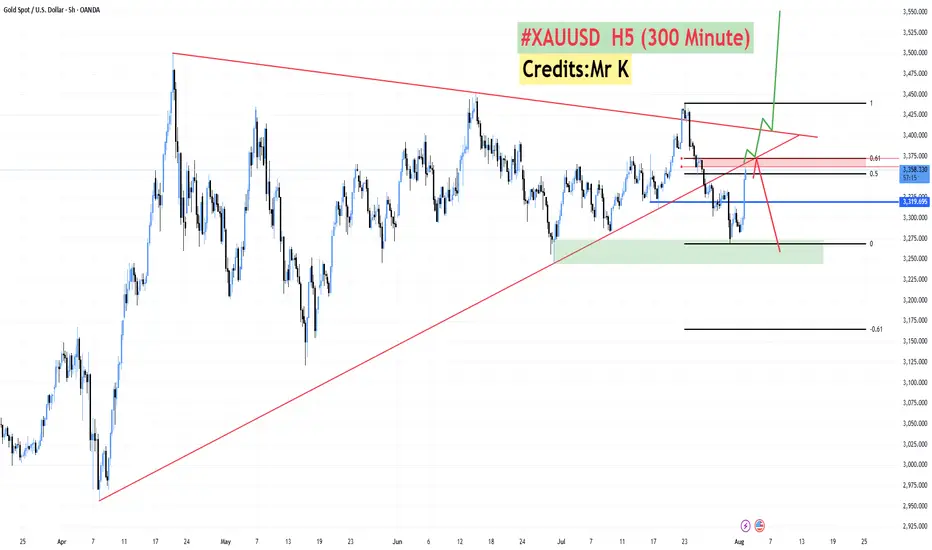
**#XAUUSD H5 Higher Timeframe Analysis**
📊 **#XAUUSD H5 Higher Timeframe Analysis**
What we witnessed today was a **tremendous recovery in Gold 🟡** after **3–4 consecutive bearish sessions 📉**.
📅 **Today’s candle** has **completely flipped the weekly structure**, turning a fully **bearish weekly candle into a bullish one 📈** — thanks to the **NFP data** that came in **favor of Gold and against the Dollar 💵❌**.
🔍 However, price is now approaching a **critical confluence zone**:
* 🧭 A **long-running trendline** (since April)
* 🔴 An **H4 Bearish Order Block**
* 📐 The **Fibonacci Golden Zone (0.50–0.618)** at **3362–3372**
📌 **From this level, we have two possible scenarios:**
1️⃣ **Sharp Rejection 🔻:**
Price may **reverse sharply** from the 3362–3372 zone and **resume the bearish trend**.
2️⃣ **Breakout & Trap Theory 🔺:**
If price **sustains above this zone**, it may signal that the recent **3–4 day drop was a fake breakdown**, designed to **trap sellers** and grab liquidity for a **further upside move**.
✅ **Confirmation will come if we get an H4–H6 bullish candle close above the trendline** and back inside the **buying zone of 3375–3390**.
🔓 **A breakout above the triangle pattern** will likely lead to a **strong bullish continuation 📈🚀**.
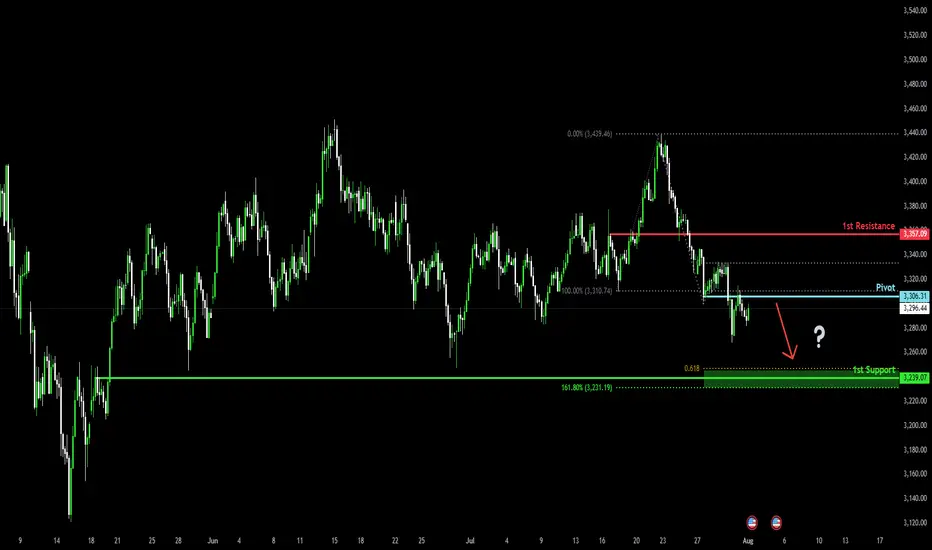
Potential bearish drop?The Gold (XAU/USD) has reacted off the pivot and could drop to the 1st support.
Pivot: 3,306.31
1st Support: 3,239.07
1st Resistance: 3,357.09
Risk Warning:
Trading Forex and CFDs carries a high level of risk to your capital and you should only trade with money you can afford to lose. Trading Forex and CFDs may not be suitable for all investors, so please ensure that you fully understand the risks involved and seek independent advice if necessary.
Disclaimer:
The above opinions given constitute general market commentary, and do not constitute the opinion or advice of IC Markets or any form of personal or investment advice.
Any opinions, news, research, analyses, prices, other information, or links to third-party sites contained on this website are provided on an "as-is" basis, are intended only to be informative, is not an advice nor a recommendation, nor research, or a record of our trading prices, or an offer of, or solicitation for a transaction in any financial instrument and thus should not be treated as such. The information provided does not involve any specific investment objectives, financial situation and needs of any specific person who may receive it. Please be aware, that past performance is not a reliable indicator of future performance and/or results. Past Performance or Forward-looking scenarios based upon the reasonable beliefs of the third-party provider are not a guarantee of future performance. Actual results may differ materially from those anticipated in forward-looking or past performance statements. IC Markets makes no representation or warranty and assumes no liability as to the accuracy or completeness of the information provided, nor any loss arising from any investment based on a recommendation, forecast or any information supplied by any third-party.

XAUUSD: Market Analysis and Strategy for August 4th.Gold Technical Analysis:
Daily Chart Resistance: 3400, Support: 3300
4-Hour Chart Resistance: 3370, Support: 3330
1-Hour Chart Resistance: 3363, Support: 3352.
Last week's NFP data was positive for gold prices, sending gold prices sharply higher. The market trend was much stronger than expected, breaking through the resistance level of 3333 and then rising to around 3360.
The daily chart shows Friday's sharp rise, erasing the losses from the first four days of last week. This signals continued bullishness for this week and the market outlook.
However, for those of us who are day traders, please be cautious about buying at high levels. After all, excessive short-term gains in gold could lead to profit-taking.
Technically, the daily MACD fast and slow lines are about to form a golden cross near the zero axis, indicating that the downward correction is nearing its end. However, the 1-hour RSI indicator shows a strong overbought signal, suggesting continued movement towards the lower support level.
For today's trading, it's best to wait for a pullback before buying. This is both safer and offers greater profit potential. Focus on the lower support level around 3333-3320. Upside targets could be in the 3375-3390 range.
Buy: near 3330
Sell: near 3370

Gold Trade Plan 31/07/2025Dear Traders,
3304-3307 is very important area for Gold,
Pay close attention to the 3303-3307 zone. If you see a rejection in this area, you can enter a sell position.
if Fix above 3305------> 3351
IF Fix below 3305----->3267 (again)
Regards,
Alireza

XAUUSD Analysis todayHello traders, this is a complete multiple timeframe analysis of this pair. We see could find significant trading opportunities as per analysis upon price action confirmation we may take this trade. Smash the like button if you find value in this analysis and drop a comment if you have any questions or let me know which pair to cover in my next analysis.

XAUUSD Technical AnalysisTechnical Analysis – Symmetrical Triangle with Retest
Current Market Situation
The chart shows a symmetrical triangle pattern, which is a continuation pattern often followed by strong directional movement.
The price has broken below the triangle, signaling a potential bearish move.
Currently, the price is in the retest phase of the broken triangle, which is an important area to confirm the bearish trend before continuing downward.
Key Zones
Retest Zone (Pullback): Located between current price and 3,374, which is a strong resistance area.
Targets (TP):
TP1: 3,322.97
TP2: 3,285.87
TP3: 3,262.59
Possible Scenarios
✅ Bearish Scenario (Preferred):
If the price holds below the retest zone, we expect a continuation to the downside towards:
Target 1: 3,322.97
Target 2: 3,285.87
Target 3: 3,262.59
⚠ Bullish Scenario (Alternative):
A daily close above 3,374 will invalidate the bearish scenario and may trigger a reversal.
Conclusion
The market shows a strong technical indication of a bearish continuation after confirming the retest.
Any daily close above 3,374 would cancel the bearish scenario.
It is recommended to monitor price action closely in the retest zone for confirmation before entering trades.

Short idea!Hello all. the last falling leg is about to start. lets see the reaction of the market on the Broken retrace zone. be happy.

GOLD recovers after many days of declineOANDA:XAUUSD has recovered after several days of declines. Investors will focus on the Federal Reserve's interest rate decision on Wednesday, which is expected to cause significant market volatility.
Gold hit a three-week low of $3,301 an ounce on Monday, before recovering somewhat on Tuesday after falling for a fourth straight day as the dollar erased some of its earlier gains, boosting demand for the precious metal.
Falling US Treasury yields and a weak US jobs report also prompted investors to buy gold.
Data released by the U.S. Labor Department on Tuesday showed the number of jobs added fell in June after two straight months of gains.
The number of jobs added in June fell to 7.44 million from a revised 7.71 million in May. The median forecast of economists in a survey was 7.5 million.
Focus on the Federal Reserve's decision
The Federal Reserve will announce its interest rate decision at 01:00 IST on Thursday; Federal Reserve Chairman Powell will hold a press conference on monetary policy at 01:30 IST on the same day.
The market generally expects the Federal Reserve to keep interest rates unchanged, with the focus on whether Fed Chairman Powell's speech will provide any clues about the timing or pace of future rate cuts.
The market sees a very low chance of a rate cut in July and a roughly 40% chance of another rate cut in September, up from about 10% last month, according to the Chicago Mercantile Exchange's FedWatch tool. Investors will be closely watching the statement and Fed Chairman Powell's remarks at his post-meeting press conference for fresh clues on the timing of the next rate cut.
- If Powell opens the door to a rate cut in September, citing the recent trade deal as a reason to ease uncertainty, US Treasury yields could fall immediately, paving the way for gold prices to rise.
- On the other hand, if Powell avoids committing to a rate cut at this meeting, citing recent rising inflation data, gold prices could fall.
Gold typically performs well in low-interest-rate environments because it does not pay interest and its appeal increases when returns from other assets decline.
Technical Outlook Analysis OANDA:XAUUSD
Gold has recovered from the key $3,300 price point and is holding above $3,310, which is also the nearest support. However, the current recovery is not technically enough to create a short-term uptrend, or conditions for a sustained price increase. In terms of position, gold is under pressure with the 21-day EMA as the nearest resistance at around $3,340 – $3,350. If gold falls below the 0.382% Fibonacci retracement level, it will be eligible to open a new downtrend with a target of around $3,246 in the short term, more than the 0.50% Fibonacci retracement level.
On the other hand, RSI is below 50, and the current 50 level acts as momentum resistance in the short term. If RSI slopes down, it will signal bearish momentum with more downside ahead. For gold to qualify for bullish expectations, it needs to at least push price action above EMA21, then retrace back to the price channels and finally break above the 0.236% Fibonacci retracement level to confirm bullish conditions. The upside target could be towards $3,400 in the short term, more like $3,430 – $3,450.
For the day, the technical outlook for gold prices tends to lean more towards the downside, with the following notable points listed.
Support: 3,310 – 3,300 – 3,292 USD
Resistance: 3,340 – 3,350 – 3,371 USD
SELL XAUUSD PRICE 3376 - 3374⚡️
↠↠ Stop Loss 3380
→Take Profit 1 3368
↨
→Take Profit 2 3362
BUY XAUUSD PRICE 3280 - 3282⚡️
↠↠ Stop Loss 3276
→Take Profit 1 3288
↨
→Take Profit 2 3294
XAU/USD Technical Analysis (1H Chart)Based on the 1-hour chart, XAU/USD is currently at a critical juncture, presenting a potential short-selling opportunity. The analysis is based on a confluence of technical factors.
Key Observations:
Minor Bearish Trend: The price is trading within a well-defined descending channel, indicating a short-term bearish trend. The market has been forming a series of lower highs and lower lows since the peak around the 06:00 mark on August 6th.
Fibonacci and Trendline Confluence: The current price is testing a significant resistance zone. This area is a cluster of multiple technical indicators:
Descending Trendline: The price is directly touching the upper boundary of the bearish channel, which is acting as dynamic resistance.
Fibonacci Retracement: The price has retraced up to the 0.618 Fibonacci level, a key area where sellers often step in to push the price back down.
Moving Averages: The price is trading below the faster-moving averages (red, green, blue lines), which are also beginning to slope downwards, adding to the bearish sentiment.
Trade Scenario:
The chart highlights a potential short (sell) trade setup:
Entry: Around the current price level (~3,372.130), capitalizing on the resistance from the trendline and Fibonacci cluster.
Stop Loss: Placed above the recent swing high and the resistance zone, around 3,378.000. This protects the position against a breakout above the channel.
Take Profit: Targeted at a lower support level, around 3,338.000.
Conclusion:
The outlook for XAU/USD in the short term is bearish. The price is facing strong resistance at the confluence of the descending trendline and the 0.618 Fibonacci level. As long as the price remains below this resistance cluster, a continuation of the downward move towards the target of 3,338.000 is likely. A break and close above the 3,378.000 level would invalidate this bearish scenario.
