August 4, 2025 - XAUUSD GOLD Analysis and Potential OpportunitySummary:
Gold is currently in a sideways-to-bullish structure. Strong resistance remains around 3440–3450; if this level fails to break, it offers a high-probability shorting opportunity. Near-term focus is on the 3350 support level — if it breaks, bearish momentum may pick up and selling the pullback becomes ideal. If 3350 holds, consider buying the dip and targeting a test of 3375. Stay flexible and responsive to price action at key levels. Manage risk accordingly.
📍 Key Levels to Watch:
• 3400 – Resistance
• 3384 – Resistance
• 3375 – Key resistance
• 3365 – Resistance
• 3350 – Psychological level
• 3345 – Support
• 3334 – Key support
• 3323 – Support
• 3310 – Support
📈 Intraday Strategy
SELL if price breaks below 3350 → target 3340, then 3334, 3323, 3315
BUY if price holds above 3365 → target 3370, then 3375, 3384, 3394
👉 If you find this helpful or traded using this plan, a like would mean a lot and keep me motivated. Thanks for the support!
Disclaimer: This is my personal view, not financial advice. Always use proper risk control.
GOLD trade ideas

Analysis For The Next WeekHello Traders,
I hope you had joyful weekend, the market is going to open tonight so we are back with new idea for next week.
As you know gold was dropping for last two weeks and suddenly pumped almost 650 pips after the impact of NFP News. We saw the high pressure in the market on Friday due to news impact.
Gold has broken the buy trend line D1,H4. According to D1,H4 gold still wants to drop till 3251.
If price respects area 3372-3393, then gold will drop. If price breaks the area 3400 then it will pump and it can make another All Time High. As you know 3501 is the All Time High (ATH). Price can break if there will be a breakout for bullish moment.
Keep in touch and drop positive comments here, Thanks.

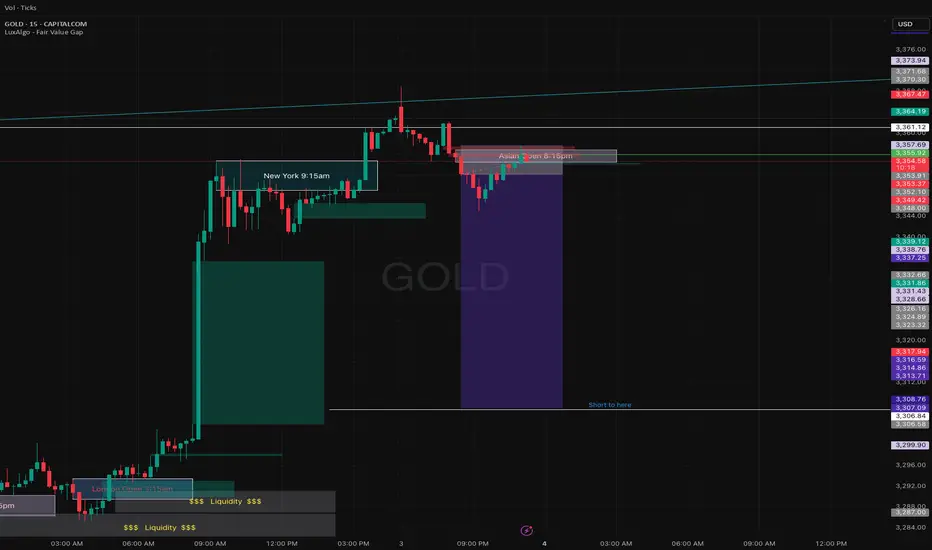
Gold Trend Reversal: MSS Completed Eyes on OB and Breaker Block!The gold market has executed a Market Structure Shift (MSS) in the New York session, indicating a trend reversal. Initially, the market made a Break of Structure (BoS) to the upside, but later dropped sharply and closed below the MSS level, confirming a bearish shift. Currently, the market is likely entering a retracement phase and may look to fill its Pending Demand (PD) arrays.
There are two critical levels from which the market could potentially drop again:
1. The first is an Order Block (OB).
2. The second is a Breaker Block (BB).
Keep a close watch on these two levels. If the market returns to either and presents bearish confirmation signals, it could resume the downward move towards swing lows.
Do Your Own Research (DYOR).

GOLD OUTLOOKMy view on Gold ..
More likely to retrace to the bearish PRZ from where i'll be looking for Sell setup on the lower time frames

Candle patterns that help you always WinHello everyone, if you are struggling to identify price zones, entry points, or simply want to predict the trend of any currency pair, then this article is for you.
I will divide it into several parts, and today we will cover some common patterns — so grab a pen and paper to take notes!
First pattern: ASCENDING TRIANGLE
The ascending triangle is considered a bullish continuation pattern. In order to locate it, we will observe more than one ascending peak. To draw this pattern, a horizontal line (the resistance line) must be placed above the resistance points, and an ascending line (the uptrend line) must be drawn along the support points.
Second pattern: FLAG
The flag pattern is used to identify the possible continuation of a previous trend from a point where the price has drifted against that same trend. If the trend resumes, the price rise could be rapid, making the timing of a trade advantageous when noting the flag pattern.
If you think you have seen a flag to trade, the most important thing is the fast and steep price trend. If the price slowly rises and falls below the flag, you'd better not trade at that time.
3. CUP AND HANDLE
The cup and handle pattern on the price chart resembles a cup with a handle, where the cup is u-shaped and the handle has a slight downward slope.
The cup forms after an upward move and looks like a bowl or rounded bottom. As the cup is completed, a narrow price range develops on the right side and the handle is formed. A subsequent breakout of the trading range that forms the handle indicates a continuation of the previous upward move.
4. DOUBLE BOTTOM
The trajectory of the asset price within the formation of the model resembles the letter "W". The last two price lows, located at approximately the same level, is an area of strong support, in which twice performs an upward price reversal.
When the market price breaks the resistance level of the pattern, the formation of the pattern is complete. The sell signal appears and a change in the trend direction is expected.
5. INVERSE HEAD AND SHOULDERS
This pattern is identified when the price action of a security meets the following characteristics: the price falls to a low and then rises; the price falls below the previous low and then rises again; finally, the price falls again, but not as much as the second low. Once the final low is reached, the price heads upward toward resistance near the top of the previous apexes.
6. ROUNDING BOTTOM
The rounding bottom pattern looks similar to the cup and handle pattern, but does not experience the temporary downward trend of the "handle" portion.
The initial downward slope of a rounding bottom indicates oversupply, which forces the stock price down.
The move to an uptrend occurs when buyers enter the market at a low price, which increases demand for the stock. Once the rounded bottom is completed, the stock breaks out and will continue in its new uptrend.
7. TRIPLE BOTTOM
The Triple Bottom pattern is similar in appearance to the Inverse Head and Shoulders pattern, in that it is represented by a series of three highs and lows.
The difference is that the three highs of the Triple Bottom will have approximately the same height, whereas in the Inverse Head and Shoulders pattern, the second low is lower than the first and third lows.
The appearance of the Triple Bottom indicates the existence of a downtrend, which is currently in the process of reversing into an uptrend.
And here are some classic bullish patterns. In the next parts, I will cover bearish patterns, how to read candlesticks, and technical indicators.
If you find this interesting and useful, please leave me a like and a comment to keep me motivated!
Now, are you ready to trade? Remember and practice these patterns — you’ll soon become a true professional.
Good luck!
Kevinn_Nguyen.
Strike with precision and win in the gold trading market!Gold continues to fluctuate in an upward structure, with lows gradually rising, showing that the bulls are still in a dominant position. The current key support has moved up to the 3360 line. Before this position is effectively broken, the overall idea is to maintain a low-long strategy. It should be noted that the current market has been consolidating at a high level for three consecutive days, and has the basis for further strengthening. It is not advisable to wait for a sharp pullback at this time, but to pay attention to the continuity opportunities of direct pull-ups. It is recommended to seize the strong continuation opportunities in the current period in terms of operations, and strategically postpone it to the European and American trading sessions for simultaneous execution. Specifically pay attention to the long order layout opportunities in the support area of 3375-3360, and the upper resistance is around 3390-3405. Overall, we should flexibly participate in the high-altitude and low-long rhythm in this range. It is recommended to wait and see in the middle position, chase orders cautiously, and wait patiently for key points to enter the market.

The best ambush point for short positions below gold 3400.The daily structure of gold still maintains a bullish dominant pattern. The upper target is the upper Bollinger band of 3400. If it breaks through this position, the upside space will be further opened up. The 4-hour Bollinger band is gradually closing, and the price is fluctuating in the range of 3400-3360. In the short term, it is still treated with range thinking. Before an effective breakthrough, the operation can adopt a high-altitude and low-long strategy. Gold is currently at a critical node of change. If it rises and falls in the evening, it may release a temporary peak signal. The area below 3400 is expected to become an opportunity for the layout of medium-term short positions. The overall recommendation is to remain cautious, respond flexibly to changes in rhythm, and strictly control risks.
Gold operation suggestion: You can continue to try short selling in the 3390-3400 range, with the target at 3380-3370.

XAUUSD - Short XAUUSD Short Trade Idea – 4H Chart
Price has made a strong move up, but it's now entering an area where sellers were in control before.
Why I'm looking to short:
Price is retesting a supply zone where the last big drop started
It’s also near a resistance level and rejected from there
The downtrend is still valid with lower highs
There's a good chance price could drop to grab liquidity below
*** Target areas:
First target: around 3288
Final target: around 3250, where we have a demand zone
*** Invalidation:
If price breaks and closes above 3385, this short idea is no longer valid.

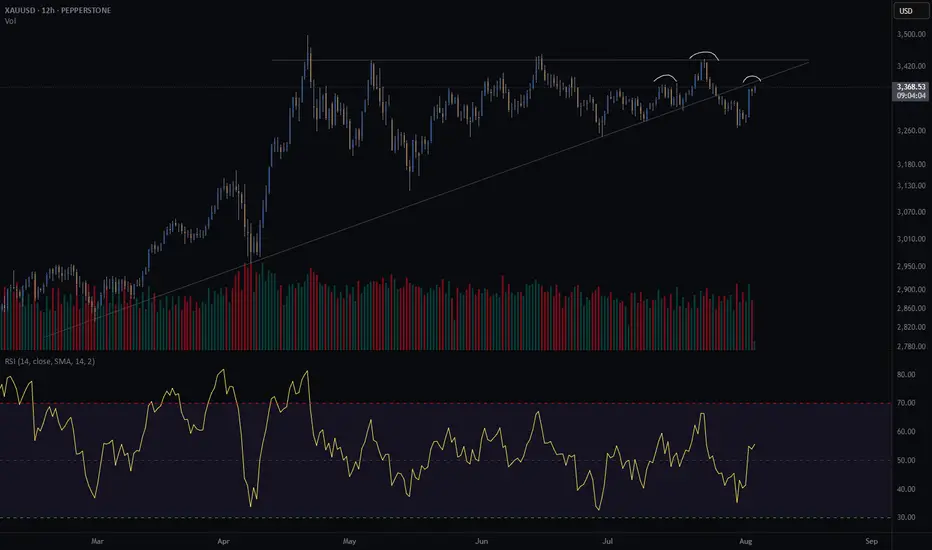
Gold crash (SHORT) - head and shouldersGold is at an interesting crossroad.
It broke through its diagonal support on Friday the 25th of July.
Price is retesting previous support. Does it turn into resistance?
Further confluence is a head and shoulders of the H8 and H12, with the right shoulder coinciding with the retest of the diagonal.
Since I am long gold with my investments, I am hesitant to short gold through my trading business. However, if my pattern is available, I take the trade. This will be a very short term trade - a few days at most if the trade goes in my favour.
Risk/reward = 12.6
Entry price = 3382.5
Stop loss price = 3396.2
Take profit level 1 (50%) = 3230
Take profit level 2 (50%) = 3181
The risk reward is exceptionally high. However, I have taken a more conservative approach with my entry because of my apprehension to short gold. For this trade I will enter at the extreme end of the range in which I will look for entries. This is the reason for such a high RR. It might result in me missing an entry.
XAUUSD 8/4/25 followupPrice closed strongly above Sunday's open so I am just looking for retracements to the upside from here.

How to accurately capture golden trading opportunities?Bullish trend is still the main trend of gold at present. After rising to 3368 at the opening today, it fell under pressure and fluctuated. Technically, it has tested the pressure level and needs to be adjusted. The overall high-level carrying capacity has also declined, so it is not advisable to chase the rise too much. In terms of operation, it is recommended to wait for the price to stabilize before buying more. Judging from the current gold trend, the upper short-term resistance is in the 3380-3385 area, and the key pressure is at the 3395-3400 line; the lower short-term support is in the 3365-3355 area, and the key support is in the 3350-3345 range. The overall suggestion is to arrange long orders on dips around the support area, and try to maintain a stable wait-and-see attitude in the middle position. I will prompt the specific operation strategy at the bottom, please pay attention in time.
Gold Trading Strategy: Buy in batches as gold retreats to the 3365-3350 area, targeting the 3380-3385 area. If this resistance zone is broken, hold and look for upward movement.
Grasp the trend accurately and have a crazy weekend!After testing the 3380 support level several times in a row today, gold maintained an oscillating upward trend. Today's layout of 3380 repeatedly went long, and 3400 shorts were all successfully closed with profits, with a total profit of 580pips. Currently, gold is oscillating at a high level in the 3404-3380 range. The possibility of a direction choice cannot be ruled out in the evening. If the market continues to be bullish in the evening, it is necessary to pay attention to whether the price will fall below 3380 when it tests the support level for the third time. If the support level is effectively broken, it is expected to fall to the key support level of 3370. If the price firmly stands above the 3400 mark, it may continue to test 3410. If there is no breakthrough either above or below, it will still maintain a range of oscillations, and the idea of selling high and buying low will be the main focus.

GOLD Short tradeOANDA:XAUUSD Short trade, with my back testing of this strategy, Short correction.
This is good trade.
Don't overload your risk like Greedy Gambler!!!
Be disciplined trader.
Use proper risk management
Looks like good trade.
Lets monitor.
Use proper risk management.
Disclaimer: only idea, not advice

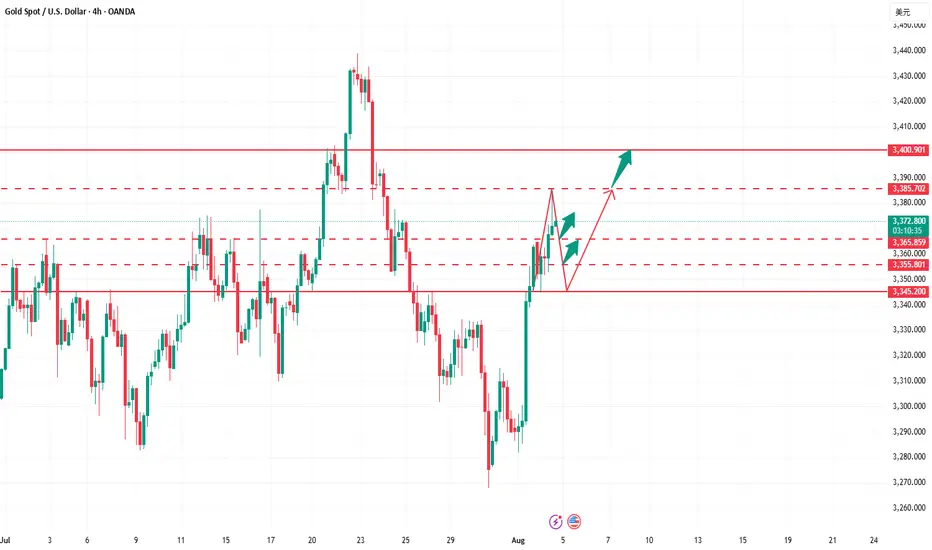
xauusdxauusd Focus on red line
From the price level of 3368 and above, gold is expected to pull back at least until the Stochastic on the M30–H1 timeframes reaches oversold levels.
After that, a bullish continuation is likely, pushing the price up to around 3400.
This area will be a critical decision point — determining whether the market will continue its uptrend or reverse into a downtrend.
If the H4 chart prints a reversal candlestick pattern, it would indicate the beginning of a bearish trend, which could potentially lead to a downward movement of up to 20,000 points.

What does it matter if every step is just right?Today's gold fluctuation rhythm is basically consistent with our prediction. The rhythm from entry to profit-taking is clear, and the strategy is executed decisively. First, we decisively arranged long orders at the 3365-3370 line, and successfully took profit at the target line 3375, earning 150pips of profit. Then we decisively reversed and arranged short orders at 3375. The market fell back to around 3360 as expected, and realized 150pips of profit again. In the third round of operations, long orders were entered again near 3352, and the price rose smoothly to 3370 to take profit again. The overall rhythm was tight and profits were steadily pocketed. At present, gold has rebounded to around 3380-3385. We have deployed a new round of short orders in advance and will wait for the price to drop before arranging long orders. Overall, gold is in a volatile rhythm. Even if there is still room for upward movement in the future, it is likely to undergo a round of technical retracement adjustments first.
Gold Bulls Unshaken, 3400 in FocusGold prices retreated from a high of 3385 today, currently hitting a low near 3358. How far will gold fall? Are the bears back in control? I'm not worried about a gold pullback, but rather a lack of one, because only a pullback can provide a good entry opportunity. Clearly, I remain bullish on gold and optimistic about it reaching the 3400 mark.
Because gold fell all the way to around 3358, some voices in the market began to tout the strong return of the bears, but I remained unmoved. When many people were once in self-doubt, I was quietly taking advantage of the gold pullback to accumulate funds in batches and pick up bargains. We can clearly see that gold did not destroy the bullish structure during the decline, and as gold rebounded, the 3360-3350 area has become a dense trading area, indicating strong buying support. After the technical top and bottom conversion, it has become a relatively solid support area. It may be difficult for gold to fall below this support area in the short term.
So, why has gold repeatedly encountered resistance and retreated? I believe that gold has encountered resistance and retreated in the 3385-3390 area many times in order to repeatedly test the effectiveness of support and consolidate the strength of support. It is also to increase liquidity during the retreat period, thereby accumulating more upward momentum so that gold can rise further and break through the 3400 mark.
So I still hold a long position in gold, and I have not lost confidence in the gold bulls. On the contrary, I still expect that gold will be able to hit 3400 in one fell swoop after repeatedly testing the support, or even continue to rise to the 3420-3430 area.

What you see are fluctuations, what I see are opportunities!Gold prices are rising as expected, with long positions perfectly fulfilled and periodic profits successfully secured. Currently, prices are once again encountering resistance at 3390. A clear bearish engulfing pattern has formed on the short-term hourly chart, suggesting weakening short-term momentum and increasing risk of a pullback. From a cyclical perspective, today marks the fifth trading day of gold's rebound, and technically, a periodic adjustment is necessary. A break below 3370 today will essentially confirm the establishment of a short-term top, and the market structure may shift into a phase of decline. Regarding trading recommendations, we recommend continuing to short on rallies around 3390 as a key resistance level, with short-term targets focused on 3370-3360. A subsequent break below this level with significant volume could open up further downside potential. Market sentiment is shifting rapidly at this time, so it is crucial to strictly enforce risk management discipline, avoid blindly chasing orders, and maintain a flexible and forward-looking strategy.

Gold Price Action Breakdown Key Liquidity Sweep + RB ReactionClean gold as price respected the Monday Rejection Block and swept key liquidity zones just as mapped. In this breakdown, I explain the logic behind the move, what I was expecting, and what actually played out.
💡 If you enjoy these trade breakdowns and want to go deeper into mindset, risk, and precision strategy I share extra lessons, insights, and psychology tips over on the blog. Just check the link in bio/profile for more.
Stay sharp and focused. Less is more. 🎯

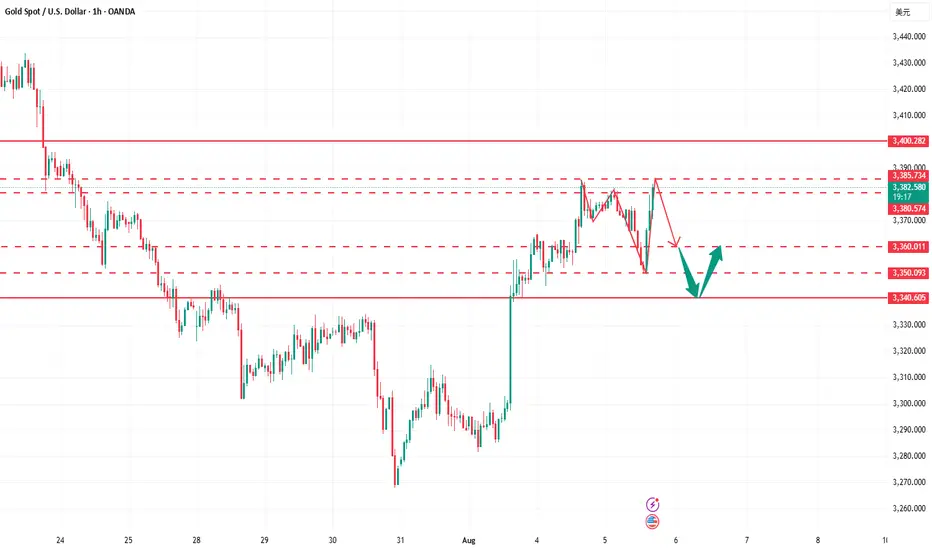
Gold (XAUUSD) Bullish Reversal: Targeting Upper Liquidity ZoneFirstly, our Algo-based indicators are used to create this analysis:
This 1-hour chart for XAUUSD indicates a strong bullish reversal is underway, with the price aiming to fill higher inefficiencies and test a significant resistance zone.
Analysis:
Market Structure Shift: Gold has broken its recent bearish structure with a powerful move upwards from the low near 3,267. The price has decisively reclaimed key moving averages (EMA 200, EMA 800), signaling a potential shift in the medium-term trend.
F illing Imbalances (FVG): The price action appears to be driven by a move to fill areas of imbalance, marked as Fair Value Gaps (FVG). After bouncing from a lower FVG, the price has surged and is now being drawn towards higher FVG zones.
Price Projection: The drawn black line illustrates a potential path for the price. It anticipates a minor pullback from the current resistance around 3,363. This pullback could find support near the 3,300 level before initiating the next major rally. This "dip and rip" pattern would establish a higher low and confirm the strength of the new uptrend.
Ultimate Target: The primary objective for this bullish move is the significant resistance zone at the top of the chart, labeled "LSOB" (Liquidity Sweep Order Block). This area, between approximately 3,427 and 3,438, represents a major liquidity pool where a significant reaction can be expected.
Strategy:
Idea: Look for a long entry opportunity on a potential pullback.
Entry Zone: A dip towards the 3,290 - 3,312 area could present a favorable entry, as this aligns with the projected bounce point.
Target: The main target for this trade is the upper resistance zone at 3,427 - 3,438.
Conclusion:
The confluence of a market structure break, the reclamation of key moving averages, and the magnetic nature of the upper Fair Value Gaps all point to a continued bullish scenario for Gold. A healthy pullback would offer a strategic entry to ride the trend towards the major liquidity zone above.
Disclaimer: This analysis is for educational purposes only and should not be considered financial advice. Always conduct your own research and manage risk appropriately.

Buy and sell level goldNow already showing upside momentum
3384-3398 level gonna week as it already responded yesterday
Now again reached to this level
We expecting that it will break now this level and straight towards 3430

Gold OutlookAfter our last idea, I'm looking to see gold sell down and then resume the upward trend. This is my personal conviction, always remember, I do not own the market
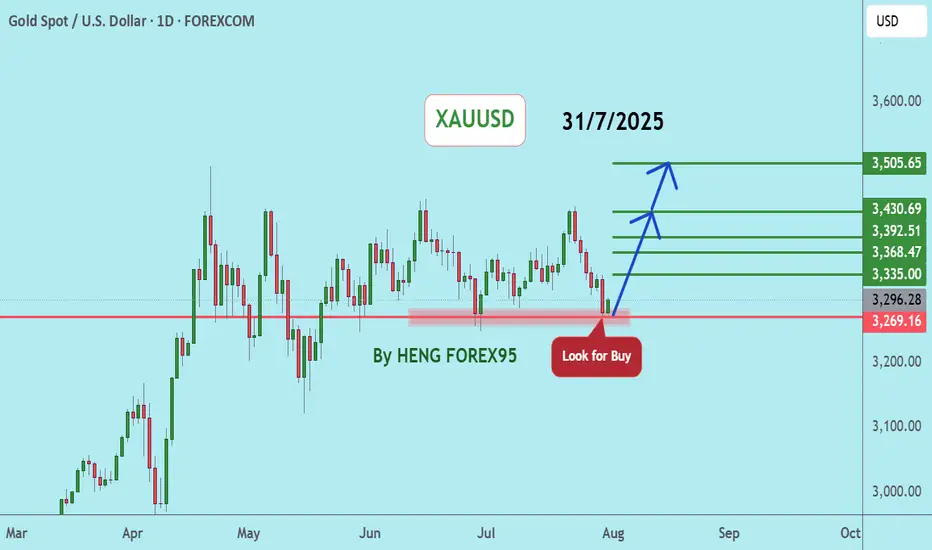
XAUUSDUpdate:
Gold Price Trend: As per our previous analysis on July 28, 2025, the price has now tested the support at 3,269. We expect that if the gold price can hold above 3,249, the gold price trend will remain bullish. We recommend considering buying in the red zone.
🔥Trading futures, forex, CFDs and stocks carries a risk of loss.
Please consider carefully whether such trading is suitable for you.
>>GooD Luck 😊
❤️ Like and subscribe to never miss a new idea!
XAUUSD Live Trade Last Night (Killed it with 11,641 USD Profits)I managed to ride the momentum last night on XAUUSD and made over 11,641 usd profit on a live trading account. Gold usually create a range. It will create a top and a bottom then it will spend most of its time inside that range. That is pretty much how XAUUSD moves. If you can identify the top and the bottom then you can short it from the top and do a long trade on the bottom. The price will just travel from bottom to top and top to bottom. You can scalp your way to profits on this move if you can time it properly. Once in a while, a break from the top or the bottom happens. This is where you switch from trading the range to trading breakouts.
