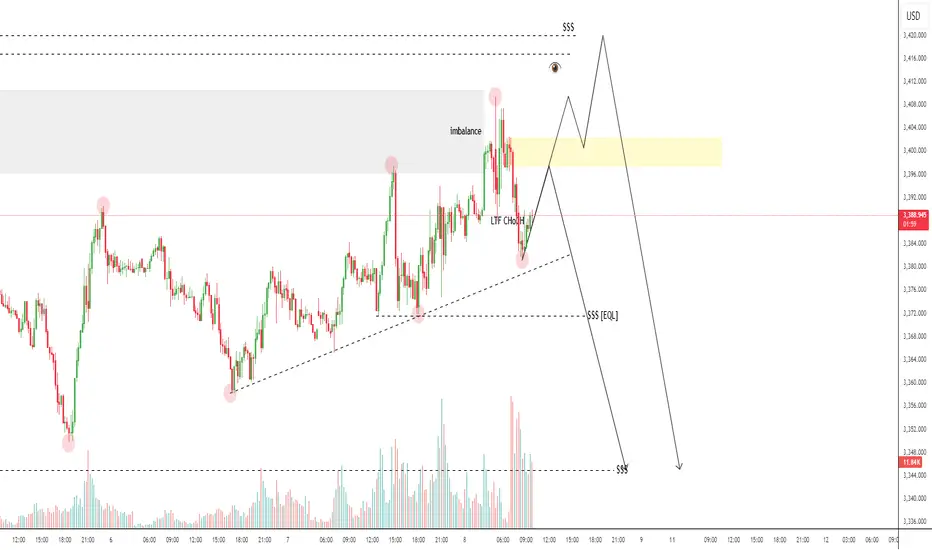
Gold OutlookAfter our last idea, I'm looking to see gold sell down and then resume the upward trend. This is my personal conviction, always remember, I do not own the market
GOLD trade ideas
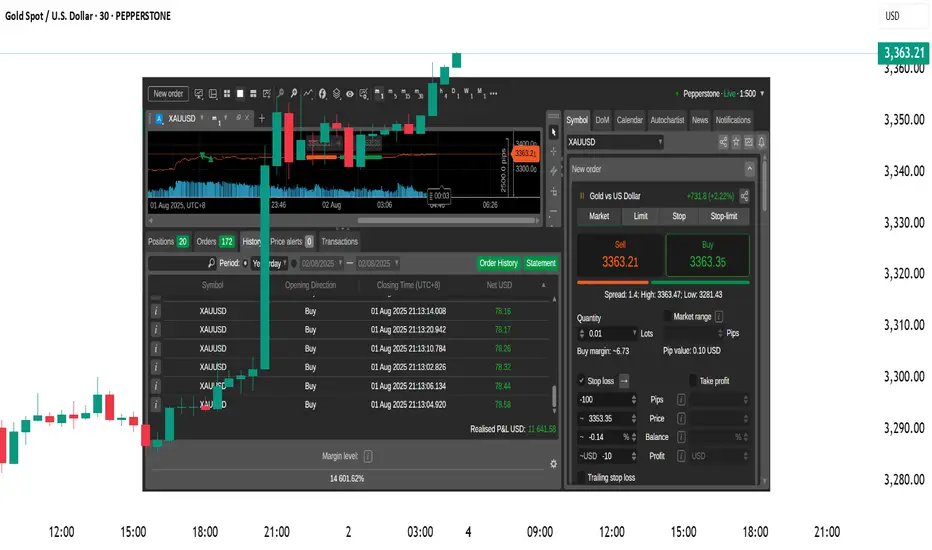
XAUUSD Live Trade Last Night (Killed it with 11,641 USD Profits)I managed to ride the momentum last night on XAUUSD and made over 11,641 usd profit on a live trading account. Gold usually create a range. It will create a top and a bottom then it will spend most of its time inside that range. That is pretty much how XAUUSD moves. If you can identify the top and the bottom then you can short it from the top and do a long trade on the bottom. The price will just travel from bottom to top and top to bottom. You can scalp your way to profits on this move if you can time it properly. Once in a while, a break from the top or the bottom happens. This is where you switch from trading the range to trading breakouts.

Wyckoff distribbutes GoldThis analysis relies on the Richard Wyckoff trading model to explain the ongoing activity in the price of Gold, XAUUSD, claiming a potential shorting of the precious metal.

Gold mapping for next weekGold is going down. Gold Major trend is Changing to bearish, lets see are Gold going down after grab liquidity
GOLD | Bullish Mitigation + Inducement Lining Up For Execution(Refined & Structured):
• Pair: XAUUSD (Gold)
• Bias: Bullish
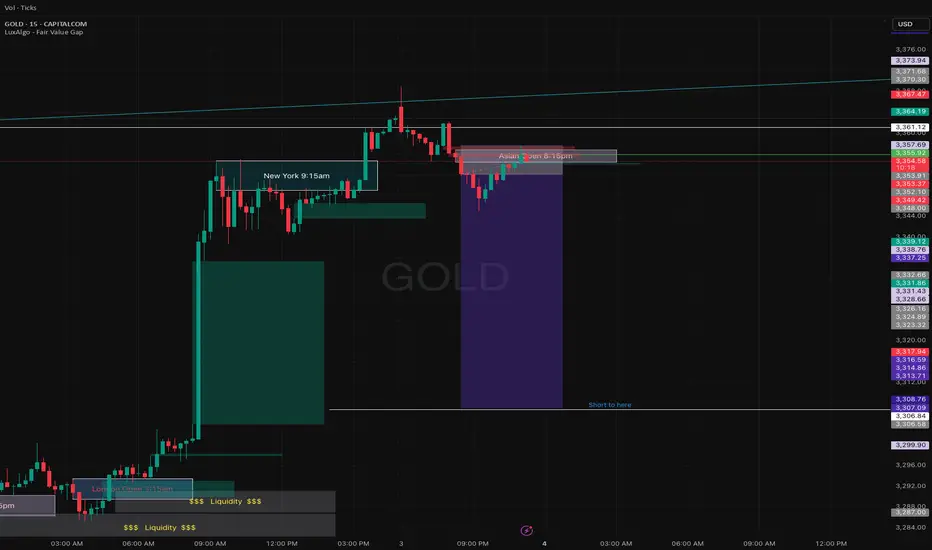
• 4H Overview: Gold broke last week’s previous high, then pulled back and mitigated this week’s order block within the same range. A significant internal high (turnover HH) has now been broken, and price retraced to sweep liquidity and tap into the OB zone.
• 30M Structure: Now watching for a clean pullback into a refined OB after taking out sell-side liquidity/inducement. Structure is aligning perfectly for the next leg up.
• Entry Zone: Once price enters the OB zone, I’ll be watching the 5M for church-level confirmation. Execution follows once LTF speaks clearly.
• Targets: 5M to 30M structural highs depending on delivery.
• Mindset Note: I’m not rushing. Just following structure and reading price. Analysis mode right now—execution comes once price gives the sermon.

XAUUSD Live Trade with 11,641 USD ProfitsI managed to ride the momentum last night on XAUUSD and made over 11,641 usd profit on a live trading account. Gold usually create a range. It will create a top and a bottom then it will spend most of its time inside that range. That is pretty much how XAUUSD moves. If you can identify the top and the bottom then you can short it from the top and do a long trade on the bottom. The price will just travel from bottom to top and top to bottom. You can scalp your way to profits on this move if you can time it properly. Once in a while, a break from the top or the bottom happens. This is where you switch from trading the range to trading breakouts.
When you trade breakouts, you must trade it with the knowledge that less than 15 percent of breakouts are successful. Failed breakouts are very common. You need to have some form of stoploss below your breakout levels. You will know that the breakout fails once your stoploss is hit. If the breakout is successful then ride it. Do not put some TP (target price or take profit price) rather just trail your profits. Move your stops a few pips behind the price. Just enough distance to let the price breathe. If the price reverses then it will hit your stops. If the breakout is strong then you will ride it for a while until it reverses.
It will form another top and bottom again and move inside that range. Switch your approach again in trading long trades near the bottom and short trades near the top.
Just remember to always have some stoploss on every trade and never try to predict what the market will do or how the price will move. Let the market do its thing and just react to its movements.
Goodluck on your trades.
Smart Money Concept (SMC)📉 Bearish Analysis XAU/USD – SMC
🔹 1. Previous Market Structure
• Price was respecting a train line (trendline) which was broken aggressively, confirming a Break of Structure (BOS).
• After that, the market created a fake out above the resistance zone, grabbing liquidity from early buyers.
🔹 2. Signs of Weakness
• A clear rejection at the resistance zone, showing that buyers lost control.
• The train line break also signals a Change of Character (ChoCh), suggesting the beginning of a bearish swing.
🔹 3. Prior Mitigation Completed
• Price already mitigated key zones, including the 1H Order Block (OB-1H) and previous 1H Fair Value Gap (FVG).
• A new bullish FVG was formed but seems to have been rejected, adding to the bearish pressure.
🔹 4. Trade Plan
• Entry: Rejection after the fake out within the red supply zone
• Target: Support zone between 3,355 – 3,352, where liquidity is likely resting
• Stop Loss: Above resistance and the last BOS to avoid being caught by manipulation
💡 Summary for your caption:
“Price broke the trendline and showed clear weakness at resistance, leaving behind unmitigated interest at lower levels. The FVG rejection suggests institutional intent. High-probability short setup targeting the support zone.” GOOD LUCK TRADERS.. ;)

XAUUSD needs Retest H4 TIMEFRAME SETUP
We shared daily our XAUUSD for deep insights and knowledge.
Currently we have range of 3345-3380 area also we have proper CHOCH on H4 at 3335 support area As I mentioned in our previous commantary we have bullish momentum which is almost near our milestone.
What possible scenarios we have ?
• Atm i took sell from 3385 with minimal risk
Sell from 3395-3400
TARGETS 3370 then 3350 milestone.
• above 3405- 3408 our selling will be invalid and we'll took buy to ATH

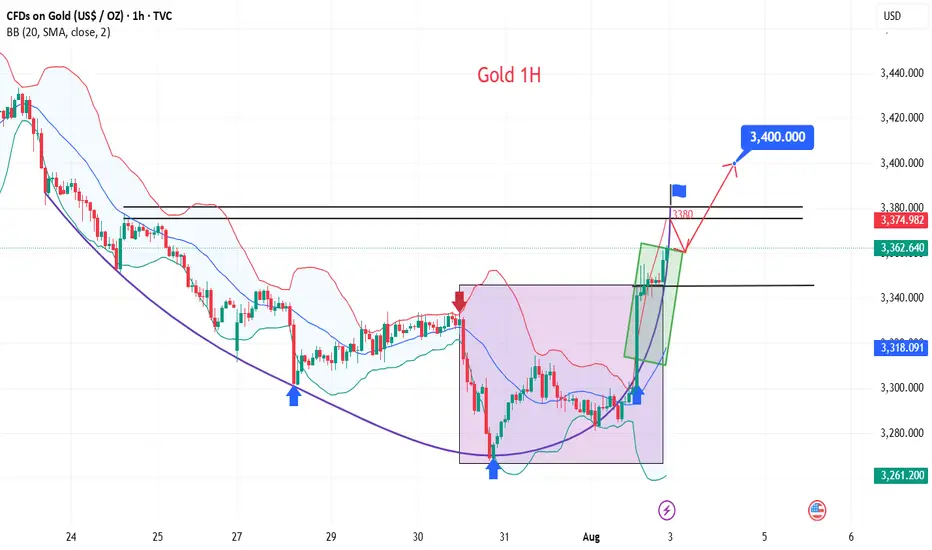
Is Gold 3400 Still Far Away?
💡Message Strategy
The spot gold market experienced a V-shaped reversal trend.Driven by unexpectedly weak U.S. non-farm payrolls data and risk aversion triggered by Trump's new tariff policy, gold prices rose nearly 2% on Friday to a one-week high of $3,347.66 per ounce, up 0.4% for the week. The Federal Reserve kept interest rates unchanged, but weak employment data rekindled expectations of a September rate cut, increasing the appeal of gold as a non-yielding asset.
At the same time, Trump's decision to impose tariffs of 10%-41% on many countries has exacerbated market concerns about global trade tensions and boosted the safe-haven demand for gold.
📊Technical aspects
The 1-hour moving average of gold has begun to turn upward, and the 1-hour moving average of gold has a double bottom structure. However, gold should not have such a large pullback for the time being. After the non-farm payrolls on Friday, gold fell back to the 3335 line and then began to fluctuate upward at a high level. The 3335-3345 area was also an important platform support in the early stage. Therefore, gold will mainly be bought on dips above 3335 next week.
💰Strategy Package
Long Position:3345-3355,SL:3325,Target: 3380-3400
05/08/25 Gold Swing LevelsTuesday 05/08/25 levels are marked; expecting a downtrend
Trade parameters
Entry on 5 min chart
Sl: 30-50pips
TP: 2-4x SL

XAU / USD Weekly ChartHello traders. Just wanted to repost this weekly chart that shows the scalp trade set ups I will be looking for this week. All wicks get filled, albeit even partially if not full. Saying that, I will be monitoring the market to see how the overnight sessions play out. I will post some lower time frame analysis as we get into the week, or when I am gonna take a trade. New month, so trade carefully. Big G gets my thanks.. Be well and trade the trend. Wishing everyone a profitable trading week. I am gonna try to post the charts right as , or before I take any trades. Thank you so much for checking out my weekly chart analysis.

XAUUSD Weekly Outlook – August 4–8, 2025New Month. New Week. New Questions.
Will the market reward hesitation — or bold reaction?
Will POTUS pump price with policy noise, or will smart money fade the manipulation?
August is historically a quieter month for hedge funds — but don’t mistake silence for safety. It's also the time when the Fed retreats to Jackson Hole, reflecting and recalibrating. Will September bring another rate cut… or another twist?
Stay sharp. This isn’t a month to sleep on.
"Last week's game plan played out nearly to perfection — well, almost! Let’s dive in and break down where gold could be headed next week."
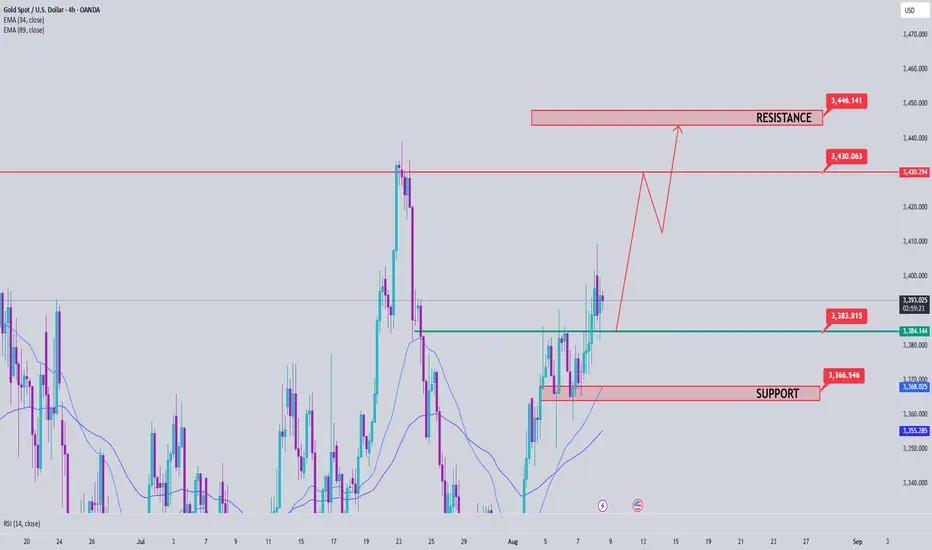
Gold kicks off August with a strong breakout above $3360, powered by a weakening U.S. dollar, rising global risk appetite, and persistent institutional demand. With Jackson Hole on the horizon and shifting Fed expectations, volatility is set to spike. The big question: will gold extend above premium, or retrace to rebalance?
After the last rejection near 3440, price broke cleanly below its ascending channel. Now, gold appears to be forming a potential lower high around the broken trendline — a rejection here could trigger a drop toward the key $3250 support zone.
🟡 XAUUSD – August Macro Outlook
💰 Price: $3362
📅 Date: August 3, 2025
📈 Bias: Bullish but extended — high in premium
🔸 Monthly Overview
📊 Trend: Bullish continuation (CHoCH April 2023)
🧱 Supply Zone: 3350–3439 → monthly wick trap
⚠️ RSI 80+, price nearing 100% Fib extension
🔮 Breakout above 3439 → 3505 / 3610 next
🔻 Rejection → pullback to 3270 / 3180
🔸 Weekly Outlook
💥 Structure: Strong bullish, EMA stack intact
🟥 Final HTF Supply: 3350–3439 (currently testing)
🟦 Demand Below: 3270 → 3215 → 3070
🎯 Targets if breakout: 3505 → 3560 → 3610
🔸 Daily Structure
⚔️ Now testing: 3355–3375 → last valid supply
🎭 Above that → internal trap at 3398–3412
🧨 Final ceiling at 3430–3439 — breakout or reversal?
🔸 H4 / H1 Key Zones
🟥 Supply: 3360–3375 / 3385–3398 / 3430–3439
🟫 Flip Long Zone: 3322–3310
🟦 Bullish Demand: 3285–3260 → 3222–3205
⚠️ RSI elevated, watch for reaction not breakout
🔹 Execution Plan
✅ Above 3439 → Expansion to 3505 / 3610
🔁 Pullback to 3325 / 3285 → Sniper long zones
🔻 Rejection from 3375 → Short scalp → Target 3320
📌 3439 = Key Monthly Pivot
🟢 Hold above → New expansion wave
🔴 Fail below → Retrace toward value
Extended:
🔸 Scenario 1: Breakout and Expansion
If bulls push through 3375 with conviction and break above 3439, gold enters a fresh leg of macro price discovery. This would activate a clean expansion path toward:
3405 (short-term extension)
3505 → 3560 → 3610 (Fibonacci projections)
3740 (full trend extension if momentum persists)
This scenario requires solid bullish confirmation, especially on H4 or D1 structure. Traders should look for LTF OB re-entries or bullish flags above 3350 to join the trend safely.
🔸 Scenario 2: Rejection and Retrace
If gold rejects from the 3360–3375 zone and fails to hold above it, a controlled retracement is likely. Key downside targets include:
3325 → first flip zone for re-entry
3285 → origin of the latest rally (strong buy zone)
3215–3180 → high-timeframe demand and imbalance fill
Only a breakdown below 3260 would threaten the bullish structure and shift bias toward neutral or bearish.
🔸 Conclusion
Gold is approaching its inflection point. The macro trend is intact, but momentum is stretched, and the market now demands clear validation.
📌 3439 remains the weekly pivot:
Above → Expansion toward 3500+
Below → Retracement to reclaim value
For next week, the most probable path is early consolidation inside 3360–3375, followed by a decisive reaction — either continuation toward 3405+, or a corrective drop toward 3325/3285 to reset structure.
Disclaimer: For educational context only.
#XAUUSD #Gold #SmartMoney #TradingAnalysis #SMC #USD #GoldOutlook

Gold - The diligent top formation!🏆Gold ( TVC:GOLD ) finished the bullrun:
🔎Analysis summary:
For the past 10 years, Gold has been trading in a very strong expected bullrun. Just like we witnessed it in 2011, a 10 year bullrun is followed by a shorter term bearmarket. Gold is starting to lose its strength, which is a clear sign of weakness and the beginning of a bearish reversal.
📝Levels to watch:
$2.800
SwingTraderPhil
SwingTrading.Simplified. | Investing.Simplified. | #LONGTERMVISION

XAUUSD Bearish SMC Analysis – Institutional RejectionXAUUSD Bearish SMC Analysis – Institutional Rejection from Supply Zone
Gold (XAUUSD) is showing a clear bearish structure after rejecting a major supply zone at premium pricing. This setup is aligned with Smart Money Concepts (SMC) and reflects how institutions manipulate liquidity and order flow before major price moves.
🔍 Market Structure Context:
The market had been trending upward with higher highs and higher lows, until it approached a key premium supply zone near $3,420.
At this level, price stalled, creating internal Equal Highs (liquidity) — a common trap used by institutions to grab orders before reversing.
🔄 Change of Character (CHoCH):
A clear CHoCH was printed when price broke below the most recent higher low, signaling a shift from bullish to bearish structure.
This change marked the first early signal that institutional order flow has flipped bearish, and distribution is underway.
📉 Break of Structure (BOS):
Following the CHoCH, the market confirmed intent with a clean BOS to the downside.
This structural break confirms bearish control and validates short bias.
🧲 Liquidity Engineering:
Equal Highs were swept at the top, indicating a liquidity grab before institutions drove price downward.
This move traps breakout buyers and provides large players with sell-side execution at premium pricing.
🧱 Fair Value Gap (FVG) & Supply Zone Mitigation:
After BOS, price retraced into a Bearish Fair Value Gap (FVG) and the origin of the supply zone, offering a high-probability entry.
The rejection from this zone showed imbalance was respected and no bullish continuation existed — further validating the short setup.
🔍 Confluences for the Bearish Bias:
Confluence Confirmation
CHoCH Structure flipped bearish
BOS Bearish continuation confirmed
Liquidity Sweep Equal highs taken
FVG Retest Smart Money re-entry signal
Supply Zone Mitigation Institutional reaction confirmed
📘 Educational Summary:
This setup exemplifies a complete Smart Money bearish reversal model:
Premium pricing ✅
Liquidity taken ✅
Structure flipped (CHoCH + BOS) ✅
Supply & FVG respected ✅
It reflects how institutions build positions quietly, using engineered liquidity to trap retail traders, and then drive price with high-volume imbalance moves.

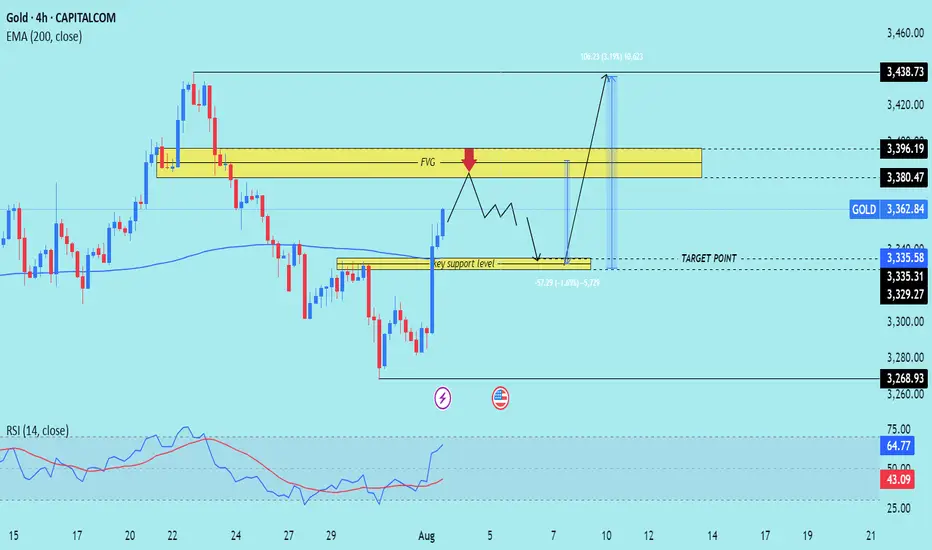
XAU/USD) Bearish Trend Read The captionSMC Trading point update
Technical analysis of (XAU/USD) on the 4-hour timeframe, showing both a potential retracement and a bullish continuation.
---
Technical Breakdown:
1. Current Market Structure:
Price recently made a strong bullish push from the key support level (~3,329–3,335), breaking structure to the upside.
It is now approaching a Fair Value Gap (FVG) and resistance zone between 3,380.47 and 3,396.19.
2. Key Zones Identified:
FVG / Resistance Zone: 3,380.47–3,396.19 — where price might initially reject (red arrow) due to unfilled imbalance and previous supply.
Key Support Zone: 3,329.27–3,335.31 — potential area of re-entry or demand if price pulls back.
EMA 200 (Blue): Currently at 3,335.58, aligning with key support.
3. Price Path Scenarios:
Primary Expectation: Price may tap into the FVG, face rejection, then pull back into the key support level for a higher low.
From there, it is projected to bounce back strongly toward the ultimate target at 3,438.73, marking a 3.19% upside move.
4. RSI (14):
RSI at 64.77, indicating strong bullish momentum but not yet in overbought territory. Favorable for continuation, but a short-term correction is possible.
Mr SMC Trading point
---
Trade Idea Summary:
Bias: Bullish (after a short-term rejection)
Entry Zones:
Watch for rejection at 3,380–3,396
Look to enter on a retest of 3,335–3,329 support
Target Zone: 3,438.73
Invalidation: Sustained breakdown below 3,329 or bearish engulfing with high volume
EMA & RSI Support: EMA 200 backs bullish bias; RSI confirms momentum
Please support boost 🚀 this analysis)
XAUUSD Potential buy and sell zone!XAUUSD Potentially coming for a dipper pullback as upon crossing the daily high we can see XAUUSD started reject from higher price and continue to drop to this daily and weekly support and may continue to drop.
It is possible for the market to potentially bounce off the weekly support as the market is moving up with a stronger momentum

XAUUSD Long - DiscretionaryElite Analysis - Discretionary Trade
Not Rules Based Execution
Executed in a lower OB in lower time frame
Targeting upper liquidity pools
I believe we are bullish on gold until structured liquidity, than we will see an violent drop.

Gold (XAU/USD) Technical Analysis – NeoWave Perspective📅 August 2025 | 📈 4H Chart
📍Posted by: @ CryptoPilot
Gold completed a corrective Wave A near $3160 at the bottom of the descending channel. It then rallied to $3440, followed by a decline toward the channel’s midline at $3227, beginning a potential Wave C.
Attempts to break and hold above the channel failed. Price has since broken below the trendline and is now pulling back to retest it from below.
⸻
🔍 Key Insights:
• 📉 No long entries recommended at current levels
• ✅ Bullish confirmation requires a clear breakout and close above the channel top
• 🛒 Safer long setup may emerge near $3120 at the channel bottom and possible Wave C completion zone.
⸻
🔑 Key Levels:
• Resistance: $3380–$3440
• Support: $3120
• Invalidation / Stop-loss: Below $3110
⸻
📌 Follow @ CryptoPilot for more wave structure insights, SMC confluence, and multi-timeframe strategies.
💬 Drop your thoughts and alternate counts in the comments below!


XAUUSD Gold Trading Strategy August 7, 2025XAUUSD Gold Trading Strategy August 7, 2025:
Gold prices are steady as US President Donald Trump has imposed an additional 25% tariff on Indian goods due to India's continued purchases of Russian energy. This new measure raises the current 25% tariff on Indian goods to 50%.
Fundamental news: The current market pulse is still mainly revolving around the tariff story initiated by Trump, in which spot gold is trading in a fairly narrow range. Gold is still waiting for further impact from the Fed's interest rate cut process, a weaker dollar will create support for non-yielding gold.
Technical analysis: The trading range of gold prices is currently narrowing, RSI on H1 and H4 frames is approaching the overbought zone. Gold prices have recovered, but resistance zones such as 3400 - 3405 and 3420 - 3425 can be short-term profit-taking areas for investors. Liquidity zones and Fibonacci frames show that the upward force of gold prices is showing signs of slowing down.
Important price zones today: 3373 - 3378, 3400 - 3405 and 3420 - 3425.
Trading trend today: SELL.
Recommended orders:
Plan 1: SELL XAUUSD zone 3402 - 3404
SL 3407
TP 3399 - 3390 - 3380 - 3360 - OPEN.
Plan 2: SELL XAUUSD zone 3423 - 3425
SL 3428
TP 3420 - 3410 - 3390 - 3370 - OPEN.
Plan 3: BUY XAUUSD zone 3373 - 3375
SL 3370
TP 3378 - 3388 - 3400 (small volume).
Wishing you a safe, successful and profitable trading day.💗💗💗💗💗

Gold Trading Opportunity
---
### ⚡️ **– Harmonic Setup You Don’t Want to Miss**
🚨 **"We’re standing at the edge of a golden reversal!"**
The *Gartley* and *Deep Crab* harmonic patterns have formed with stunning precision, signaling a powerful potential drop*. This level is not just a number—it’s a pressure point where a reversal pattern converges with a high-volume **supply zone**, amplified by a strong **RSI overbought signal**.
💼 With disciplined **risk management** and clearly defined **stop-loss and multi-tier targets**, we’re positioning ourselves for a calculated and confident short move.
This is not guesswork—it’s a textbook setup backed by structure, momentum, and sentiment.
🔥 Don’t chase the market. Let it come to you. This setup rewards patience and precision.
---

Gold - M30 Buy SetupOANDA:XAUUSD TVC:GOLD
Timeframe: m30
Risk Level: Low-Medium
🔹 Setup:
Price is testing the boundary of the ascending channel and retesting the support @ 3350
📈 Entry:
Current price zone: 3360-65
🎯 Targets (TP):
TP1: 3375
TP2: 3385
TP4: 3410
TP6: 3430
⛔ Stop Loss (SL):
3349
H4 Overview:
PEPPERSTONE:XAUUSD
#XAUUSD #GOLD #Buy #Signal #MJTrading
Psychology Always Matters:

Gold Trading Strategy August 8XAUUSD – Bullish Breakout from Triangle Pattern
Gold has officially broken the upper boundary of the triangle accumulation pattern, confirming the continuation of the uptrend. This bullish momentum is heading directly towards the 3430 area, and if the buying pressure is maintained, the 3445 level is completely within reach.
Today is Friday, the closing day of the weekly candle, so the oscillation amplitude is usually stronger and the price can easily approach new peaks. Observation shows that the buying pressure in the US session has been maintained continuously in recent days - this supports the strategy of BUYing now and holding until the US market opens.
Support zone: 3385 – 3365 – 3333
Resistance zone: 3419 – 3431 – 3445