Gold is in the bullish direction after correcting the supportHello Traders
In This Chart GOLD HOURLY Forex Forecast By FOREX PLANET
today Gold analysis 👆
🟢This Chart includes_ (GOLD market update)
🟢What is The Next Opportunity on GOLD Market
🟢how to Enter to the Valid Entry With Assurance Profit
This CHART is For Trader's that Want to Improve Their Technical Analysis Skills and Their Trading By Understanding How To Analyze The Market Using Multiple Timeframes and Understanding The Bigger Picture on the Charts
GOLD trade ideas
GOLD down slightly, watch today's data, technical conditionsOANDA:XAUUSD edged lower in Asian trading on Tuesday (August 5), currently trading around $3,380/ounce. On Tuesday, the US ISM services PMI will be released, which is the most important economic data of the week and is expected to impact the gold market.
OANDA:XAUUSD prices surged after weak jobs data increased the possibility of the Federal Reserve cutting interest rates.
Data released last Friday showed that the number of new jobs in the US non-farm sector in July was much lower than expected, and the total number of non-farm jobs in the first two months was revised down by 258,000, indicating a sharp deterioration in the labor market.
Traders now see an 87% chance of a rate cut in September, up from 63% last week, according to CME Group's FedWatch tool. Expectations of a rate cut have boosted gold prices, as the dollar provides support for the precious metal.
The US ISM non-manufacturing purchasing managers index (PMI) for July will be released today (Tuesday) and is expected to be 51.5, up from 50.8 previously.
The July ISM services PMI could impact the US dollar and gold, depending on whether it is biased towards supporting a rate cut or pausing rate cuts for an extended period.
Gold itself does not generate interest, but generally performs well in low-interest-rate environments and is seen as an inflation hedge.
On the trade front
Today (August 5), US President Donald Trump threatened to raise tariffs on Indian goods in protest at India's purchase of Russian oil. New Delhi called Trump's attack "absurd" and pledged to protect its economic interests, deepening the trade rift between the two countries.
Trump posted on the social media platform Truth Social: "India not only buys massive amounts of Russian oil, but also sells much of it on the open market at a huge profit. They don't care how many people are being killed in Ukraine by the Russian war machine."
Trump added: "Accordingly, I will be substantially increasing the tariffs that India pays to the United States."
However, Trump did not specify the specific tariff amount.
Responding to Trump's remarks, an Indian foreign ministry spokesperson said on Monday that India would "take all necessary measures to protect its national interests and economic security." The spokesperson added: "These actions against India are unjustified and unjustifiable."
Over the weekend, Reuters reported that India would continue to buy oil from Russia despite Trump’s threats.
In July, Trump announced that he would impose a 25% tariff on imports from India, and US officials have also pointed to a range of geopolitical issues as holding up the signing of a US-India trade deal.
Trump has also described the BRICS group as generally hostile to the US. Those countries have rejected Trump’s accusations, saying the group protects the interests of its members and the developing world as a whole.
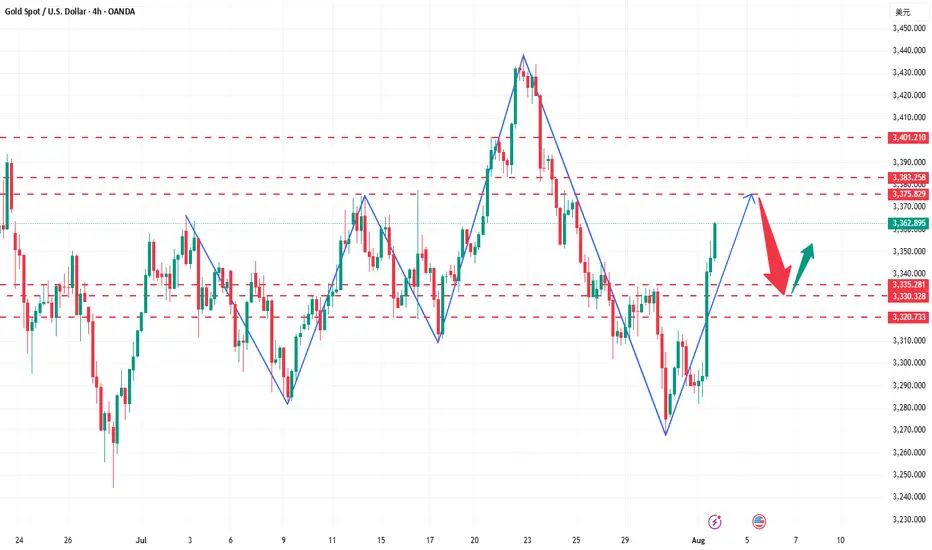
Technical Outlook Analysis OANDA:XAUUSD
On the daily chart, although gold has been very volatile in recent times, it is still moving sideways, with price action clinging to the EMA21. And after a strong recovery in the past three trading sessions, gold is temporarily limited by the 0.236% Fibonacci retracement level, which was the bullish target that readers paid attention to earlier. The return above the EMA21 provides gold with initial conditions for bullish expectations, but a new trend has not yet formed.
If gold takes its price action above the 0.236% Fibonacci retracement level and stabilizes above it, it will have room to continue rising with the next target being the raw price point of $3,400 rather than the $3,430-$3,450 target. But at its current position, it still has no clear trend either up or down.
Meanwhile, once gold sells below the 0.382% Fibonacci retracement level, it could continue to decline with a target of $3,246 in the short term, which also means that the $3,300 – $3,292 area is the current key support area.
Momentum-wise, the Relative Strength Index (RSI) is also hovering around 50 with little fluctuation, indicating a hesitant sentiment in the market without leaning to either side.
For the day, the technical outlook for gold is a sideways consolidation but the technical conditions are slightly more bullish, and the notable positions are listed as follows.
Support: $3,350 – $3,340 – $3,300
Resistance: $3,400 – $3,430
SELL XAUUSD PRICE 3402 - 3400⚡️
↠↠ Stop Loss 3406
→Take Profit 1 3394
↨
→Take Profit 2 3388
BUY XAUUSD PRICE 3329 - 3331⚡️
↠↠ Stop Loss 3325
→Take Profit 1 3337
↨
→Take Profit 2 3343
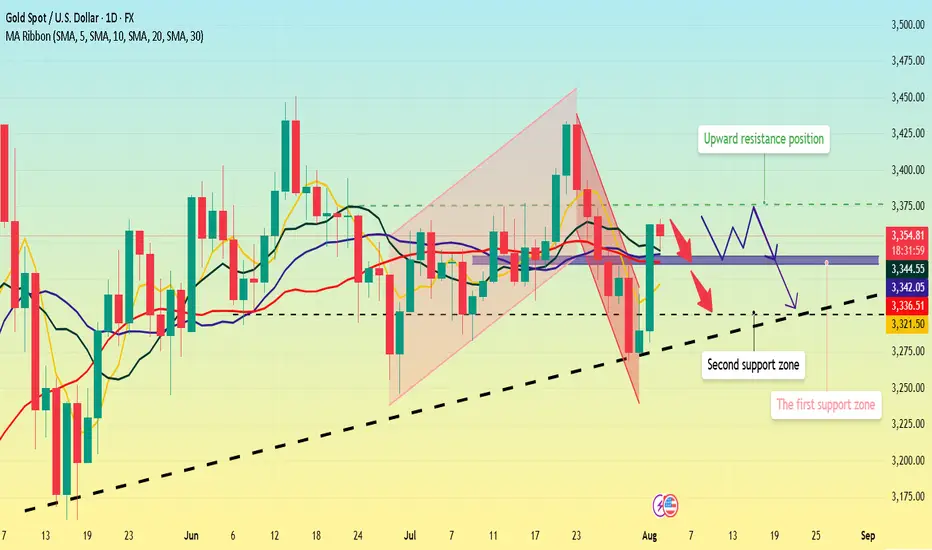
Gold prices are fluctuating. Is a correction coming?Gold surged last Friday, directly breaking through multiple moving average resistance levels. This trend is quite strong. Currently, the 5-day moving average has turned upward, indicating short-term upward momentum; however, the 10-day moving average remains slightly downward, indicating some divergence in the short- and medium-term trends. The 20- and 30-day moving averages have flattened. Overall, the short-term moving averages are less reliable, making it difficult to clearly predict the precise short-term trend based on them.
Since mid-May, gold has been fluctuating widely at high levels. Within this trend pattern, continued monitoring of fluctuations within this broad range is warranted. Until a major trend breakout occurs, the overall approach should be to maintain a volatile outlook and avoid prematurely declaring a unilateral trend.
The upper resistance level is around 3375, which has been repeatedly suppressed during previous price fluctuations. Focus on support in the 3340-3335 area below. This marks the low point after last Friday's sharp rise. The market has stabilized in this area and continued its upward trend. If the decline is significant, the 3300 round-number resistance level will need to be monitored.
Trading strategy:
For aggressive trading, short around 3375 with a stop-loss at 3385 and a profit range of 3345-3335.
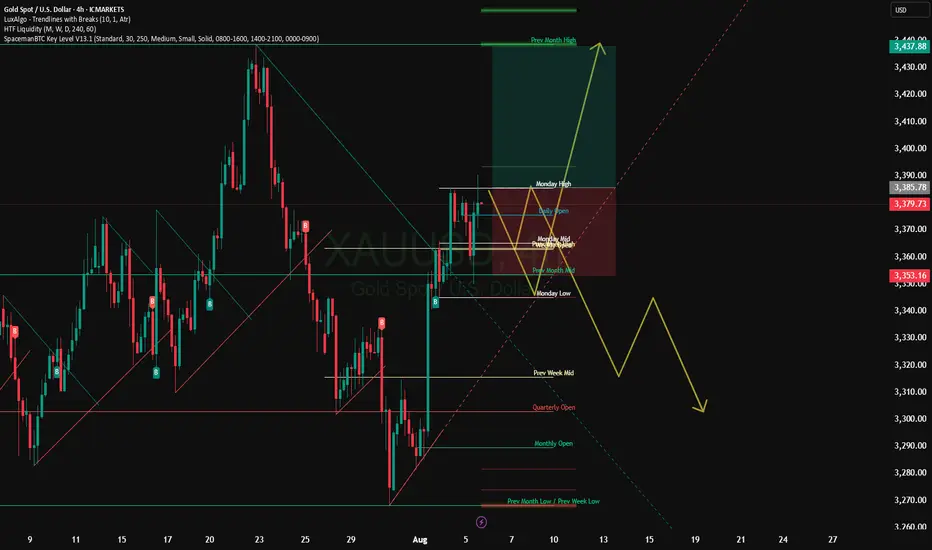
XAU/USD GOLD NFP DIRECTIONThis chart analysis is for XAU/USD (Gold vs. U.S. Dollar) on the 4-hour timeframe. The focus is on a bearish market structure, highlighting potential Price of Interest (POI) zones for a short (sell) setup.
Key Elements:
Market Structure: Clear downtrend with lower highs and lower lows.
POIs Identified:
Optional POI: An initial supply zone where price might react.
Extreme POI: A more significant supply zone marked for a stronger potential reversal.
Labels & Notes:
The price levels are marked between 3,320 – 3,340, showing where the reversal is expected.
Interpretation:
The chart anticipates a retracement upward into the POIs before continuing the bearish move. Traders may look to enter short positions around these zones, especially the Extreme POI, which is seen as a high-probability reversal area.

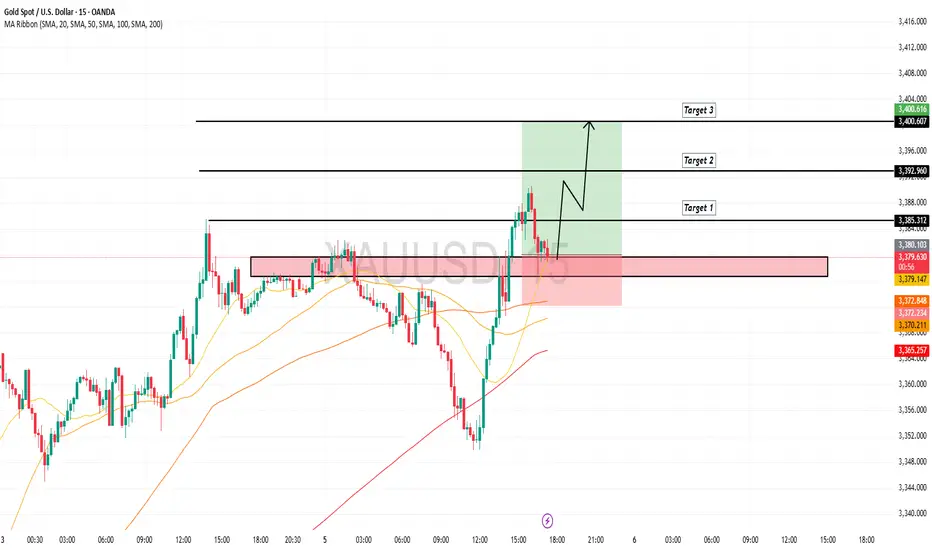
XAUUSD Gold Intraday Setup 8 Aug 2025Price is currently respecting the ascending trendline and a nearby demand zone around 3385. If price holds above this level, a potential long setup may develop.
Entry: Around 3385 (upon confirmation of support holding)
Stop Loss: Below 3375 (invalidate if this low breaks)
Target: Previous swing high near 3409
The setup aligns with the ongoing bullish structure. Monitor price action near the trendline for confirmation before entering.

08/08/25 Gold Swing Levels08/08/25 levels are marked; expecting an up trend
Always, price action determines trade.
Trade parameters
Entry on 5 min chart
Sl: 30-50pips
TP: 2-4x SL

SMART MONEY CONCEPT (SMC)📉 Análisis Bajista XAU/USD – SMC
🔹 1. Market Context
Price completed the mitigation of the 4H FVG, closing the previous bullish cycle. This opens the door for a new bearish impulse, as there is no remaining imbalance to fill in that zone.
🔹 2. Structure Shift
• Trendline break confirming loss of bullish momentum
• Clear ChoCh and BOS after the break
• Strong rejection at the resistance zone
🔹 3. Entry Zone
• 15M Order Block (OB-15M) marked as optimal sell entry after rejection
• Entry aligned with bearish structure confirmation
🔹 4. Target
• Aiming for the support zone, where resting liquidity is likely to be taken
• Stop Loss placed above resistance to protect from potential fake outs
💡 Summary:
Bullish cycle completed → structure shift → resistance rejection → bearish projection towards support with high probability. GOOD LUCK TRADERS… ;)

Gold - The diligent top formation!🏆Gold ( TVC:GOLD ) finished the bullrun:
🔎Analysis summary:
For the past 10 years, Gold has been trading in a very strong expected bullrun. Just like we witnessed it in 2011, a 10 year bullrun is followed by a shorter term bearmarket. Gold is starting to lose its strength, which is a clear sign of weakness and the beginning of a bearish reversal.
📝Levels to watch:
$2.800
SwingTraderPhil
SwingTrading.Simplified. | Investing.Simplified. | #LONGTERMVISION

Report - 8 August, 2025EVENT OVERVIEW & MARKET REACTIONS
President Trump’s decision to double existing tariffs on Indian imports—from 25% to a total of 50%—has escalated geopolitical tensions, especially as the justification centers on India’s continued purchase of Russian oil. This marks a significant deterioration in U.S.-India relations, which had been relatively stable despite differences in trade and defense procurement. New Delhi responded sharply, denouncing the tariffs as “unfair” and “unreasonable.” Market reaction in India was immediate, with the Nifty 50 falling 1.2% intraday and the rupee weakening slightly against the dollar, reflecting investor nervousness over geopolitical risk.
In the U.S., equity markets shrugged off the geopolitical risk, buoyed by strong corporate earnings and major announcements like Apple’s $100bn domestic investment to relocate manufacturing and circumvent tariffs. The S&P 500 and Nasdaq gained 0.7% and 1% respectively. Apple shares rose 5.8% after the White House praised its reshoring strategy, helping mask broader anxieties. The dollar index (DXY) fell 0.4% as markets increased bets on imminent Fed rate cuts. U.S. 10-year Treasury yields rose 4bps to 4.23%, suggesting some reallocation from bonds into equities despite Fed dovish expectations.
Oil markets remained volatile but ultimately firmed slightly, as traders weighed OPEC+'s impending production increases against longer-term structural demand from India and China. Crude oil held near $78/barrel, while gold remained elevated at $2,072/oz, underscoring lingering investor caution amid geopolitical and monetary uncertainty.
STRATEGIC FORECASTS
The doubling of tariffs on India is not just a bilateral issue—it is a strategic signal. Trump is making it clear that U.S. allies who defy his energy sanctions regime will be punished economically, regardless of shared democratic values. This recalibration raises risks of fragmentation among the so-called "Indo-Pacific Quad" and undermines the credibility of U.S.-India defense cooperation, which had recently expanded under frameworks like iCET (Initiative on Critical and Emerging Technology).
In the near term, India will likely seek to diversify its export markets while doubling down on domestic resilience policies. However, the Modi administration will also be under pressure from global investors—particularly those supporting the "China+1" strategy—to maintain open channels with Washington. The Apple announcement only intensifies pressure on India, as it highlights the cost of geopolitical non-alignment.
Elsewhere, geopolitical instability continues to compound: Berkshire Hathaway shares are underperforming as Warren Buffett exits; UK-China relations are fraying over embassy construction; and Switzerland continues to reel from a 39% tariff shock. These converging flashpoints are indicative of a more transactional, power-politics-driven global order in which traditional alliances no longer guarantee trade security.
FISCAL AND POLITICAL IMPLICATIONS
Trump’s tariff war is no longer just about economic protectionism—it is now a tool of direct foreign policy coercion. The targeting of India, despite its status as the fifth-largest economy and a major U.S. trade partner, shows a willingness to weaponize the U.S. consumer market against strategic allies. For India, this is politically damaging. The Modi government had made substantial diplomatic overtures to Washington and is now politically cornered between maintaining sovereignty in energy policy and sustaining access to its largest export market.
For the U.S., there are short-term political gains. Trump’s base is likely to support these aggressive moves as evidence of “economic patriotism,” and domestic reshoring by companies like Apple lends weight to his industrial revival narrative. However, the long-term cost could be a more fractured, de-dollarized trading world, with allies exploring new coalitions that reduce exposure to U.S. leverage.
RISKS
Geopolitical Fracture: The breakdown in U.S.-India ties could ripple through other Indo-Pacific partnerships, weakening containment strategies against China.
Investor Sentiment in India: With India now seen as a target rather than a partner, capital inflows could slow, especially in high-growth sectors like electronics manufacturing.
Commodities Volatility: Continued weaponization of oil trade—whether through tariffs or sanctions—keeps crude markets vulnerable to shocks.
Policy Overreach: Trump’s escalating use of trade tools risks overplaying U.S. leverage, potentially provoking multilateral backlash or retaliatory coalitions.
OPPORTUNITIES
U.S. Tech Reindustrialization: Apple’s $100bn commitment shows companies can turn geopolitical headwinds into domestic capex tailwinds—bolstering U.S. factory growth.
Gold as Safe Haven: With the Fed likely to ease and global risks rising, gold is well-positioned to continue attracting risk-averse capital.
Currency Arbitrage: USD weakness opens the door for tactical positioning in high-yield currencies like INR and BRL—if investors can hedge policy volatility.
Reshoring Supply Chains: The shift of production from India, China, and Southeast Asia to U.S. and Mexico-based facilities presents a logistics and construction boom in North America.
ASSET IMPACT OUTLOOK
XAUUSD (Gold)
Safe-haven demand is strong amid worsening U.S.-India relations and fears of sanctions spillovers. Real yields are falling; Fed dovishness supports further upside.
S&P 500
Strong corporate earnings and reshoring announcements are temporarily offsetting macro fears. But any further escalation in tariffs could pressure margins and global exposure.
USDJPY
As the dollar softens on dovish Fed bets and rising geopolitical risk, JPY gains as a safe-haven. Yen could strengthen further if bond volatility stabilizes.
DXY (US Dollar Index)
Despite strong U.S. equities, softer data and rising expectations for rate cuts are pushing the dollar lower. DXY could test 101 in coming weeks.
Crude Oil (Brent/WTI)
Volatile. OPEC+ supply increases are counterbalanced by continued demand from India and fears of sanctions. Oil likely range-bound $75–$82 near term.
Dow Jones
Blue-chip industrials may benefit from reshoring and stimulus bets, though tariff risks remain. Broad market support from positive earnings surprises.
INR (Indian Rupee)
Facing downside pressure from geopolitical risk premium, outflows, and weaker confidence in export stability. May weaken toward 84.5 per USD short term.

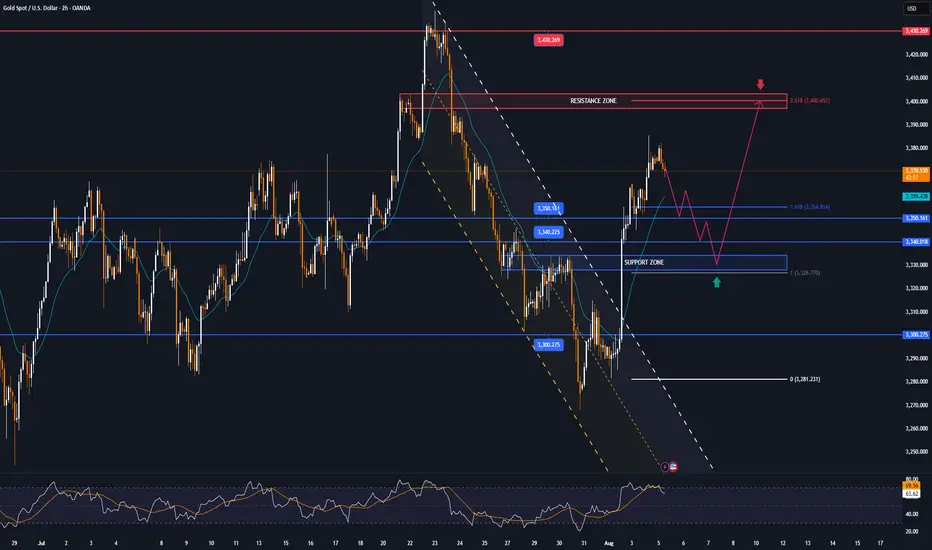
XAUUSD The beginning of large-scale growthCurrent picture and structure
The instrument is trading in a narrow range of $3,360-3,375, demonstrating low volatility - ADX is at the low of 2025, which confirms consolidation
The price is held inside a long-term ascending channel, with an increase of about 27% since the beginning of 2024
Indicators and signals
RSI (14): around 58-59, indicates moderate overbought, but remains in the bullish momentum zone
Stochastic (%K ~61%) and MACD (value ~3.8): Buy signals - short-term upward momentum is confirmed
ADX (14): around 23-24 - range, weak trend without a clear direction
Moving averages on different timeframes give a common signal indicator "Strong Buy" in daily and weekly frames
Support and resistance levels
Key support:
$3,360 — current lower stop range
$3,330–3,293 — swing low zone, critical for short-term sales
Main resistance:
$3,400–3,415 — profit acceptance zone and possible reversal pressure
$3,450 — psychological and technical barrier upon breakout of current zone
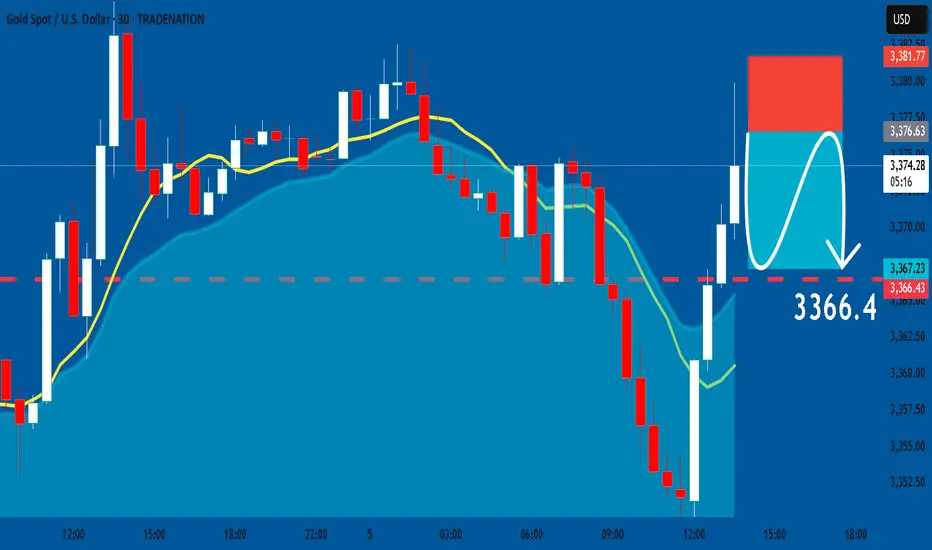
GOLD: Short Signal with Entry/SL/TP
GOLD
- Classic bearish setup
- Our team expects bearish continuation
SUGGESTED TRADE:
Swing Trade
Short GOLD
Entry Point - 3376.5
Stop Loss - 3381.7
Take Profit - 3366.4
Our Risk - 1%
Start protection of your profits from lower levels
Disclosure: I am part of Trade Nation's Influencer program and receive a monthly fee for using their TradingView charts in my analysis.
❤️ Please, support our work with like & comment! ❤️
Gold weekly chart with buy and sell entries plus swing trade ide1. Overall Chart Analysis
Timeframe and Trend: This 4-hour chart highlights a short-term downtrend with signs of exhaustion and consolidation. Gold peaked sharply on the left (possibly a local high around 2,400+), followed by a steep decline with lower highs and lower lows, forming what looks like a descending channel (diagonal trendlines connecting peaks and troughs). Recent candles show sideways ranging with smaller bodies and wicks, indicating indecision or a potential reversal setup. This could be a bear flag pattern or a base for accumulation.
Key Patterns:
Bearish Decline: Strong red candles early on suggest impulsive selling, possibly driven by external factors like USD strength or rising yields. However, the downtrend is losing steam, with recent bounces off lower levels.
Range-Bound Action: Price is trapped in a horizontal range (bounded by your marked lines), with dojis and spinning tops signaling buyer-seller balance. A breakout could lead to a volatile move.
Support and Resistance: Your green lines (lower) align with support zones where price has reversed upward multiple times. Red lines (upper) act as resistance caps, rejecting rallies.
Indicators (Inferred):
Moving Averages: Price is likely below key MAs (e.g., 50-period or 200-period EMA), confirming bearish bias. A golden cross (shorter MA crossing above longer) near green lines could validate buys.
RSI (Relative Strength Index): Potentially oversold (below 30) at green line tests, supporting buy entries. Neutral or overbought (above 70) near red lines would favor sells.
Volume and Momentum: Volume bars on the right show spikes on down moves but fading recently, hinting at bearish exhaustion. MACD might show narrowing histograms, indicating weakening momentum.
Volatility: If Bollinger Bands are applied, they're likely contracting, suggesting an imminent expansion (breakout).
Market Bias: Bearish in the short term due to the downtrend, but with bullish potential if support holds (gold's macro uptrend from inflation/geopolitical hedging). Watch for catalysts like US economic data or Fed announcements. The setup favors range trading (buy low, sell high) until a clear breakout.
Risk Considerations: Gold can move 50-100 pips per 4H candle; use tight stop-losses (SL) 1-2% away from entries. Risk no more than 1% of your account per trade. Multi-timeframe confirmation (e.g., daily chart) is recommended.
2. Analysis of Marked Levels and Entry Rationale
Your lines are horizontal, with green lines clustered at lower price levels (buy zones, e.g., around 2,300–2,320) and red lines at higher levels (sell zones, e.g., around 2,340–2,360). These appear to be based on prior price action (swing points). I'll group them by color and explain the technicals, drawing from support/resistance, patterns, Fibonacci, and momentum.
Green Lines: Potential Buy Entries (Bullish Setups)
These lower lines seem to mark strong support areas where price has bounced repeatedly, often with bullish candle formations. They could represent the floor of the descending channel or a demand zone.
Technicals Supporting Buys:
Support Zones: Green lines align with historical swing lows (e.g., visible double or triple bottoms in the chart's dips), where buyers have defended price. This creates a "value area" for accumulation, especially in gold's broader bullish context.
Candlestick Patterns: Bullish signals like hammers, bullish engulfing, or long lower wicks appear at these levels—indicating rejection of lower prices and potential reversal. For example, a green candle closing above the line after a touch would confirm entry.
Fibonacci Retracement: Drawing from the chart's high (left peak) to low, green lines likely hit key levels like 61.8% or 78.6% retracements—common for buying deep pullbacks in trending markets.
Momentum and Divergence: RSI bullish divergence (price lower lows, RSI higher lows) or an oversold reading supports upside. The downtrend's slowing pace (smaller red candles) suggests fading sellers.
Trend Context: These are counter-trend buys in a downtrend—ideal for scalps or reversals. Wait for confirmation, like a 4H close above the green line or increased volume.
Entry Strategy: Enter long on a retest of the green line with bullish confirmation (e.g., RSI >30 crossover). Place SL 20-30 pips below the line to account for wicks.
Suggested Take-Profit Levels:
TP1 (Conservative): Nearest minor resistance or 38.2% Fibonacci level—e.g., if entry at ~2,310, TP at 2,330 (1:1 risk-reward, ~20 pips profit for quick partial exit).
TP2 (Aggressive): Mid-range or next red line—e.g., 2,340–2,350 (1:2 ratio, scale out 50% of position).
Stretch TP3: If bullish breakout above the channel, target prior highs (e.g., 2,370–2,400). Trail stops using a 20-period MA or ATR-based levels for dynamic exits.
Red Lines: Potential Sell Entries (Bearish Setups)
These upper lines appear to cap price action, with rejections forming bearish patterns. They could be the ceiling of the channel or supply zones.
Technicals Supporting Sells:
Resistance Zones: Red lines correspond to prior swing highs (e.g., failed rallies in the mid-chart), round psychological numbers, or the upper channel boundary. Multiple touches with downside reversals confirm seller control.
Candlestick Patterns: Bearish indicators like shooting stars, bearish engulfing, or long upper wicks at red lines signal rally failures—sellers stepping in aggressively.
Fibonacci Extension/Retracement: From the downtrend's wave, red lines might align with 38.2% or 50% retracements—prime spots for selling into strength within a bearish structure.
Momentum Indicators: RSI overbought (above 70) or bearish divergence (price higher highs, RSI lower highs) at these levels reinforces downside. MACD line cross below signal line could trigger entries.
Trend Context: Aligns perfectly with the downtrend's "sell the rallies" mantra. The overall lower highs pattern suggests continuation unless broken.
Entry Strategy: Enter short on a rejection from the red line (e.g., red candle close below it with volume). Place SL 20-30 pips above the line.
Suggested Take-Profit Levels:
TP1 (Conservative): Nearest minor support or green line below—e.g., if entry at ~2,350, TP at 2,330 (1:1 ratio, ~20 pips for scalping).
TP2 (Aggressive): Lower range or channel support—e.g., 2,310–2,300 (1:2 ratio, partial close).
Stretch TP3: If bearish breakdown below green lines, target extended supports (e.g., 2,280–2,250 via 161.8% Fibonacci extension). Trail stops with a parabolic SAR or based on recent swing lows.
3. Additional Suggestions and Scenarios
Breakout Scenarios:
Bullish Breakout: A strong close above the highest red line (e.g., on high volume or positive news) invalidates sells—switch to longs targeting 2,400+ (macro resistance).
Bearish Breakdown: Close below the lowest green line accelerates downside to 2,250–2,280 (next major support, possibly a monthly low).
Risk-Reward and Position Management:
Prioritize 1:2+ RR (e.g., risk 20 pips to gain 40+). Use partial profits: Exit 50% at TP1, trail the rest.
Combine with oscillators: Avoid buys if RSI <20 (extreme oversold) or sells if >80 (overbought).
Time of Day: Gold volatility peaks in NY/London sessions; avoid thin markets.
Potential Biases or Warnings:
Gold's inverse correlation to USD (check DXY) or bonds could override technicals—e.g., a weak USD might break red lines upward.
The range is tightening; a false breakout is possible. If consolidation persists, consider straddle strategies.
This is a technical view only; fundamental shifts (e.g., Middle East tensions boosting gold) could alter dynamics.

GOLD 7.8.25 I see reversal for last NFP bullish momentum. Already in sells and watching. It can take 4H FVG 35-25 and go UP, so lets make it!

XAU / USD 30 Minute Chart Quick Scalp SellHello traders. As per my previous post, gold moved through my area of interest and I took a small micro lot position. Sold from the red line, closed 75% of the trade's profit at the next red line. My remaining 25% of the trade is the runner, and I will let that run for a bit. My Stop loss is at my entry point, so zero loss, profit secured and I am thankful to BIg G. Let's see what the NY open does in a few hours. Be well and trade the trend. More analysis to come.

XAU / USD Daily ChartHello traders. We are at an area of interest for me which is marked on the chart. We can push down to fill that wick, or reject and move back up a bit to take out any existing short positions in profit. I will post a lower time frame chart shortly. We will see Pre NY volume starting in a little under 2 hours. 7:20 am est here in the US is when we someimes see a shift to sometimes partially correct the overnight session's move. Not saying that's what will happen, just explaining what I see happen a lot of the time. Let's see how things play out. Be well and trade the trend. Shout out to Big G.

XAUUSD: Bullish Now, But Trouble Ahead?Last Friday, buying momentum lifted gold prices, with potential for a further move toward the 3400 level, provided bullish momentum continues.
This move followed a weaker-than-expected Non-Farm Payroll (NFP) report, an uptick in the unemployment rate, and no change in the Fed's interest rate, all of which pressured the U.S. Dollar Index (DXY) lower and supported gold’s rise.
Interestingly, while price advanced, institutional traders reduced their long exposure by nearly 30,000 contracts, indicating some caution or profit-taking at current levels.
I remain bullish in the short term due to macro tailwinds, but bearish in the medium to long term as institutional positioning softens and resistance zones approach.

XAUUSD sclping setupXAUUSD M15 create double doji evning shoting star.
Sell below: 3361.00
Stop Loss: 3364.00
1st TP: 3355
2nd TP: 3351
3rd TP: 3347
4th TP: 3341
If breakout rising trendline and 3340 then gold more downward move 3330, 3318 and 3302.

Gold prices soar to new highs!Market News:
Spot gold prices fluctuated at high levels in early Asian trading on Monday (August 4), currently trading around $3,349 per ounce. Gold prices surged by over 2% last Friday (August 1), reaching a weekly high. This is due to the fact that US July non-farm payroll data fell far short of expectations, increasing the likelihood of a Federal Reserve rate cut. Furthermore, Trump's new round of tariff announcements has fueled safe-haven demand. Global economic uncertainty, a weakening US dollar, and rising expectations of a Fed rate cut have all provided strong momentum for the rise in international gold prices.
Against the backdrop of continued global economic uncertainty, gold's appeal as a safe-haven asset is expected to further increase. Investors should closely monitor market trends to seize potential opportunities. This trading day, attention should be paid to the US June factory orders monthly rate and continued monitoring of news related to the international trade and geopolitical situation.
Technical Analysis:
From a macro perspective, the monthly chart shows four consecutive long upper shadows and three dojis. This high-level doji formation in an uptrend is overwhelming, prompting caution in buying and caution in the market. Be wary of potential sell-offs in the future. We have repeatedly emphasized the importance of the monthly gold chart in recent months!
On a weekly basis, gold bottomed out and rebounded last week, hitting the middle support band and rebounding. Prices remain within the range, currently shrinking to 3268-3438. The Bollinger Bands continue to close, while the MA5 and MA10 levels remain in a volatile pattern. A unilateral trend still needs time to develop. On a daily basis, there was an extreme rally on Friday night, with the daily chart closing with a large real bullish candlestick. The price directly broke through the short-term moving average and the middle support band, forming a strong Yang-enclosing-Yin pattern. This is a positive bullish signal. So, is it a good time to buy on Monday?
I personally don't recommend buying directly from high levels. Gold rebounded from 3268, surging nearly $100 over two trading days without a significant pullback. Even if there was a pullback on Thursday, it was a single-digit pattern, which doesn't provide solid support for a bullish rally. Therefore, I don't recommend chasing long positions. Instead, watch for a potential sell-off after a rally. Focus on resistance at 618 and resistance near 3376, a previous top-bottom reversal.
Looking at gold on both the 4-hour and hourly charts, the Bollinger Bands are showing signs of opening after last Friday's surge. However, it's important to note that such surge-like openings are generally not sustainable, and will close again upon retracing technical indicators. The 4-hour candlestick chart is currently trading above the upper band, no longer favoring a buy-now-up move. The 1-hour moving average is blunting, and the upper band of the Bollinger Band is about to close. Overall, while gold is strong, it's best not to chase the bulls. Focus on selling opportunities on rallies today, and then consider a bullish move after a pullback.
Trading strategy:
Short-term gold: Buy at 3330-3333, stop loss at 3322, target at 3360-3380;
Short-term gold: Sell at 3375-3378, stop loss at 3387, target at 3340-3320;
Key points:
First support level: 3342, second support level: 3330, third support level: 3316
First resistance level: 3376, second resistance level: 3388, third resistance level: 3400

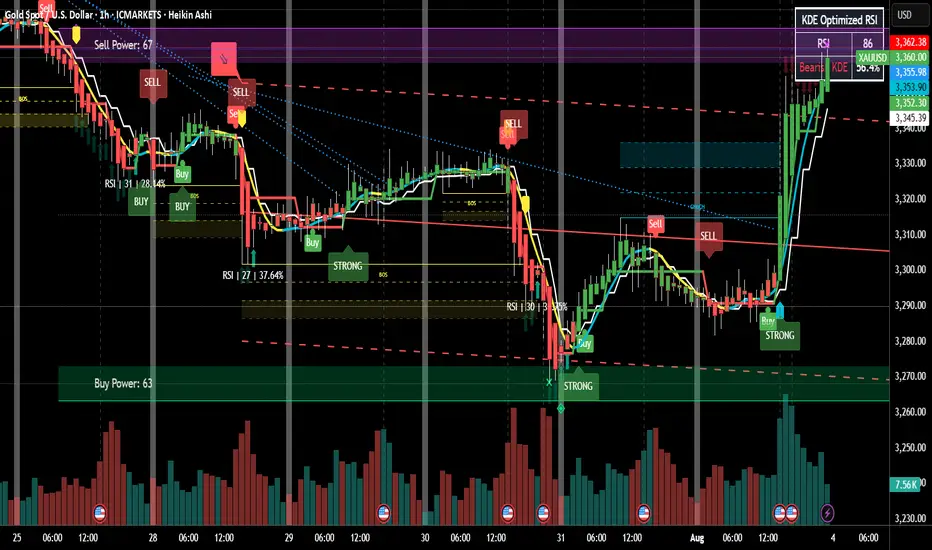
GOLD overheated, fall for the next two to three daysConsidering the following:
1. RSI @ 86
2. constitutional money kicked in crossing upper linear regression
3. price reached the resistance level
4. AND although the last candle was longer than the second last candle, the last volume was shorter than the second last volume line. (crucial for a reversal)
Will place order for a short @ USD3360, take 50% profit at USD3326, close @ USD3280.
Happy trading!
XAUUSD
XAUUSD Updated in H1 :
The gold signal is marked on the chart based on the latest price changes and the supply and demand in the market. These points include the entry point, stop loss, and take profit

The trend is clear, why do I choose to be firmly bullish on goldGold Trend Analysis: Yesterday, the gold market demonstrated strong upward momentum, opening near 3290 before falling slightly to a low of 3281 before fluctuating upward. Boosted by the non-farm payroll data, the gold market surged during the US trading session, reaching a single-day gain of 2.02%, reaching a high of 3363 and closing there. The daily chart formed a long bullish candlestick with a long lower shadow, forming a Morning Star pattern, reinforcing the bullish trend. From the perspective of the cycle structure, the daily level is clearly in the 5-wave upward stage, and the upward trend of the large cycle has not changed. At the indicator level, the daily MACD momentum column (the column below the zero axis) represents the short-selling momentum. Its "gradual shortening" means that the short-selling force is weakening and the downward momentum is gradually fading. It is a potential signal of stopping the decline or rebounding. KDJ is about to form a golden cross between 20-50, which is a signal that short-term bullish power is beginning to increase, and the overall trend is bullish.
The 4-hour level shows typical bullish characteristics: the moving average system is arranged in a bullish pattern, but there is a certain deviation between the short-term price and the moving average. The technical side needs to correct the deviation rate through a callback before continuing to rise. The short-term support below is focused on the line near 3330-3335. This position is both the relay support level in the previous rise and the intersection of the 4-hour moving averages MA10 and MA20, which has strong support strength; the short-term resistance above is focused on the line near 3370-3383. This area is a pressure-intensive area near the previous high point. If it can be effectively broken through, it will further open up upward space. A successful breakout would open up further upside potential. A breakout would further open up the 3400 mark.
For gold trading, the short-term strategy is to buy on dips. If the price pulls back to the 3330-3335 support level, consider entering a long position with a target of 3355-3365. If it reaches 3370-3380, consider a short-term short position with a target of 3350-3340.
Next Stop 3420? Gold Bulls Push the Limit!Gold has shown a step-by-step rise in the short term, and has stood above 3,400 many times, and the bullish force is relatively strong. However, correspondingly, after gold stood above 3400, it fell under pressure several times, so the shape was not particularly good, which increased the risk of pullback in the short term.
However, we do not need to worry. Gold is still running in an ascending wedge structure. Although it has been under pressure and fallen back several times during the attack on 3400, the bullish structure has not been effectively destroyed so far. Moreover, with the sharp increase in gold buying, the 3380-3370 area below has become an obvious intensive trading area, which has greatly limited the gold retracement space.
In addition, after gold broke through 3340, market sentiment tended to be optimistic. If gold experiences a short-term pullback, more funds will flow into the gold market, especially for those who have missed out on long trades before, who will rush into the gold market even more frantically. Under the resonance of the current technical structure and market optimism, gold still has the potential to hit 3400, and bulls are even expected to stand firm at 3400 and make further efforts.
So in terms of short-term trading, I still advocate that gold pullbacks are buying opportunities. And I cherish the opportunity to enter the market and go long in the 3385-3375 area, and am optimistic that gold will hit 3400 again, and may even continue the bull trend to the 3420-3430 area.
OANDA:XAUUSD FOREXCOM:XAUUSD TVC:GOLD FX:XAUUSD CAPITALCOM:GOLD

XAUUSD – Bearish Rejection at Supply Zone, Eyes on 3345On the 1H chart, XAUUSD is currently testing a strong supply zone around 3,395 – 3,400, coinciding with a visible range high-volume node. Price has shown multiple rejections from this area, suggesting that sellers are stepping in.
Key Observations:
Supply Zone: 3,395 – 3,400 (red zone) – price failing to break and sustain above.
Demand Zone: 3,311 – 3,318 (green zone) – previous accumulation area.
Mid Support: 3,345 – potential first target for short positions.
Market Structure: Multiple lower highs forming near supply; possible double top pattern forming.
Volume Profile: High selling pressure in the current region.
Plan:
Expecting a potential rejection from the supply zone with a move down towards 3,345, and if broken, further downside to the 3,311 demand zone. Stops should be placed above the recent swing high at ~3,400 to protect against false breakouts.
Bearish Confirmation:
Clear rejection candle from supply
Break of minor intraday support at 3,370
Increasing selling volume
Disclaimer:
This is for educational purposes only, not financial advice. Always do your own analysis before entering trades.
