GOLD ROUTE MAP UPDATEHey Everyone,
This is a follow-up update on our 1H chart and what can I say, another amazing result!
After hitting our bullish target at 3370 earlier this week, we confirmed the EMA5 cross and lock above 3370 confirming 3392, which I continued to highlight and remind as we bought the dips throughout the week. And today, we finally completed 3392 to perfection.
Next, we’ll be watching for an EMA5 lock above 3392 for a potential continuation. If that fails to lock, we may see some range play between 3392 and 3370.
We will keep the above in mind when taking buys from dips. Our updated levels and weighted levels will allow us to track the movement down and then catch bounces up.
We will continue to buy dips using our support levels taking 20 to 40 pips. As stated before each of our level structures give 20 to 40 pip bounces, which is enough for a nice entry and exit. If you back test the levels we shared every week for the past 24 months, you can see how effectively they were used to trade with or against short/mid term swings and trends.
The swing range give bigger bounces then our weighted levels that's the difference between weighted levels and swing ranges.
BULLISH TARGET
3370 - DONE
EMA5 CROSS AND LOCK ABOVE 3370 WILL OPEN THE FOLLOWING BULLISH TARGETS
3392 - DONE
EMA5 CROSS AND LOCK ABOVE 3392 WILL OPEN THE FOLLOWING BULLISH TARGET
3416
EMA5 CROSS AND LOCK ABOVE 3416 WILL OPEN THE FOLLOWING BULLISH TARGET
3429
EMA5 CROSS AND LOCK ABOVE 3429 WILL OPEN THE FOLLOWING BULLISH TARGET
3439
BEARISH TARGETS
3348
EMA5 CROSS AND LOCK BELOW 3348 WILL OPEN THE FOLLOWING BEARISH TARGET
3328
EMA5 CROSS AND LOCK BELOW 3328 WILL OPEN THE FOLLOWING BEARISH TARGET
3313
EMA5 CROSS AND LOCK BELOW 3313 WILL OPEN THE SWING RANGE
3296
3281
As always, we will keep you all updated with regular updates throughout the week and how we manage the active ideas and setups. Thank you all for your likes, comments and follows, we really appreciate it!
Mr Gold
GoldViewFX
GOLD trade ideas

GOLD → Consolidation after the rally...FX:XAUUSD is not falling back after a strong rally, but is consolidating against resistance at 3362.8. Continued high demand could allow the market to strengthen...
The price of gold halted its two-day rally, trading around $3362.8 on Monday morning after weak US employment data. This heightened concerns about the US economy and increased the likelihood of a Fed rate cut in September to 80%.
Additional pressure on the dollar came from the dismissal of BLS chief Erika McAntfer, which raised suspicions of statistics manipulation. Market attention is also focused on US-Canada trade talks, which could affect investor sentiment. Gold is consolidating for now, but its further growth will depend on the dynamics of the dollar and macroeconomic data.
Resistance levels: 3362.8, 3383, 3433
Support levels: 3345, 3334
As the market has now entered a consolidation phase, MM may form a retest of support before a possible rise in order to accumulate liquidity. However, a breakout of resistance at 3362.8 could trigger further growth.
Best regards, Linda!

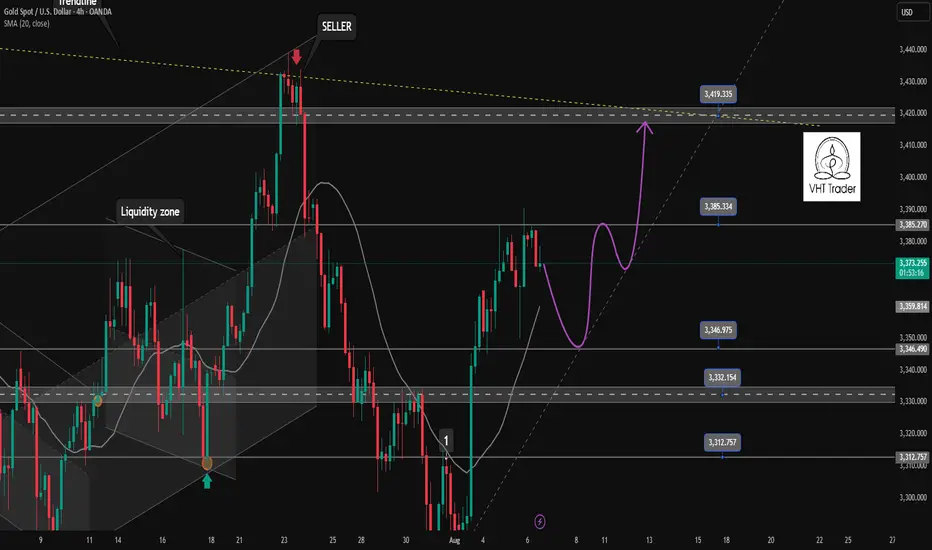
Mechanical vs. Anticipation Trades: The Fine LineWhen traders talk about discipline, they often refer to following rules — sticking to a plan, being methodical, and avoiding emotional decisions. But there's a subtle and powerful difference between being rule-based and being blindly mechanical. And even more, there's a moment in every trader’s process where discipline demands adaptation.
Let’s look at a recent trade on Gold to understand this better.
On Thursday, I published an analysis on Gold stating that the recent breakdown of support had turned that zone into resistance. A short entry from that level made sense.
It was mechanical, clean, and aligned with what the chart was showing at the time.
And, at first, it worked. Price rose into the resistance area and dropped. Perfect reaction. Textbook setup. Confirmation. The kind of trade you want to see when following a rule-based system.
But then something changed.
Price came back. Quickly.(I'm talking about initial 3315-3293 drop and the quick recover)
So, the very next rally pushed straight back into the same resistance area, hmmm...too simple, is the market giving us a second chance to sell?
That was the first sign that the market might not respect the previous structure anymore.
It dipped again after, but the second drop was different: slower, weaker, choppier.
That told me one thing: the selling pressure was fading.
So I shifted. From mechanical execution to anticipatory mindset.
This is where many traders struggle — not because they don’t have a system, but because they don’t know when to let go of it. Or worse: they abandon it too quickly without cause.
In this case, the evidence was building. The failed follow-through. The loss of momentum. The compression in structure. All signs that a reversal was brewing.
Rather than continuing to blindly short, referring to a zone that no longer held the same weight, I started looking for the opposite: an upside breakout and momentum acceleration.
That transition wasn’t based on emotion. It was based on market behavior.
________________________________________
Mechanical vs. Anticipation: What’s the Real Difference?
A mechanical trade is rule-based:
• If X happens, and Y confirms, then enter.
• No need for interpretation, no second guessing.
• It can (in theory) be automated.
An anticipatory trade is different:
• It’s about reading intent in price action before confirmation.
• Higher risk usually, but higher reward if you’re right.
• Can’t be automated. It requires presence, experience, and context.
And the tricky part? Often, we lie to ourselves. We say we’re "mechanical" while actually guessing. Or we think we’re being smart and intuitive, when in fact, we’re being impulsive.
The key is awareness.
In my Gold ideas, the initial short was mechanical. But the invalidation came quickly — and I was alert enough to switch gears. That shift is not a betrayal of discipline. It’s an upgrade of it.
________________________________________
Final Thoughts:
Discipline is not doing the same thing no matter what. Discipline is doing what the market requires you to do, without emotional distortion.
And that, often, means walking the fine line between the setup you planned for, and the reality that just showed up.
Disclosure: I am part of TradeNation's Influencer program and receive a monthly fee for using their TradingView charts in my analyses and educational articles.

GOLD → A stalemate situation - a bullish wedgeFX:XAUUSD is unable to break through the resistance level of 3400. However, an ambiguous “bullish wedge” pattern is forming on the chart...
The price of gold retreated from a two-week high on profit-taking. The correction intensified after the US imposed tariffs on imports of gold bars (1 kg), which could disrupt supplies from Switzerland and London.
Key supporting factors: Escalation of trade conflicts, concerns about the US economy and pressure on the Fed, questions about the Fed's independence after Trump's appointments
Risks: Short-term volatility ahead of US CPI data next week. However, fundamental drivers remain bullish.
Support levels: 3390, 3350
Resistance levels: 3405, 3435
The problem with the bullish wedge pattern is that it forms an ambiguous figure. We have an upward movement, but the pattern could easily reverse the local upward trend due to the fairly difficult resistance zone of 3390-3410.
If gold manages to consolidate above 3405, this will increase the chances of growth to 3435-3500.
BUT! There is a fairly high chance that the 3390 support level could be broken. In this case, the market could fall to 3350 before rising...
Best regards, R. Linda!

GOLD ROUTE MAP UPDATEHey Everyone,
Another PIPTASTIC day on the charts!!!
After completing our Bullish target 3370 yesterday, we stated that we are now waiting for ema5 lock to confirm gap to 3392.
We got the ema5 lock above 3370 opening 3392. A nice drop into the lower zone just above our bearish gap allowed us to buy dips inline with our plans. We got the push up all the way into 3390 just short of 3392 gap, so this remains open.
We will keep the above in mind when taking buys from dips. Our updated levels and weighted levels will allow us to track the movement down and then catch bounces up.
We will continue to buy dips using our support levels taking 20 to 40 pips. As stated before each of our level structures give 20 to 40 pip bounces, which is enough for a nice entry and exit. If you back test the levels we shared every week for the past 24 months, you can see how effectively they were used to trade with or against short/mid term swings and trends.
The swing range give bigger bounces then our weighted levels that's the difference between weighted levels and swing ranges.
BULLISH TARGET
3370 - DONE
EMA5 CROSS AND LOCK ABOVE 3370 WILL OPEN THE FOLLOWING BULLISH TARGETS
3392
EMA5 CROSS AND LOCK ABOVE 3392 WILL OPEN THE FOLLOWING BULLISH TARGET
3416
EMA5 CROSS AND LOCK ABOVE 3416 WILL OPEN THE FOLLOWING BULLISH TARGET
3429
EMA5 CROSS AND LOCK ABOVE 3429 WILL OPEN THE FOLLOWING BULLISH TARGET
3439
BEARISH TARGETS
3348
EMA5 CROSS AND LOCK BELOW 3348 WILL OPEN THE FOLLOWING BEARISH TARGET
3328
EMA5 CROSS AND LOCK BELOW 3328 WILL OPEN THE FOLLOWING BEARISH TARGET
3313
EMA5 CROSS AND LOCK BELOW 3313 WILL OPEN THE SWING RANGE
3296
3281
As always, we will keep you all updated with regular updates throughout the week and how we manage the active ideas and setups. Thank you all for your likes, comments and follows, we really appreciate it!
Mr Gold
GoldViewFX

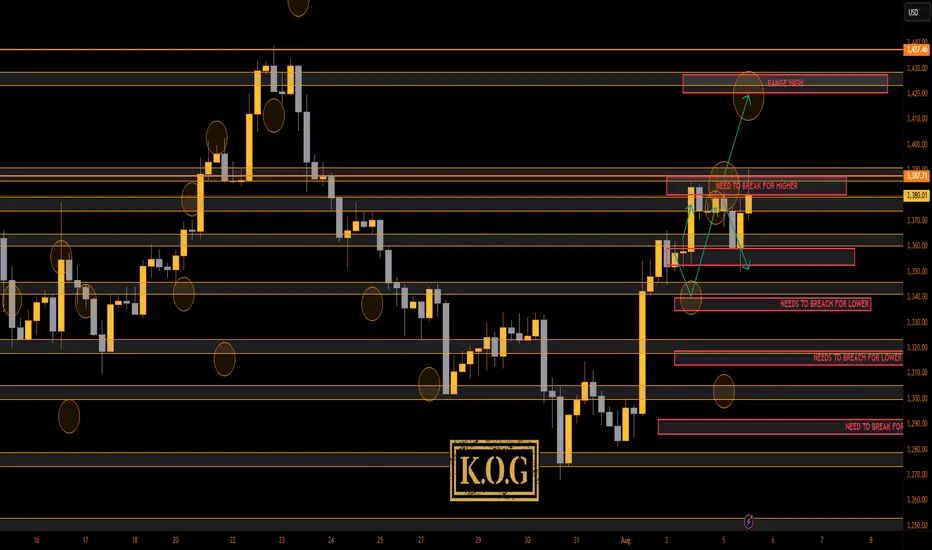
THE KOG REPORT - UpdateEnd of day update from us here at KOG:
As anticipated in the morning review, low volume day which resulted in this range still in play and price just making the sideways up and down move.
That's where we stand at the moment with no break above the red box for higher pricing at the moment. We managed to bag 3 decent set ups of 50pips each but we didn't get the move we wanted.
We have highlighted the key areas now and if you look closely on the hourly, we're in slight triangle formation. The range has also been drawn on the chart so we'll wait for the break out now.
Support here 3365, while resistance stands at the 3385 level.
Not much more to report on gold unless we break above that red box.
As always, trade safe.
KOG

Some Traders Only See The Bait, But Not The HookLet’s get one thing straight: if you seriously think you’ve discovered a “secret” setup that you saw in a YouTube video with 1 million views, and it’s right there on the chart – clean, centered, elegant – congrats. You’re already on the hook.
Welcome. You’re liquidity.
🧼 “Clean breakout” = dig your own grave, enthusiastically
It’s honestly beautiful how thousands of traders see the same “clean breakout,” the same “double bottom,” the same “bullish engulfing,” and all believe they’re geniuses. They enter confidently, with a “perfect oversold” RSI, a “confirmed” MACD, and maybe even the moon in Capricorn.
Then, of course, the market spits their orders back in their face at 300 km/h.
Standard response? “It was manipulation.”
No, bro. It was bait. You were the fish. You bit. The market says thank you for your participation and moves on.
🧠 If you see what everyone else sees, it’s useless
What most don’t get is this: if a setup looks “too clean,” it will most probably not work. If you see it, everyone sees it. If everyone thinks something is “about to explode,” that means it’s being used – to attract orders. Your money. Your emotions. Exactly what bigger players need to exit, gracefully – on your dime.
The market is like an exclusive party: if you found out about it, it’s already lame.
💅 That warm feeling of “certainty”? Yeah, you’re screwed
The irony? The moments when a trader feels most certain are exactly the moments when they’re most exposed. The market wants you to feel relaxed. Wants you to think “this is the one.” It’s like a drug dealer giving you your first hit for free, with a smile. Not because he likes you, but because he knows you’re hooked.
So when you feel “sure” – check your mouth. You might already be on the hook.
🤡 “But it was an A+ setup!”
Of course it was. The A+ setup – seen, tested, recycled, and re-sold thousands of times. The one that works great in textbooks, backtests, webinars, and in the wet dreams of those who think they just need “a perfect strategy”.
But the market isn’t here to validate your setup. It’s here to take your money. From whom? From those who still think it’s a “fair game.”
Spoiler: it’s not.
🤔 If you’re gonna bite, at least ask: who’s holding the line?
Look at any “clear opportunity” and ask the magic question:
“Who benefits from what I’m seeing right now?”
If the answer is “me ” – you’re in trouble.
If you don’t know – you’re in even more trouble.
The market is full of traps dressed up as opportunities. Hooks that move slowly, with sexy candles, to lure in the kind of trader who only learned the “buy low, sell high” part – but skipped the chapter on “ don’t bite every shiny thing you see. ”
🎬 Bottom line:
The market doesn’t try to fool you. You’re already doing that yourself.
The market doesn’t need complex tricks. All it needs is people in a hurry, easy to excite, who never ask the right questions. Who see a green candle and think, “This is it.”
Who don’t bother looking for the hook because they’re too busy dreaming about the profits.
If you want to trade seriously, it’s simple:
Don’t ask “Where do I enter?”
Ask: “Where do they want me to enter?”
And if you’re already there… run.
🧭 Alright, now seriously
( I mean, I tried to be funny above – but let’s get real for a second )
Let’s look at a few concrete recent examples from the market:
📉 EUR/USD
On Monday, I mentioned that price was testing resistance and could offer a nice selling opportunity.
But… I changed my mind. (You know... dynamic probabilities )
The pattern was way too clean, too clear, too pretty.
And of course, price broke above.
Because if it looks too obvious – it’s probably already bait.
🟡 XAU/USD (Gold)
Since yesterday, I’ve been talking about the potential for an upside breakout.
Why?
Because 3380–3385 resistance zone is way too clean.
Everyone sees it. Everyone talks about it. Everyone sells there.
Which makes me ask: if everyone’s expecting a drop… isn’t that, once again, just bait?
Here is my Gold analysis from today:
BTC/USD
We all see the confluence of support. The perfect alignment. The setup that screams “Buy me.”
But what if it’s too perfect to be true?
What if it’s just another classic trap – the kind that gets everyone excited before the drop comes.
💡 Now don’t get me wrong – this isn’t about abandoning technical analysis.
Far from it. For me, it’s essential.
But we’ve got to use it differently.
✅ Not as a treasure map
❌ But as a battlefield map showing us where the traps are laid
So maybe… don’t bite like a lizard the second something shiny pops up on your chart.
Instead, ask yourself:
“Does this make sense… or does it make too much sense? ”
Because in trading, when something looks too clean – that’s exactly when it gets dirty.
Disclosure: I am part of TradeNation's Influencer program and receive a monthly fee for using their TradingView charts in my analyses and educational articles.
GOLD 4H CHART ROUTE MAP UPDATE & TRADING PLAN FOR THE WEEKHey Everyone,
Please see our updated 4h chart levels and targets for the coming week.
We are seeing price play between two weighted levels with a gap above at 3371 and a gap below at 3293. We will need to see ema5 cross and lock on either weighted level to determine the next range.
We will see levels tested side by side until one of the weighted levels break and lock to confirm direction for the next range.
We will keep the above in mind when taking buys from dips. Our updated levels and weighted levels will allow us to track the movement down and then catch bounces up.
We will continue to buy dips using our support levels taking 20 to 40 pips. As stated before each of our level structures give 20 to 40 pip bounces, which is enough for a nice entry and exit. If you back test the levels we shared every week for the past 24 months, you can see how effectively they were used to trade with or against short/mid term swings and trends.
The swing range give bigger bounces then our weighted levels that's the difference between weighted levels and swing ranges.
BULLISH TARGET
3371
EMA5 CROSS AND LOCK ABOVE 3371 WILL OPEN THE FOLLOWING BULLISH TARGETS
3424
EMA5 CROSS AND LOCK ABOVE 3424 WILL OPEN THE FOLLOWING BULLISH TARGET
3499
EMA5 CROSS AND LOCK ABOVE 3499 WILL OPEN THE FOLLOWING BULLISH TARGET
3561
BEARISH TARGETS
3293
EMA5 CROSS AND LOCK BELOW 3293 WILL OPEN THE SWING RANGE
3236
3171
EMA5 CROSS AND LOCK BELOW 3171 WILL OPEN THE SECONDARY SWING RANGE
3089
3001
As always, we will keep you all updated with regular updates throughout the week and how we manage the active ideas and setups. Thank you all for your likes, comments and follows, we really appreciate it!
Mr Gold
GoldViewFX

GOLD ROUTE MAP UPDATEHey Everyone,
Great start to the week with our chart idea playing out, as analysed.
We got our Bullish target 3370 hit and now waiting for ema5 lock to confirm gap to 3392. Failure to lock will see lower Goldturns tested for suport and bounce, inline with our plans to buy dips.
We will keep the above in mind when taking buys from dips. Our updated levels and weighted levels will allow us to track the movement down and then catch bounces up.
We will continue to buy dips using our support levels taking 20 to 40 pips. As stated before each of our level structures give 20 to 40 pip bounces, which is enough for a nice entry and exit. If you back test the levels we shared every week for the past 24 months, you can see how effectively they were used to trade with or against short/mid term swings and trends.
The swing range give bigger bounces then our weighted levels that's the difference between weighted levels and swing ranges.
BULLISH TARGET
3370 - DONE
EMA5 CROSS AND LOCK ABOVE 3370 WILL OPEN THE FOLLOWING BULLISH TARGETS
3392
EMA5 CROSS AND LOCK ABOVE 3392 WILL OPEN THE FOLLOWING BULLISH TARGET
3416
EMA5 CROSS AND LOCK ABOVE 3416 WILL OPEN THE FOLLOWING BULLISH TARGET
3429
EMA5 CROSS AND LOCK ABOVE 3429 WILL OPEN THE FOLLOWING BULLISH TARGET
3439
BEARISH TARGETS
3348
EMA5 CROSS AND LOCK BELOW 3348 WILL OPEN THE FOLLOWING BEARISH TARGET
3328
EMA5 CROSS AND LOCK BELOW 3328 WILL OPEN THE FOLLOWING BEARISH TARGET
3313
EMA5 CROSS AND LOCK BELOW 3313 WILL OPEN THE SWING RANGE
3296
3281
As always, we will keep you all updated with regular updates throughout the week and how we manage the active ideas and setups. Thank you all for your likes, comments and follows, we really appreciate it!
Mr Gold
GoldViewFX

THE KOG REPORT - NFP UPDATE 1H 1H:
This is the chart we used last week for the FOMC and NFP KOG Reports. From the chart we can see the low was captured for FOMC and NFP didn’t give us an undercut low. We’ve kept the potential target box from the Report and for now we’ll stick with it. Red box defence is active below at the 3340-5 level and the ideal target stands above in the oval as long as we remain above the 3340 bias level.
KOG’s bias for the week:
Bullish above 3340 with targets above 3370, 3373, 3379 and above that 3384
Bearish on break of 3340 with targets below 3330, 3320 and below that 3310
RED BOXES:
Break above 3365 for 3372, 3375, 3379, 3384 and 3390 in extension of the move
Break below 3350 for 3346, 3340, 3335 and 3330 in extension of the move
Please do support us by hitting the like button, leaving a comment, and giving us a follow. We’ve been doing this for a long time now providing traders with in-depth free analysis on Gold, so your likes and comments are very much appreciated.
As always, trade safe.
KOG

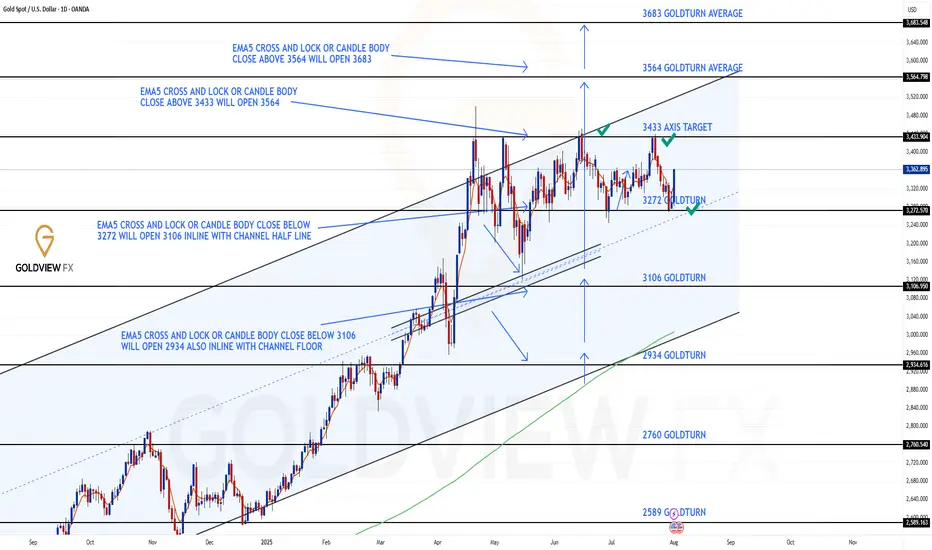
GOLD DAILY CHART ROUTE MAPHey Everyone,
Daily Chart Update – Another Clean Rejection: Structure Still Dominates
Following up on the recent price action last week after hitting the 3433 resistance level, we got exactly what the chart warned us about.
There was no confirmed break above 3433, which led to a clean rejection right back into 3272. Interestingly, the move aligned perfectly with the channel half-line, giving us another bounce right off that zone.
We remain in the same structured range, with price still rotating between 3262 and 3433, a 170+ pip zone that continues to deliver high probability trade setups.
Here’s where we are now:
🔹 Range Still Active
Price is respecting the 3272–3433 boundaries with precision. Until we get a decisive break and hold outside this range, range bound strategies remain in play.
🔹 No Breakout = Clean Rejection
The failure to sustain above 3433 confirms resistance is still valid. We're watching EMA5 for potential breakout confirmation, until then, the bias stays neutral within the range.
🔹 Channel Half-line Bounce
That rejection into 3272 also matched the channel half-line and the bounce there further cements this area as critical support.
Updated Key Levels
📉 Support – 3272
Still the major pivot. Buy zones remain valid here unless we see a confirmed breakdown.
📈 Resistance – 3433
Now clearly tested and rejected again. Any clean break and hold above could change the dynamic, but until then, it's solid resistance.
Thanks as always for your support.
Mr Gold
GoldViewFX
GOLD WEEKLY CHART MID/LONG TERM ROUTE MAPHey Everyone,
Weekly Chart Update – Another Clean Rejection + Bounce: Range Still in Play
Just a quick follow up on the ongoing weekly structure. We continue to see incredible respect for levels, with price action playing out exactly as mapped.
After the initial rejection at 3387, we got another test of support at 3281, and once again, the level held perfectly, delivering a clean rejection and bounce. Price is now rotating back upward, currently heading toward 3387, which remains the upside magnet and still open for a retest.
We remain firmly inside the 3281–3387 range, and as long as neither boundary breaks with confirmation, the structure remains our dominant guide.
Updated Structural Notes:
🔹 3281 Rejected Again
Support doing its job to the pip. This latest bounce further reinforces the strength of this level within the weekly channel.
🔹 Back Toward 3387
With 3281 holding once more, price is now tracking toward the 3387 resistance zone, which remains the key level to break for further upside continuation.
🔹 Channel Structure Unchanged
No breakdown below support, no confirmed breakout above resistance. The rising channel remains fully respected, and EMA5 still leans constructive.
Updated Levels to Watch:
📉 Support – 3281
Key weekly pivot tested and held again. Continues to offer solid dip buy opportunities unless decisively broken.
📈 Resistance – 3387
Still our major resistance. It’s been tested and rejected, but remains open for another challenge.
📈 Resistance 2 – 3482
Unfilled gap and broader weekly target. Only comes into focus if we get a proper breakout and hold above 3387.
Plan:
We stay range focused between 3281 and 3387 until proven otherwise. No breakout = no change. Watch for signs of momentum as we approach the top again a confirmed close above could shift the game toward 3482. Until then, structure is king.
Appreciate all the continued support.
Mr Gold
GoldViewFX

Correction in Tokyo, London session. And return go up in NewYork✏️Gold prices saw some selling pressure in the Tokyo session. Yesterday's US session saw strong buying pressure, leading to a psychological profit-taking session early today. The possibility of a correction in the Asian and European sessions today and the buying pressure will return in the London session. The SELL signal is triggered at the moment and the Target is aimed at the reaction of buyers at the support areas for the BUY strategy.
📉 Key Levels
SELL now 3375 (Scalping)
BUY trigger: Price rejection at the support areas 3346-3333-3315
Target 3420
Leave your comments on the idea. I am happy to read your views.
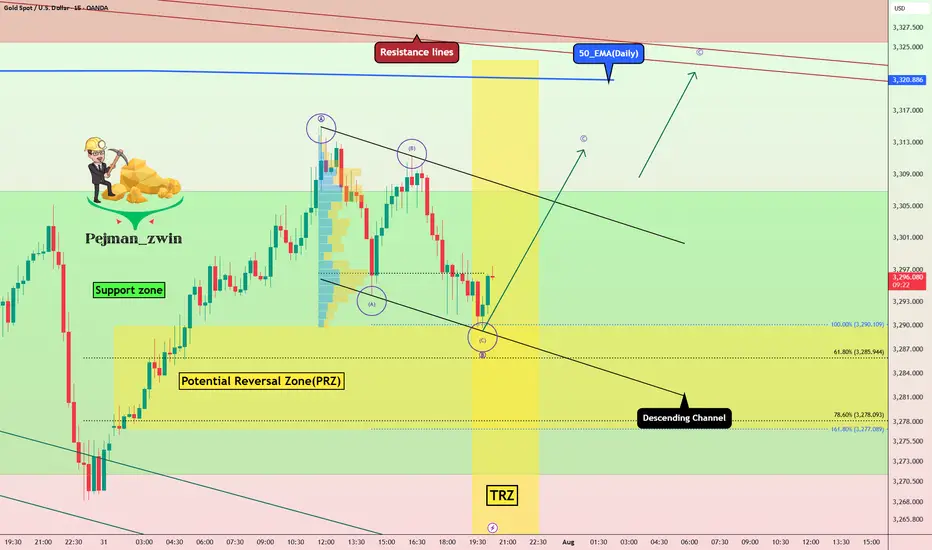
Gold in PRZ + TRZ: Is a Bullish Reversal Brewing(Short-term)?Gold , as I expected in yesterday's idea , fell to the Potential Reversal Zone(PRZ) and started to rise again .
Today's Gold analysis is on the 15-minute time frame and is considered short-term , so please pay attention .
Gold is currently trading in the Support zone($3,307-$3,275) and near the Potential Reversal Zone(PRZ) and Time Reversal Zone(TRZ) .
In terms of Elliott Wave theory , it seems that Gold can complete the microwave C of wave B at the lower line of the descending channel.
I expect Gold to trend higher in the coming hours and rise to at least $3,311 .
Note: Stop Loss (SL) = $3,267
Gold Analyze (XAUUSD), 15-minute time frame.
Be sure to follow the updated ideas.
Do not forget to put a Stop loss for your positions (For every position you want to open).
Please follow your strategy; this is just my idea, and I will gladly see your ideas in this post.
Please do not forget the ✅ ' like ' ✅ button 🙏😊 & Share it with your friends; thanks, and Trade safe.
GOLD NEXT MOVE (expecting a bearish move)(06-08-2025)Go through the analysis carefully and do trade accordingly.
Anup 'BIAS for the day (06-08-2025)
Current price- 3370
"if Price stays below 3380, then next target is 3360, 3345 and 3330 and above that 3400 and 3440 ".
-POSSIBILITY-1
Wait (as geopolitical situation are worsening )
-POSSIBILITY-2
Wait (as geopolitical situation are worsening)
Best of luck
Never risk more than 1% of principal to follow any position.
Support us by liking and sharing the post.

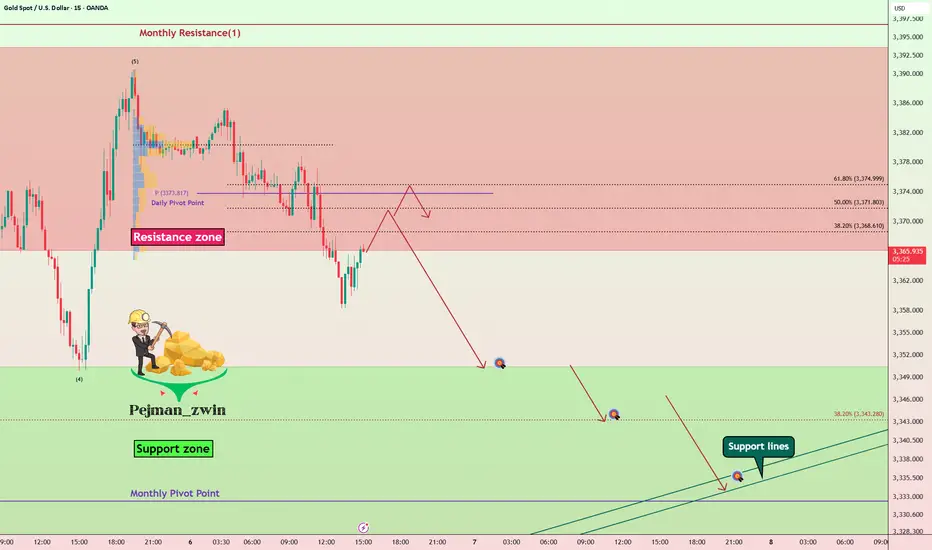
Gold Roadmap — Short termGold ( OANDA:XAUUSD ) rose to $3,383 as I expected in yesterday's idea .
Gold is currently moving in the Resistance zone($3,393-$3,366) .
In terms of Elliott Wave theory , it seems that Gold has completed 5 impulse waves , and we should wait for corrective waves on the 15-minute time frame .
I expect Gold to start declining from one of the Fibonacci levels and fall to at least $3,351 .
Second Target: $3,344
Third Target: Monthly Pivot Point/Support lines
Note: Stop Loss (SL) = $3,392
Gold Analyze (XAUUSD), 15-minute time frame.
Be sure to follow the updated ideas.
Do not forget to put a Stop loss for your positions (For every position you want to open).
Please follow your strategy; this is just my idea, and I will gladly see your ideas in this post.
Please do not forget the ✅ ' like ' ✅ button 🙏😊 & Share it with your friends; thanks, and Trade safe.
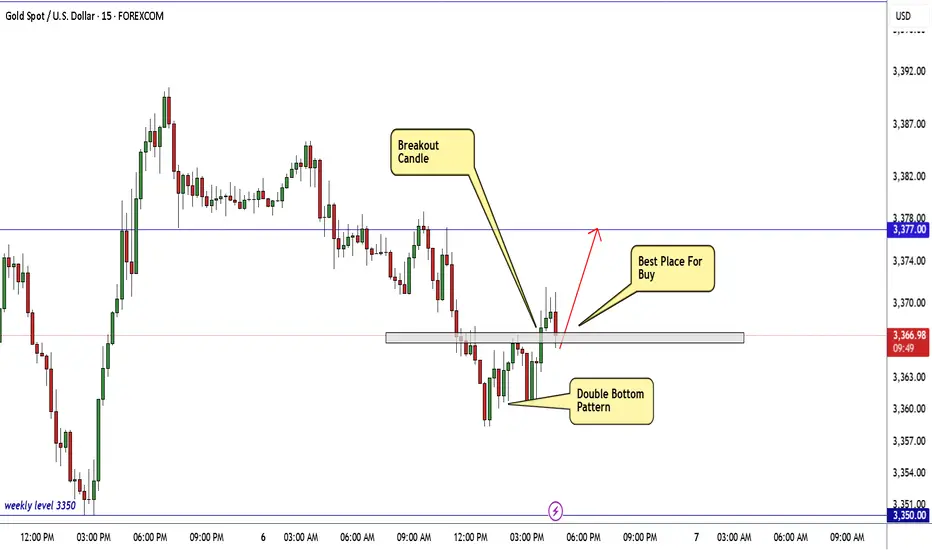
GOLD Ready To Go Up From Current Price , 150 Pips WaitingHere is My 15 Mins Gold Chart , and here is my opinion , we finally above 3365.00 and we have a 30 Mins Candle closure above it And Perfect Breakout , so we have a good confirmation now to can buy it and we can targeting 100 to 150 pips .
Reasons To Enter :
1- New Support Created .
2- Bullish Price Action .
3- Bigger T.F Giving Good Bullish P.A .
4- Clean Breakout .
5- Reversal Pattern .
Hellena | GOLD (4H): LONG to resistance area of 3448 (Wave 3).Dear colleagues, it seems that wave “2” has been formed and now we are seeing the development of wave ‘3’ of the higher order and wave “3” of the middle order.
I think we will see an update of the maximum of wave “1” at 3448.90. A slight correction to the support area of 3341.74 is possible, but there is also a possibility of a continuation of the upward movement without correction.
The target is the resistance area of 3448.
Manage your capital correctly and competently! Only enter trades based on reliable patterns!

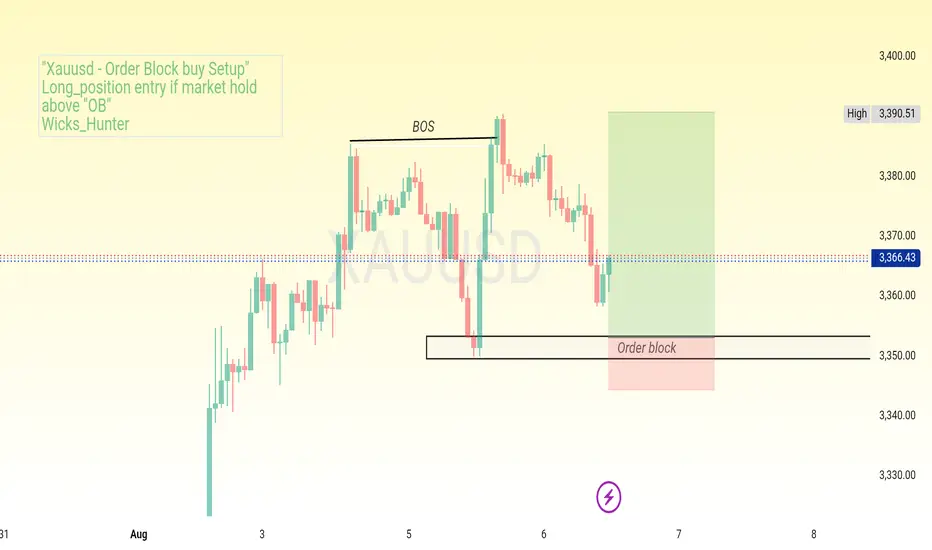
Order Block buy setup
XAUUSD H1 — Order Block Buy Setup 📈"
BOS confirmed .Price retracing to order block (3350–3353).
Looking for bullish reaction to target 3390–3400.
Risk small, aim big.
#XAUUSD #GoldAnalysis #OrderBlock #BOS #PriceAction #SmartMoney #TradingSetup #Forex #Gold #SwingTrade #TechnicalAnalysis #RiskReward #TradingPlane
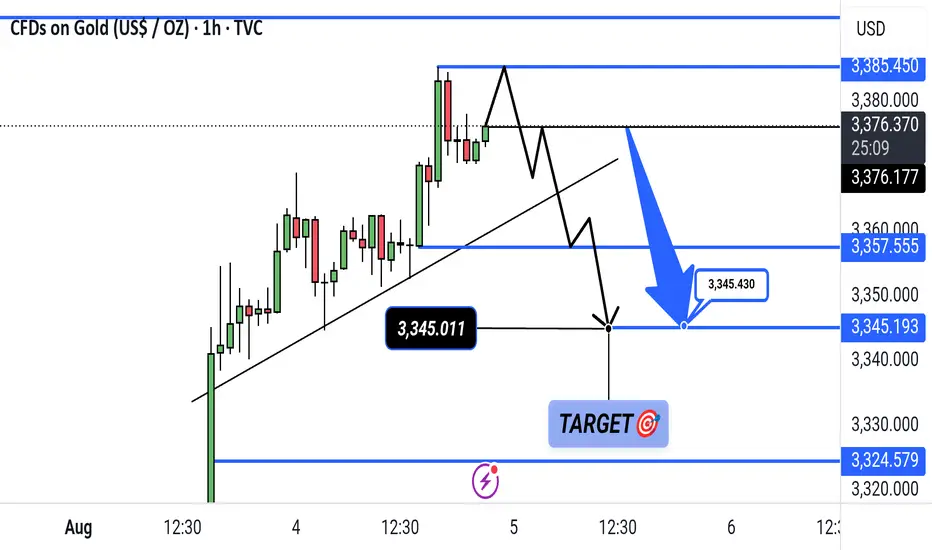
Gold Bearish Breakdown Setup – Targeting 3324 ZoneGold is showing a potential bearish setup on the 1-hour chart. A break below the key support zone at 3345 could trigger a downward move toward the target at 3324.579. Price action suggests a possible lower high formation before the drop.
DeGRAM | GOLD reached the resistance level📊 Technical Analysis
● XAUUSD rebounded from the lower channel boundary near 3,294 and reclaimed resistance at 3,357.8, confirming bullish continuation inside the rising structure.
● Breakout above the triangle’s descending resistance line opens upside toward 3,435 and possibly 3,487 on strong momentum continuation.
💡 Fundamental Analysis
● Gold found renewed support as US NFP and ISM data showed softness, weakening the dollar and lowering real yields.
● Rising geopolitical risk and increased central bank gold buying in July continue to support bullish sentiment.
✨ Summary
Long above 3,357. Target 3,435 ➜ 3,487. Setup holds while price stays above 3,294 channel base.
-------------------
Share your opinion in the comments and support the idea with a like. Thanks for your support!

THE KOG REPORT - UpdateEnd of day update from us here at KOG:
What a mission with gold, swings one way, swing the other, taking liquidity within the range and yet sticking with the illustration posted. We managed to get the move upside, pin point short into the level we wanted and then a bounce from the 3350 level again! We had a target lower, but suggested we wait for the 3370-5 level which we weren't happy with and ultimately broke, only then to give us the long into the LiTE and Excalibur targets and to complete most of the red box targets.
We now have support here at the 3375 level with extension in 3368 which are the levels that need to hold us up, then break the red box and we can attempt the higher levels.
KOG’s bias for the week:
Bullish above 3340 with targets above 3370✅, 3373✅, 3379✅ and above that 3384✅
Bearish on break of 3340 with targets below 3330, 3320 and below that 3310
RED BOXES:
Break above 3365 for 3372✅, 3375✅, 3379✅, 3384✅ and 3390✅ in extension of the move
Break below 3350 for 3346, 3340, 3335 and 3330 in extension of the move
As always, trade safe.
KOG
GOLD Found Resistance Near 3390 - What's Next?GOLD Found Resistance Near 3390 - What's Next?
A few days ago, I shared a bullish outlook on gold, noting that a bearish pullback could occur even during its upward move.
The price nearly hit the second target, climbing as high as 3390.
Now, gold seems to be facing a strong resistance zone. While it’s not yet clear whether it will drop from here, a pause is also possible before it moves down more.
The real risk isn’t technical or fundamental; it’s the fact that gold is one of the most manipulated assets in the market.
Experienced traders know it often rises unexpectedly, even without any news.
That’s the challenge with gold: it can surge when you least expect it.
Targets: 3350, 3330, and 3294
You may find more details in the chart!
Thank you and Good Luck!
PS: Please support with a like or comment if you find this analysis useful for your trading day
