XAUUSD 4H Has Finished Triangle Pattern #elliotwaveXAUUSD has finished its ABCDE correction in triangle pattern. Price will soon to test the previous $3,500 all time high area. It will required some big news as fundamental to boost the gold price up.
At the time this idea published, price still making lower low and lower high which is the downtrend pattern, but I believe it will soon break the structure and see higher high and higher low as the uptrend confirmation.
GOLD trade ideas

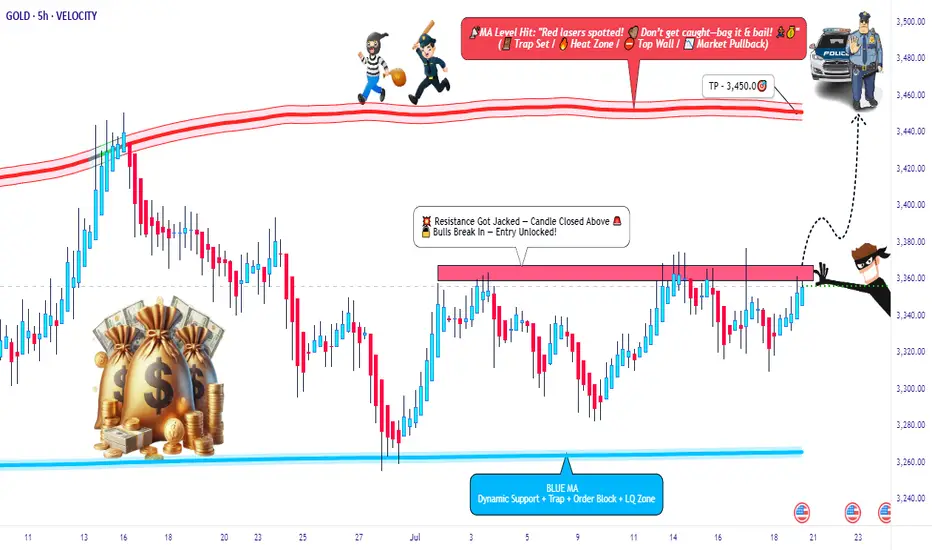
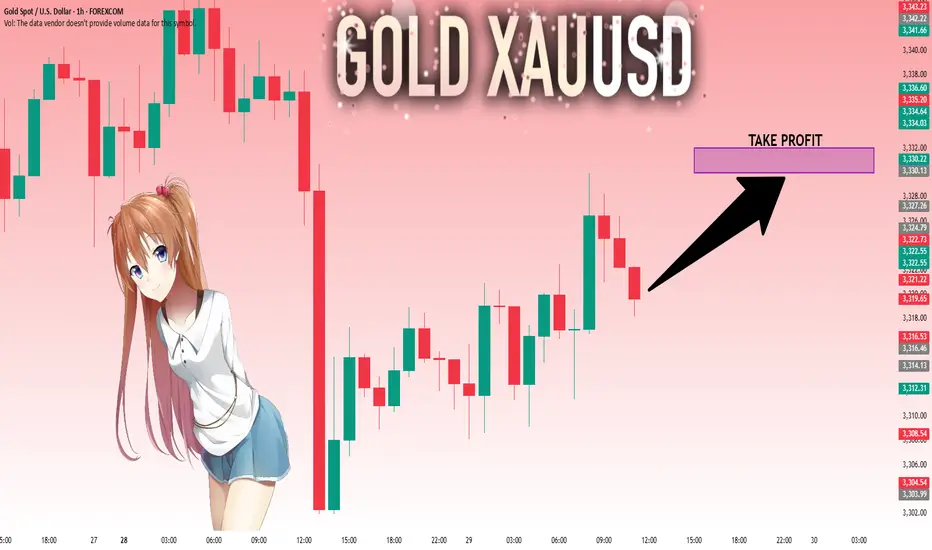
XAU/USD Breakout Playbook – Rob the Market!🚨💰 GOLD HEIST IN MOTION! | XAU/USD Thief Trading Strategy (Breakout Edition) 🏴☠️
🧠 Strategic Mindset | Not Your Average Chart Talk
Yo Market Bandits & Pip Hunters – welcome to the underground playbook!
This isn't your grandma’s chart breakdown – it’s a Thief Trading Takedown on XAU/USD (Gold), where we’re not chasing the market… we’re outsmarting it.
THE MASTER PLAN: Enter Like a Ghost, Exit Like a King 👑
📍 ENTRY POINT – The Break-In Begins!
💥 Breakout Level: Watch for 3370.00 resistance to crack – this is our green light.
🕵️♂️ Entry Style:
• Buy Stop above MA resistance zone (fast & clean)
• OR Buy Limit near swing low zones after confirmation pullback (sniper entry)
🧠 Thief Tip: Wait for the breakout to happen. No orders, no SL before it. Patience is profit.
🔄 Layer the Entry:
• Deploy DCA (Dollar Cost Averaging) or scaling entries with precision
• Build positions like stacking cash bags — smart, silent, and calculated
🛡️ PROTECT THE LOOT – Stop Loss Logic 💣
📍 SL Guide: 3310.00 (4H swing low – update as price structure evolves)
🔥 SL ONLY comes after breakout. Set it too early? That’s how you get caught.
⛔ No pre-breakout orders. No early SL. Stay invisible till it's go time.
🎯 THE ESCAPE – Profit Like a Phantom 🚀
💸 Take Profit: 3450.00
📉 Scalpers: Trail SL as price pushes – never give back stolen pips
🌀 Swing Traders: Monitor resistance layers – don’t let the bulls turn on you
🧭 CONTEXT – Why This Setup?
🔍 Macro Snapshot:
• Trend: Neutral/Bullish Lean
• Influencers: COT reports, geopolitical tension, dollar flows
• Sentiment Shifting – watch the herd, but don’t run with it
🗞️ News Risk: Don’t get wrecked by events! Avoid entries during high-impact news.
🚨 Trailing SL is your best weapon during volatility.
⚡ POWER UP THE CREW – Support the Movement
💬 Drop a comment, hit the 🔥 like button, and share with your trading gang
More Thief Trading blueprints coming soon – bigger breakouts, cleaner setups
⚠️ STAY SHARP, THIEVES!
This ain't financial advice – it’s an outlaw’s edge on the market.
Trade smart. Risk well. Protect the bag.
🏴☠️ XAU/USD GOLD HEIST IN PROGRESS... Join the Movement. Let’s Rob the Market.
Weekly Analysis on GOLDFor next week trading sessions i will be more patience in waiting for my set up to appear before taking trades.
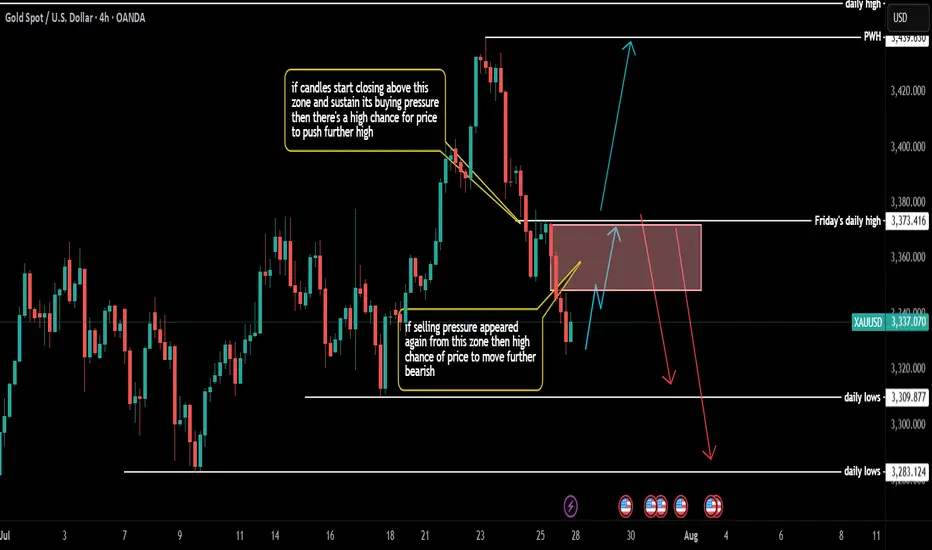
XAUUSD Weekly Outlook – August 4–8, 2025
The question isn’t whether gold is strong. The question is — will price expand, or rebalance?
🔸 Macro Overview
Gold begins the week consolidating just below its final HTF supply zone (3439), while USD weakens amid mixed macro data and growing speculation of future rate cuts. Markets await fresh catalysts, and gold’s recent impulsive rally is now facing the big test: break the wick, or pull back?
🔸 Weekly Structure & Bias
Element Observation
🔹 Trend Bullish continuation — clean structure
🔹 Last BOS March 2025 — impulsive, with imbalance below
🔹 Price Action Top wick rejection forming near 3439
🔹 Bias Still bullish, but entering exhaustion zone
🔹 RSI Above 70 — overheated
🔹 EMAs EMA5 > EMA21 > EMA50 > EMA100 — perfect trend
🔸 Key Weekly Levels (Zones + Confluences)
Zone Type Price Range Confluences
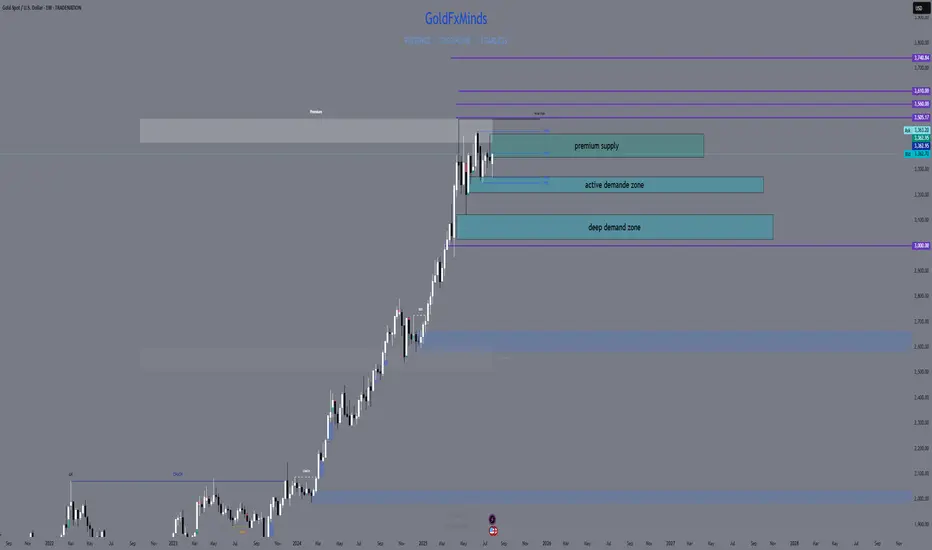
🔴 Supply 3350 – 3439 HTF wick supply + FVG + RSI 70+ + liquidity trap
🔵 Demand 3270 – 3215 Weekly OB + FVG + EMA21 support
🔵 Demand 3120 – 3070 Old BOS + deep FVG + psychological level
🟢 Support 3000 zone EMA50 + historical consolidation
🔸 Fibonacci Extensions (Above 3439)
Extension Level Price Target Confluences
1.0 (Swing Full) 3439 Supply wick high
1.272 3505 Next psychological milestone
1.414 3560 Mid-extension + liquidity
1.618 3610 Golden expansion target
2.0 3740 Full trend extension (max)
🔺 These levels serve as potential breakout targets ONLY if we get a confirmed weekly close above 3439 with clean BOS on LTF.
🔸 Weekly Scenarios
🟢 Scenario 1 – Break and Expand
If gold breaks 3439:
Expect clean continuation to 3505 → 3560 → 3610
Best entries come from new OBs on H4/D1 around 3350–3370
Follow momentum — but don’t chase without retrace confirmation
🔻 Scenario 2 – Rejection + Retracement
If price holds below:
Pullback toward 3270 – 3215 expected
EMA21 acts as dynamic support
If selloff gains strength, next demand = 3120 – 3070
🎯 This zone aligns with macro OB + re-entry for long-term bulls.
🔸 Conclusion & Gameplan
Gold is pressing against its final weekly ceiling.
Structure remains bullish, but every sniper knows — at the edge of premium, timing is everything.
✅ Above 3439 → expansion opens to 3505 → 3560 → 3610
🟦 Below 3439 → retracement into 3270 → 3215 → 3070
The best setups will be born from confirmation, not prediction. Let the market decide.
—
What would you do if 3439 rejects hard this week?
Comment your plan, tag your sniper level, and let’s stay ahead together 💬
—
With clarity, confidence, and perfect timing,
GoldFxMinds 💙
Disclosure: Analysis based on Trade Nation (TradingView) chart feed.
xauusdxauusd Focus on red line
From the price level of 3368 and above, gold is expected to pull back at least until the Stochastic on the M30–H1 timeframes reaches oversold levels.
After that, a bullish continuation is likely, pushing the price up to around 3400.
This area will be a critical decision point — determining whether the market will continue its uptrend or reverse into a downtrend.
If the H4 chart prints a reversal candlestick pattern, it would indicate the beginning of a bearish trend, which could potentially lead to a downward movement of up to 20,000 points.

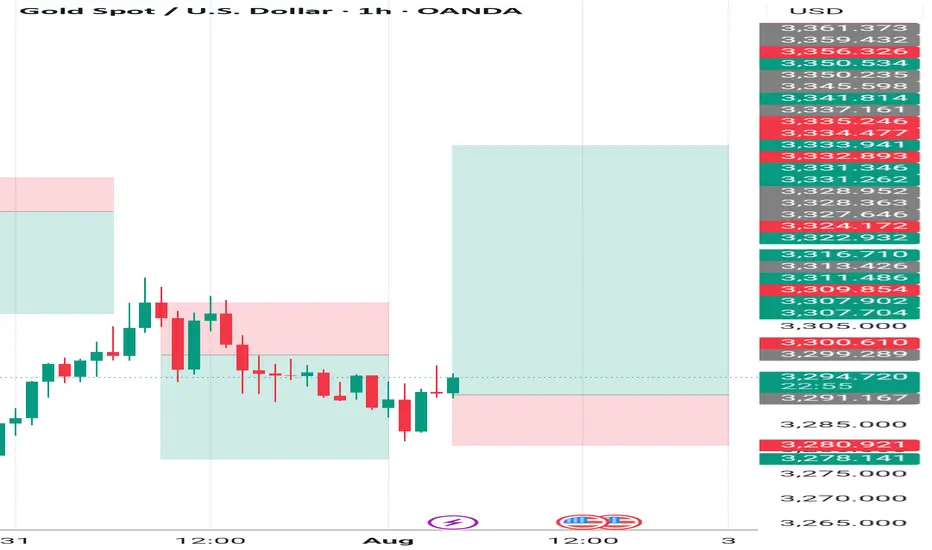
Gold Market Holds Bearish Structure Below 3291Gold market continues to hold firm within the bearish channel, with 3291 acting as a supply zone, maintaining pressure down toward 3269. As long as this zone remains unbroken, bearish momentum stays in play.
🔍 Key Insight:
3291 = active supply resistance
3269 = short-term target if sentiment holds
follow for more insights , comment and boost idea

NFP GOLD watch me break gold down give my thoughts on gold during NFP and what you should expect moving forward

How to maintain stable operations before NFP dataYesterday, gold closed the month with a long upper shadow doji candlestick, indicating strong upward pressure, with monthly resistance at 3439-3451. Today marks the beginning of the month, and with the release of numerous data indicators such as NFP, unemployment benefits, and PMI, there is considerable uncertainty, so intraday trading should proceed with caution.
Judging from the daily chart, the current MACD indicator is dead cross with large volume, and the smart indicator is running oversold, indicating a low-level fluctuation trend during the day. At present, we need to pay attention to the SMA60 moving average and the daily middle track corresponding to 3327-3337 on the upper side, and pay attention to the intraday low around 3280 on the lower side. The lows of the previous two days at 3275-3268 cannot be ignored. There is a possibility that the low-level oscillation will touch the previous low again.
From the 4H chart, technical indicators are currently flat, with no significant short-term fluctuations expected. Low-level volatility is expected to persist within the day. Then just focus on the support near 3275 below and the middle track pressure near 3307 above. Looking at the hourly chart, gold is currently oscillating below the mid-range band, with resistance at 3295-3307 to watch in the short term.
Overall, the market is expected to remain volatile before the release of today's data. Based on Wednesday's ADP data, this round of data is also expected to be around $100,000. The contrast between ADP and NFP last time deserves our caution. The current market is basically optimistic about the short-selling situation, which is exactly what I am most worried about. If the gold price can stabilize above 3,300 before the NY data, the possibility of NFP data being bullish cannot be ruled out.
Intraday European trading suggestion: if the current gold price falls back to 3285-3280 and stabilizes, you can consider short-term long positions, with the target at 3295-3305. If the gold price tests the low of 3275-3268 again and does not break through, you can consider a second chance to go long. After making a profit of $10-20, you can consider exiting the market with profits. The market is volatile and unstable, so be sure to bring SL with you and pay close attention to the impact of the NFP data. Conservative investors can enter the market after the data is released.
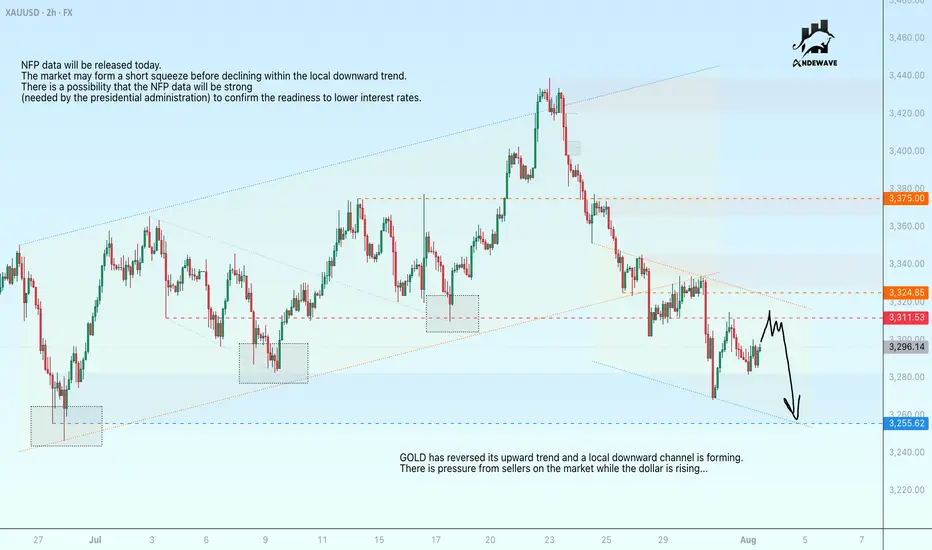
GOLD may be subject to manipulation ahead of the NFPGOLD has reversed its upward trend and a local downward channel is forming. There is pressure from sellers on the market while the dollar is rising...
NFP data will be released today. The market may form a short squeeze before declining within the local downward trend.
There is a possibility that NFP data will be strong (needed by the presidential administration) to confirm the readiness to lower interest rates.
Scenario: ahead lies a strong resistance zone at 3311.5 - 3324.85. The formation of a false breakout could intensify bearish pressure, leading to a decline in prices to 3255
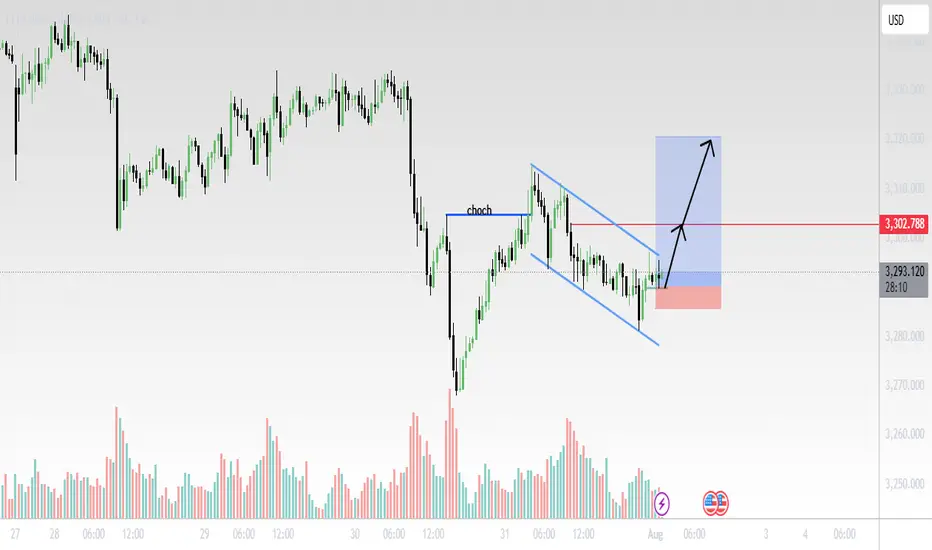
Gold (XAU/USD) 30-Min Chart Analysis – August 1, 2025Structure Summary:
CHoCH (Change of Character) confirmed after price broke the previous lower high, signaling a potential trend reversal.
Price has since formed a bullish falling wedge (blue trendlines), a classic continuation pattern after CHoCH.
Volume spikes during reversal attempts suggest accumulation.
Trade Setup:
Entry: Breakout above wedge resistance.
Stop Loss: Below recent swing low near 3280 area (red zone).
Target: Around 3315–3320 zone (blue box), aligned with previous demand-turned-supply area.
📌 Outlook:
Bullish breakout expected if momentum sustains.
Watch for confirmation candle with volume above the wedge.
Clean R:R setup with tight SL and wide TP potential.
📊 Technical Bias: Bullish
❗Risk Management: Adjust position size based on lot exposure and account size.
BULLISH REVERSALAfter struggling between the 2 key levels, XAUUSD showed a change of character indicating a reversal. Target is 500 pips.
Xauusd sell ideas Let's see how this goes on news release am expecting a retest of that zone as well entry

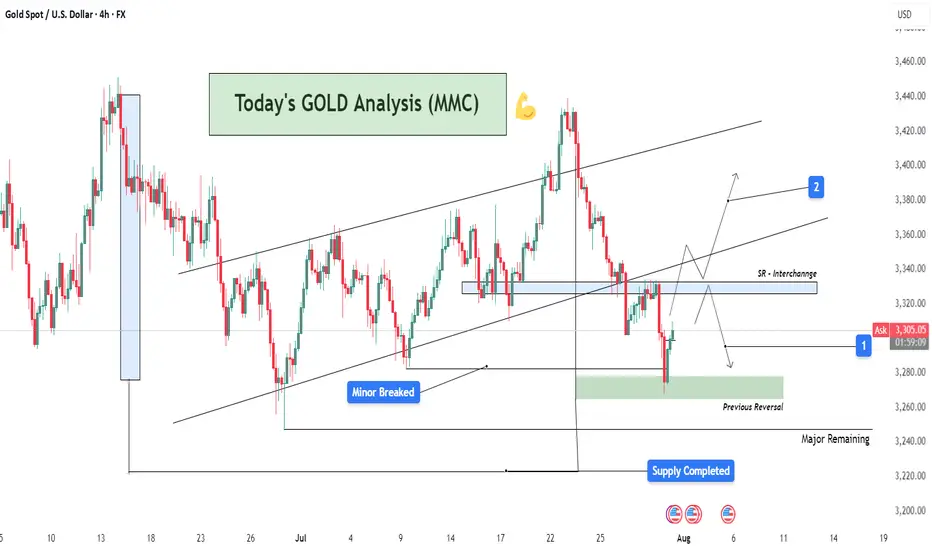
XAUUSD Analysis : Channel Break, Demand Zone + SR - Interchange"High-Probability Zone Reaction & SR Flip Confirmation"
Gold (XAUUSD) is currently reacting from a significant support zone after completing a bearish breakout from a well-established ascending channel. The market structure indicates both threat and opportunity depending on how price behaves around key levels ahead.
🔍 Structure Breakdown & Price Behavior:
🔹 1. Rising Channel Violation
Over the past few weeks, price was comfortably moving inside a well-respected ascending channel, making higher highs and higher lows.
Recently, however, price broke below the lower boundary, which is often a bearish signal—indicating a possible trend reversal or a deeper correction phase.
Such breakdowns suggest buyers are losing control, and bearish sentiment is gaining strength.
🔹 2. Supply Zone Reaction & Drop
Before the breakout, we observed a sharp rejection from a high point, triggering a sell-off.
The price completed its move into a previously defined supply zone, resulting in a strong bearish impulsive leg that pushed it outside the channel.
This move shows clear institutional distribution—where large sellers unloaded positions around that zone.
📍 Key Zone Focus:
🟩 Previous Reversal / Demand Zone (Green Box)
Price is now sitting in a historically strong demand zone, which acted as a major reversal point in the past.
This area is marked as the first zone of interest where buyers might step back in to defend.
The green box represents a liquidity pocket where institutions previously accumulated positions—hence it’s a strong bounce candidate.
🟦 SR Interchange Zone (Blue Box)
The next major level above current price is the SR Interchange zone, around 3,320–3,340.
This level was previously broken and now acts as resistance.
It's crucial because it represents the battle zone where the market will decide whether to continue bearish or shift back bullish.
🧠 Market Psychology & Order Flow Insight:
The recent aggressive selling pressure from the highs, followed by a bounce from the demand zone, shows a shift from euphoria to fear.
Sellers are active at supply, while buyers are attempting to defend the previous demand.
The market is currently in decision mode—and the SR flip zone (3,320–3,340) will be the judge.
A break and retest above this level signals strength and potential for a trend resumption.
A failure to reclaim it would confirm bearish dominance and open doors for deeper targets.
🔄 Possible Scenarios Ahead:
📈 Scenario 1 – Bullish Rejection & Breakout:
If buyers successfully hold the 3,280–3,260 demand zone and push price above the SR Interchange zone, we can expect:
📍 Target 1: 3,360 (mid-term resistance)
📍 Target 2: 3,400–3,420 (previous high & upper trendline)
This would confirm a fakeout from the channel and a bullish continuation pattern.
📉 Scenario 2 – Failure at Resistance & Drop Continuation:
If price fails to reclaim the interchange zone, expect a retest of the green demand, followed by a potential drop toward:
📍 3,260 – local support
📍 3,240 – major support (unfilled demand below)
📍 3,220–3,200 – ultimate downside target
This would solidify a bearish market structure, confirming the sellers are in control.
🧭 Key Levels To Watch:
Level Type Price Range Significance
Supply Zone ~3,400–3,420 Major institutional selling area
SR Interchange (Blue) ~3,320–3,340 Critical resistance / flip zone
Current Price ~3,297 Watching reaction for momentum shift
Demand Zone (Green) ~3,280–3,260 Key support / bounce zone
Major Demand Pending ~3,240–3,220 Next support level if drop continues
✅ Conclusion:
Gold is at a critical inflection point.
The recent bearish breakout signals weakness, but the current support zone may provide a short-term bullish setup if buyers defend it effectively. A successful reclaim of the SR flip zone will shift sentiment bullish again. Otherwise, a deeper correction is likely.
This setup is ideal for both swing and intraday traders—look for confirmation signals at the current support and SR zone before executing trades.
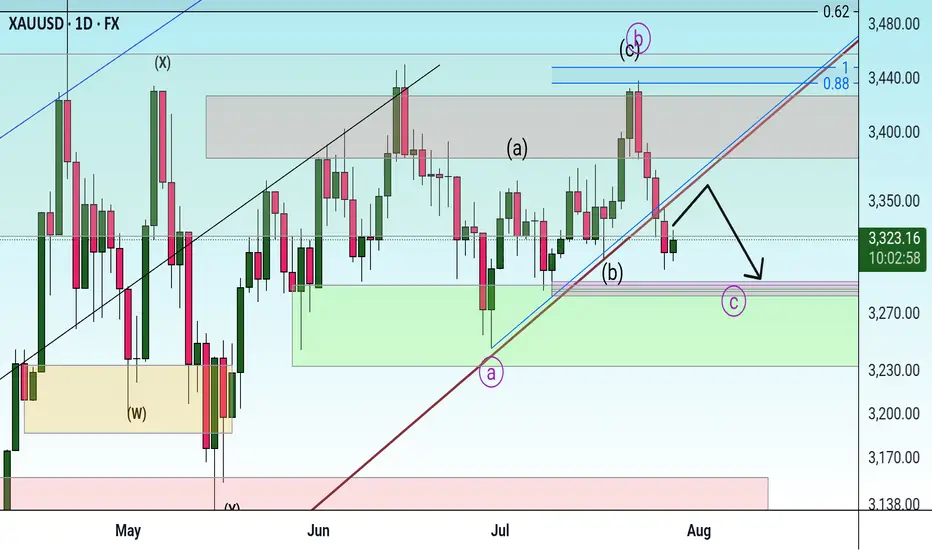
Gold is bullish Long TermLooking at the consolidation of Gold on a daily timeframe, you'd see that gold is still undecided on a reversal. I think that Gold would retest the uptrendline one last time...
What are your thoughts on this?

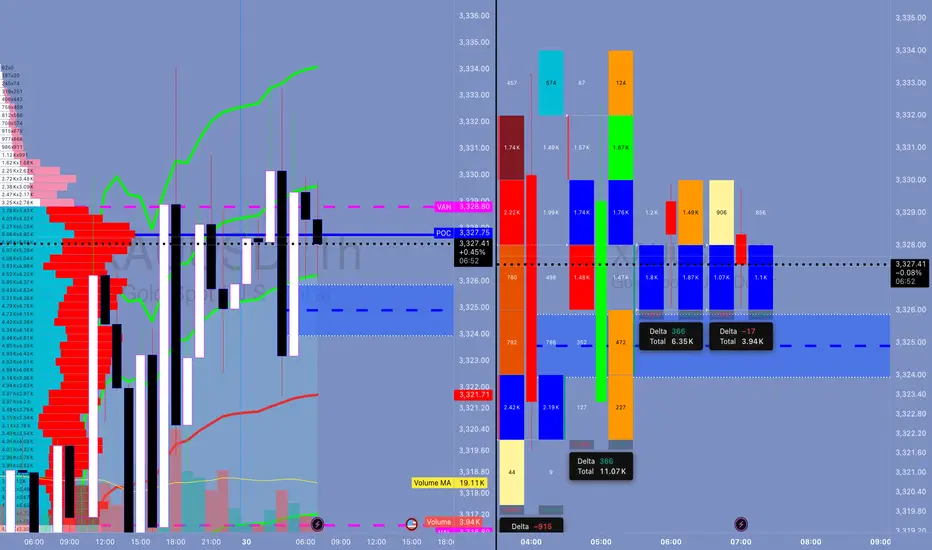
Schabacker's Gold Trap Inside the Trap: Schabacker Congestion, VWAP Warfare & The Silent Distribution on XAU/USD
1. The Congestion Area – Schabacker Style
🔍 What We Saw:
Price action rotated in a tight range: 3,324.5 - 3,329.5.
This is not random. This is Schabacker’s classic Congestion Zone:
Duration: 12+ hours
Width: ~5 points
Volume: tapering near edges
Failed breakouts on both sides = classic neutral wedge compression.
🎯 Schabacker Teaching Applied:
"Congestion areas are places of rest and preparation — they are the breeding grounds of significant breakouts or breakdowns."
From his bible “Technical Analysis and Stock Market Profits”:
Congestion after a trend → likely a continuation (but confirm via breakout volume).
Multiple failed breakouts = deceptive strength/weakness → traps.
Range becomes psychological equilibrium → breakout from this zone is explosive.
📘 Lesson:
Watch for breakout confirmation only AFTER price escapes the congestion and retests the range (confirm with volume and delta). If volume weakens and price returns inside = fakeout, fade that sh*t.
🔥 How Schabacker Explains July 29 Price Action
"This was a classic congestion scenario with symmetrical compression, rejecting value high and value low over and over — a balanced market ripe for an imbalanced expansion."
Price coiled with lower highs + higher lows inside the value zone = triangle-like congestion.
Breakout attempts both sides failed = energy stored.
Delta flipped negative toward the close + volume dried = distribution inside the congestion.
✅ Congestion was not random chop. It was the Smart Money disguising their exit before slamming price.
⚔️ ENHANCED STRATEGIC OUTLOOK FOR TODAY (JULY 30, 2025)
🎯 Bias: Short bias unless proven wrong by breakout + acceptance above 3,329.50
Schabacker’s congestion broken to the downside = high probability short trigger.
First target = edge of congestion zone @ 3,316.80 (previous VAL).
Second target (extension) = swing low anchor near 3,310.
📘 Volatility Note:
After tight range like this (Schabacker Box), volatility expansion is imminent. Don’t get caught trading inside — trade the break and retest.
💣 HYPOTHETICAL TRADE PLAN: SCHABACKER STRATEGY IN PLAY
Order Type: 🔻 Sell Stop Below Congestion Break
Entry: 3,322.00
Stop Loss: 3,330.00 (above congestion top + failed breakout zone)
Take Profit 1: 3,316.80 (edge of range, VAL)
Take Profit 2: 3,310.00 (target from congestion width projection)
Confidence: 78%
🧠 Justification:
Factor Explanation
VWAP Flatlined = balanced market
FVRP Price camped near POC = equilibrium
Footprint Absorption at highs, silent selling = distribution confirmed
Delta Early buyer strength flipped = trap
Schabacker Congestion Classic box breakout setup = timing the expansion
🧠 EDUCATIONAL SUMMARY — WHAT YOU JUST LEARNED
✅ Schabacker’s Congestion Area Tactics
Congestion after a move Leads to continuation (trend resumes after pause)
Multiple failed breakouts Traps traders = setup for fakeout fade
Volume dries inside box = Explosive breakout likely
Use congestion width To project breakout targets
You don't fade chop — you exploit it after the breakout.
Don't waste your bullets inside the box. Wait for the beast to break loose — then you unload.
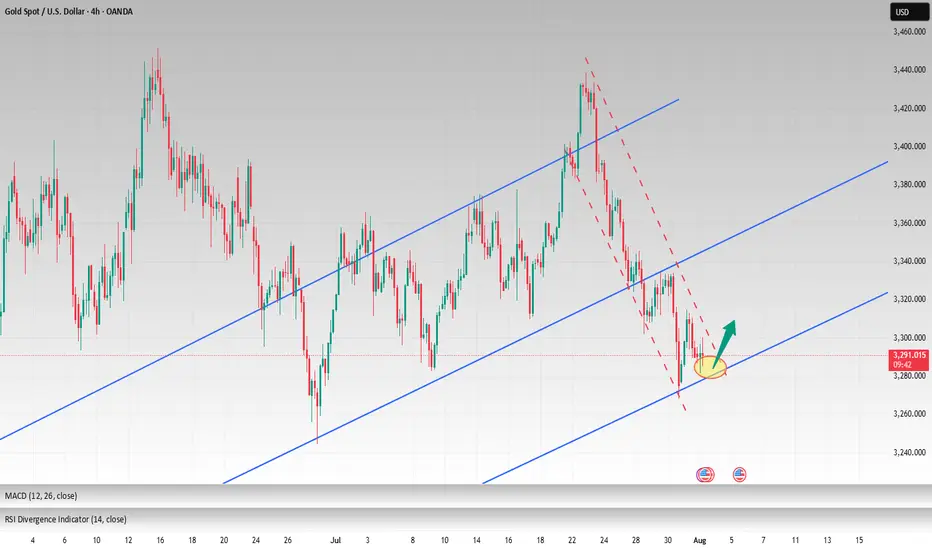
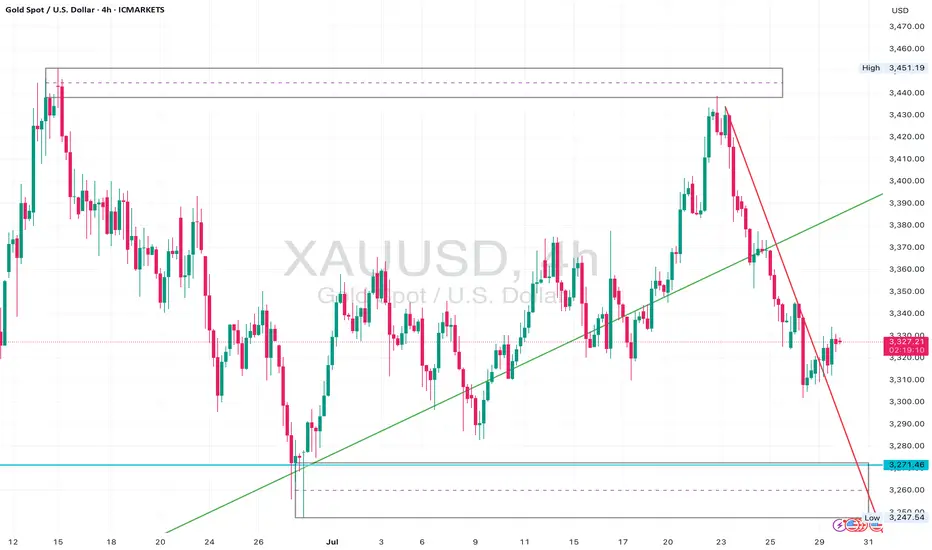
Gold Bear Flag Forming After Trendline Break – Short Setup BelowGold (XAUUSD) recently broke a major ascending trendline that had held since late June, leading to an aggressive sell-off from the $3,440s down to the $3,270 zone.
Following that, price is now consolidating just beneath the previous support trendline, forming what appears to be a bear flag or rising channel inside a corrective structure.
The $3,330–$3,340 zone is now acting as resistance, and price is struggling to close above this level.
The current structure suggests continuation to the downside, with clean space to revisit the $3,271 liquidity pool and potentially even sweep that low.
Watch for bearish confirmation below the current flag – especially if price prints a rejection wick or engulfing candle at the upper edge of the box.
⸻
Key Levels:
• Resistance: $3,330 – $3,340 (flag top + previous support turned resistance)
• Support: $3,271 zone, followed by $3,248 sweep potential
⸻
Trigger Criteria:
• Bearish rejection inside the flag (e.g. pin bar or engulfing)
• Break and retest of the flag bottom or horizontal support
⸻
Risk Note:
A clean break back above $3,350 and reclaim of the previous trendline would invalidate this idea short term and shift bias back to neutral/bullish.
GOLD: Strong Growth Ahead! Long!
My dear friends,
Today we will analyse GOLD together☺️
The market is at an inflection zone and price has now reached an area around 3,321.22 where previous reversals or breakouts have occurred.And a price reaction that we are seeing on multiple timeframes here could signal the next move up so we can enter on confirmation, and target the next key level of 3,329.97.Stop-loss is recommended beyond the inflection zone.
❤️Sending you lots of Love and Hugs❤️
Correction It is expected that the price will consolidate below the trend line and continue the downtrend to the specified support levels. In this case, a three-wave pattern will form.

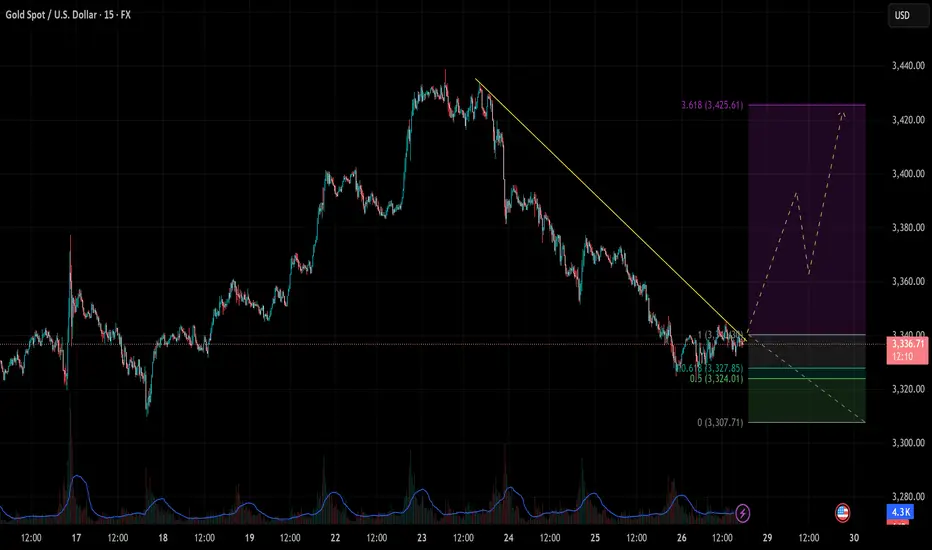
[XAUUSD] Reversal Signals from Key Support As of the July 28–29 trading sessions, the XAUUSD 15-minute chart is showing early signs of a bullish reversal, with price reacting strongly at a key Fibonacci support zone and breaking through a descending trendline.
1. Price Action and Technical Structure
After a prolonged downtrend from the 3,430 zone, gold found support at the 0.618 Fibonacci retracement (3,327.85), aligning closely with the horizontal support at 3,324 – 3,327.
A descending trendline has been breached, signaling a potential breakout setup.
A potential ZigZag corrective wave structure is forming, hinting at the beginning of a new bullish swing.
2. Fibonacci Extension & Upside Targets
The Fibonacci extension tool suggests a possible rally toward the 3.618 extension at 3,425.
This level marks the next major upside target if the breakout holds.
3. Key Price Levels
Price Zone
Technical Significance: 3,327 – 3,324 Major support zone (Fib 0.618 + horizontal support)
3,350 – 3,355 First reaction zone / interim resistance
3,380 – 3,400 Strong resistance zone
3,425 Final target – 3.618 Fib extension
4. Suggested Trading Strategy
Long Setup – Breakout & Reversal Confirmation
Entry: 3,328 – 3,332 (after bullish confirmation above trendline and support)
Stop Loss: Below 3,320 (beneath local swing low)
Take Profit: 3,355 → 3,380 → 3,425 (scaling out by zone)
Bearish Continuation Scenario
If price drops below 3,320 and breaks 3,307 support, the bullish outlook is invalidated, and a retest of deeper levels is likely.
5. Volume and Confirmation Cues
Volume has started to pick up as price tests the breakout zone – indicating that buying pressure may be returning.
Wait for a strong bullish candle with volume above average before committing to the trade.
Gold is approaching a critical inflection point, and bulls may regain control from this confluence support zone. Stay alert for a breakout confirmation. Save this idea if you find it helpful and follow for more high-probability strategies!
XAUUSD next move GOLD is currently on a very critical zone there are only two options here its either going to break below or retest the zone then shot up . if it fails to break @3328 then we gonna see a buy but if it breaks @3328 we definitely going down deep . Lets keep a close eye

Daily Analysis- XAUUSD (Monday, 28th July 2024)Bias: Bullish
USD News(Red Folder):
-None
Notes:
- Price gap down and filled up the gap
- Looking for price to tap 0.618 fib level
- Potential BUY if there's
confirmation on lower timeframe
- Pivot point: 3300
Disclaimer:
This analysis is from a personal point of view, always conduct on your own research before making any trading decisions as the analysis do not guarantee complete accuracy.

GOLD - W30📅 Gold Weekly Outlook (July 29 – Aug 2, 2025)
Current Price: ~$3,336
Last Week: Rejected near $3,400+, bearish weekly close expected.
🔍 Key Levels
Resistance: $3,365 → $3,380 → $3,400
Support: $3,330 → $3,310 → $3,275
⚠️ Why It Moved
Strong dollar & fading rate cut hopes pressured gold.
Risk sentiment improved → gold demand dropped.
📉 Outlook
Bearish bias if price stays below $3,365.
Watch for bounce near $3,310, but no reversal yet.
Break below $3,310 opens downside to $3,275.
✅ Trade Setup #1 – Sell the Pullback
Type: Short
Entry: $3,360–$3,370 (if price retests broken support)
Stop Loss: Above $3,380
Take Profit:
TP1: $3,330
TP2: $3,310
TP3: $3,275
Condition: Only take this if price fails to break $3,370 and shows bearish rejection (e.g., wick or bearish candle)
✅ Trade Setup #2 – Buy on Support Bounce
Type: Long (counter-trend, risky)
Entry: $3,310–$3,320 zone
Stop Loss: Below $3,295
Take Profit:
TP1: $3,340
TP2: $3,365
Condition: Only if bullish reversal pattern forms (e.g., hammer, bullish engulfing)
🗓️ Events to Watch
Wed: FOMC rate decision
Fri: US Non-Farm Payrolls
