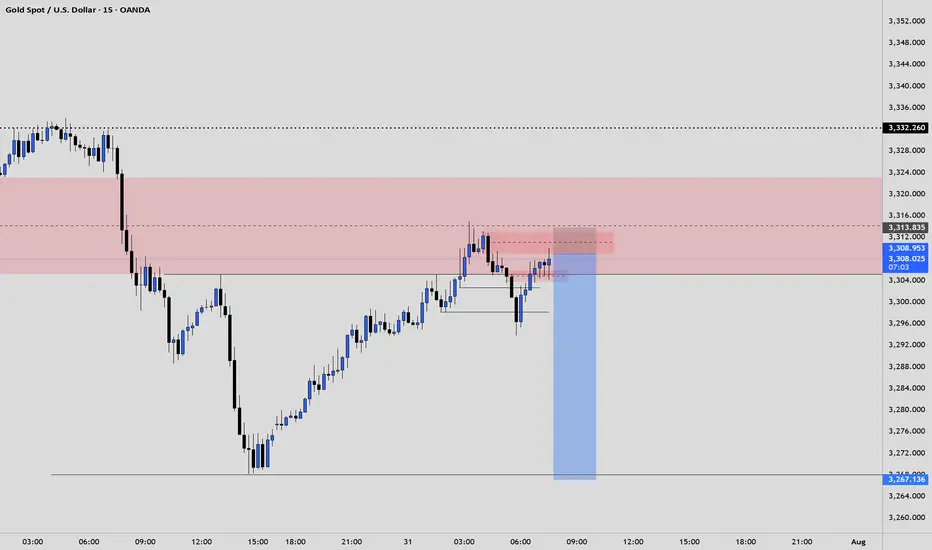
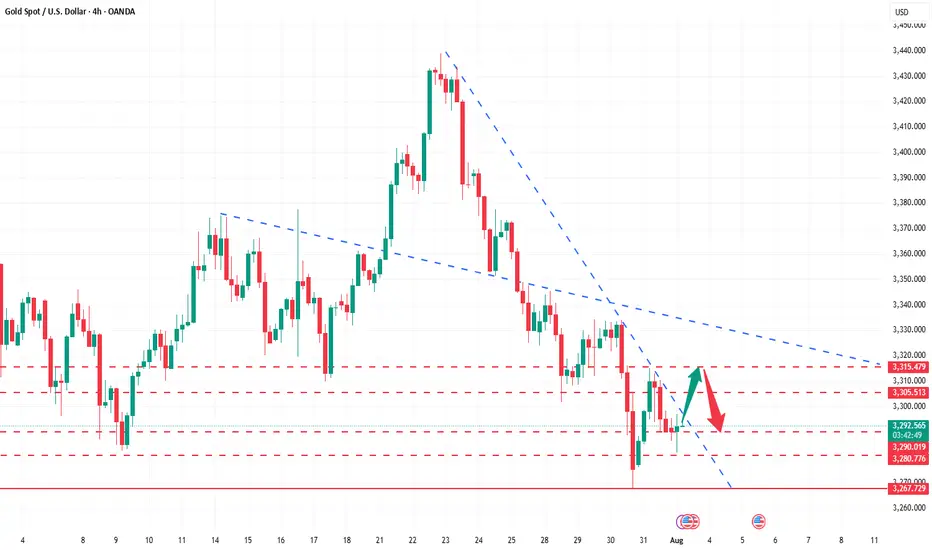
gold on buy retrace#XAUUSD price have reformed back above 3306, now we are expecting bullish from 3309 on 2 times breakout.
Entry 3309 2 times breakout, target 3326-3335, SL 3297.
Below 3297 holds bearish reversal, target 3270. 3317 will reject, H1 closure there will continue bullish.
GOLD trade ideas

XAUUSD: UptrendOn XAUUSD as you can see on the chart we would have a good uptrend. After the vwap indicator breaks, you can double your buy position.

Gold analysis by majidbabaeiasl My predictions for gold in previous years have been quite accurate and calculated. Right now, I think a wave 4 correction, which is a micro-wave, is taking place.

Xausd techinical analysis.Xausd techinical analysis next move posibale at h2 time frame not finchinal advice.

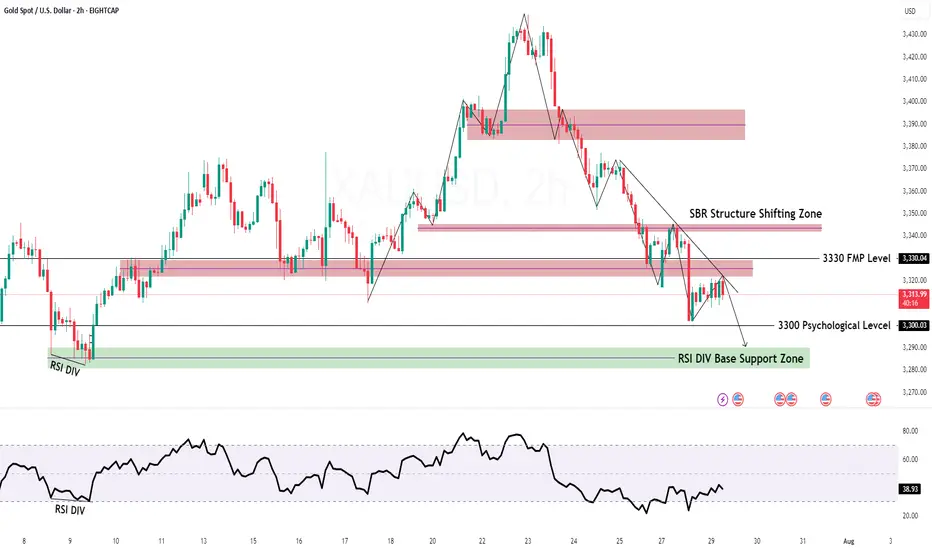
GOLD H2 Intraday Chart Update For 29 July 2025Hello Traders, Welcome to new day
we have US JOLTS high impact news today, for market sustains above 3300 psychological level
if market successfully break 3280 level then it will move towards 3280 or even 3270
if market crosses 3330 level successfully then it will move towards 3345 or even 3360
All eyes on FOMC & NFP news for the week
Disclaimer: Forex is Risky
Gold Trade SetupI will risk!!!
It seems we are near at the end of correction wave...
The first target R/R is 2 and the second is 4...

Gold’s Precision Drop: Wave 5 Ignites the Bullish Reversal
---
### 🚀 **Golden Opportunity Ahead: Wave 5 Bullish Breakout Incoming!**
After perfectly completing the **bearish Gartley pattern**, gold dropped precisely to the **target zone at 3,323**, just as predicted. This move confirmed the formation of **Wave 5**, signaling the end of the corrective phase.
Now, all signs point to a **strong bullish reversal**—and the next step is a powerful rally toward the predefined targets. This is a **prime buying opportunity** for traders looking to ride the wave!
### 🎯 **Buy Zone:**
- **Entry:** Around **3,323 USD**
### 📈 **Profit Targets:**
| Target | Fibonacci Level | Price (USD) |
|--------|------------------|-------------|
| TP1 | 1.0 | 13,447.875 |
| TP2 | 1.27 | 13,536.025 |
| TP3 | 1.618 | 13,649.640 |
The link of. The previous analysis is below in the comment
---

Gold Price Update – Bearish Flag Signals Possible Drop AheadGold is currently trading around $3,324, showing consolidation after a recent decline from the $3,345 region. The chart shows a bearish flag pattern forming after the sharp drop, indicating potential continuation of the downtrend. If gold fails to break above this region, sellers may push the price lower towards $3,301 and possibly $3,275.
The descending trend line adds further bearish pressure, limiting upside momentum unless gold decisively breaks and holds above $3,345. Overall, gold remains under short-term bearish sentiment, with the focus on support retests. Any bullish momentum will only be confirmed if the price closes above the flag and trendline resistance.
Key Points
Resistance Zones: $3,328 (0.618 Fib), $3,345 (flag top).
Support Zones: $3,301 (Fib base), $3,284, and $3,275 (bearish extension).
Trend Outlook: Short-term bearish unless price breaks above $3,345 with volume.
Bearish Targets: $3,301 → $3,284 → $3,275.
Bullish Invalidations: Break and close above $3,345 may shift bias to bullish.
Note
Please risk management in trading is a Key so use your money accordingly. If you like the idea then please like and boost. Thank you and Good Luck!

XAU / USD Weekly ChartHello traders. News was good for the US dollar this morning. Powell did nothing, as expected, and gold is testing the lower boundries of the weekly candle body from last week. So now the question is, do we push down more, or does gold move up to take out all the leveraged shorts that are in profit? I marked the area to watch. Buys and sells with break and close out of the zone. Let's see how the daily and 4 hour candles play out. Shout out to Big G. Be well and trade the trend.

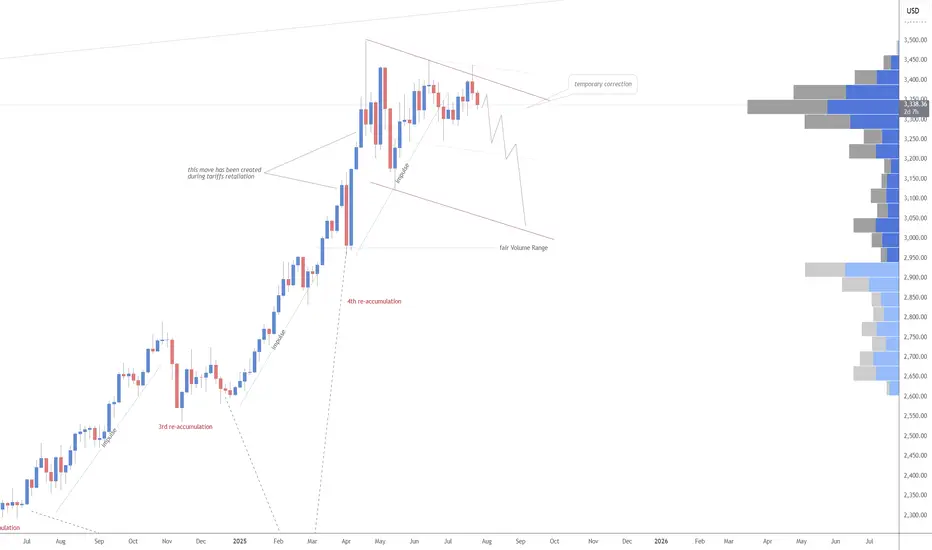
XAU/USD - Potential TargetsDear Friends in Trading,
How I see it,
Let me know if anything is unclear.
If Gold is attempting to achieve 4000, a proper correction is necessary.
Keynote:
The big red arrow/short below the range is what is supposed to happen,
but nobody will agree.
It's okay - I'm biased, I love to short!
I sincerely hope my point of view offers a valued insight
Thank you for taking the time study my analysis.

Gold (XAU/USD): Supply Zone Rejection & Bearish Breakdown Chart Breakdown:
Supply zone rejection: Gold revisited the “supply zone” (light green/grey area) and failed to break above — a classic signal of seller dominance.
Uptrend invalidated: A sharp rise (steep black trendline) ended with a peak marked by the green arrow, followed by a decisive breakdown.
Ichimoku Cloud test: Prices slipped through the Ichimoku components, reinforcing the shift to bearish sentiment.
Potential targets: The red/green risk‑reward box highlights a short position, targeting ~3,347 then ~3,318 levels (blue labels) as initial support zones.
Strong supply base: The extensive grey zone below marks a "stronger supply zone" — this could cap any modest bounce and keep the downtrend intact.
🔍 Interpretation:
Bias: Bearish — sellers have taken control after a failed breakout.
Strategy: Short on rallies toward the mid‑green/red box (~3,373–3,380), targeting ~3,347 first and then ~3,319. Watch for support at the strong supply region (~3,292) for potential reversal or consolidation.
Risk management: Keep stop above the red zone—above recent highs (~3,380+) to limit risk.
🚀 In a nutshell: After failing to break supply and losing its short‑term uptrend, gold appears poised for a pullback. The next key levels to watch are ~3,347 and ~3,319—where buyers might step back in, or the downtrend continues toward the deeper supply base.

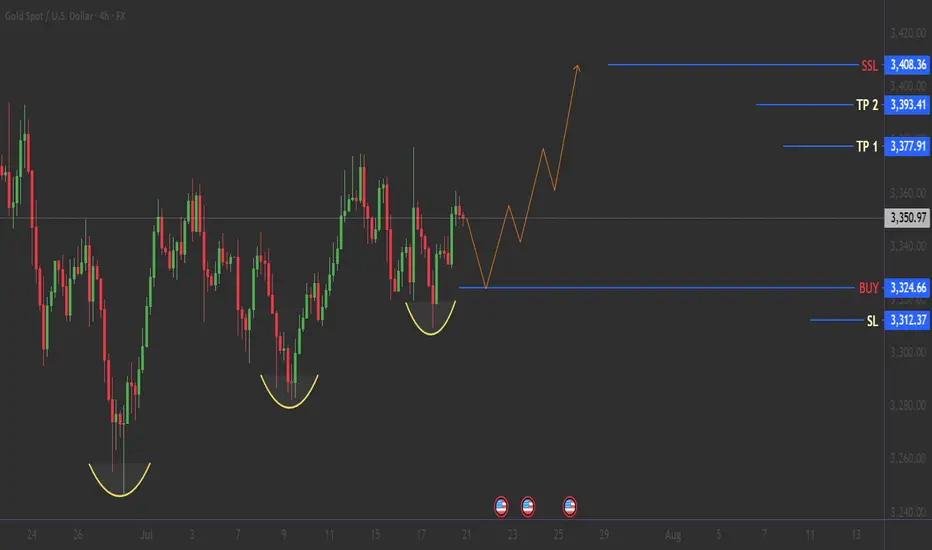
GOLD: Bullish Reversal Pattern Activated! 21/07/2025THE GOLDEN SETUP: Triple Bottom Masterpiece :
🟢 BULLISH BREAKOUT SETUP
🎯 BUY ZONE: $3,324 (Neckline Break)
🚀 TP1: $3,377
🚀 TP2: $3,393
🚀 LAST TP : $3,408
Stop Loss: $3,312 (Below recent low) 🚨
🌟 Before You Trade:
✅Wait for neckline break ($3,325+)🔥
✅Confirm with volume surge
✅Set stop loss below pattern ($3,312)
✅Calculate position size (max 2% risk)
--------------- N O T E ----------------
🚨 RISK MANAGEMENT 💡DYOR
Follow for more high-probability setups! 📊✨
Gold remains in a bearish trendGold followed our previous analysis closely, rejecting from the strong resistance level at $3430, confirming bearish momentum. This rejection has opened the door for a potential move toward the 3400 level, and further downside is likely.
Gold remains in a bearish trend. A temporary pause or minor consolidation may occur, but the overall direction remains to the downside. This week, markets are watching the outcome of the ES–US agreement closely. If a resolution is reached, it could strengthen the USD and increase risk appetite—potentially pushing gold even lower.
We expect gold to remain under pressure unless major market sentiment shifts. A break below 3400 could accelerate the drop toward 3322.
You May find more details in the chart.
Ps Support with like and comments for better analysis Thanks.

GOLD BULLISH IN 1HR TIME FRAME GOLD followed the same pattern from its previous data and will be going for the ATH

#XAUUSD H1 Setup – Smart Money Outlook📊 **#XAUUSD H1 Setup – Smart Money Outlook**
What we've been observing over the **last 3 sessions** is consistent **selling pressure** with **no meaningful pullback** yet — something that’s usually inevitable, even in strong downtrends.
🔁 A **retracement** is likely, and to identify key levels, we use the **Fibonacci Retracement Tool**.
---
### 🔍 **Market Sentiment Right Now**:
* Many traders are expecting a pullback into the **3348–3360 H1 Order Block**,
* Others are targeting **3368–3375** as a sell zone.
But here’s the twist:
⚠️ **Both these zones** could be potential **sell trap areas** (Fakeout Zone 1 & 2).
Why? Because **massive liquidity sits just above these levels**.
---
### 💡 **Smart Money Logic**:
Above the second fakeout zone lies an **inducement area** (liquidity pool).
And beyond that sits our **true institutional sell zone** at **3388–3393**, which aligns perfectly with the **Golden Fibo Zone (0.50–0.618)**.
📌 This is where we may see the **real bearish reaction**.
---
### 🟢 **Buy Setup Plan (Short-Term Opportunity)**:
If we get a **fully bullish H1 candle close above 3345**, we’ll look to **buy** with:
* **Entry:** Above **3345**
* **Stoploss:** Around **3332**
* **Target 1:** **3355**
* **Target 2:** **3368**
*(Potential final move into the trap zone)*
📢 **Important Note**: No buy will be considered without a strong **bullish H1 candle close** for confirmation. ✅
---
Let the market come to us — stay smart, not emotional. 🧠💰
\#SmartMoneyConcepts #XAUUSD #H1Analysis #LiquidityHunt #OrderBlock #GoldenFiboZone

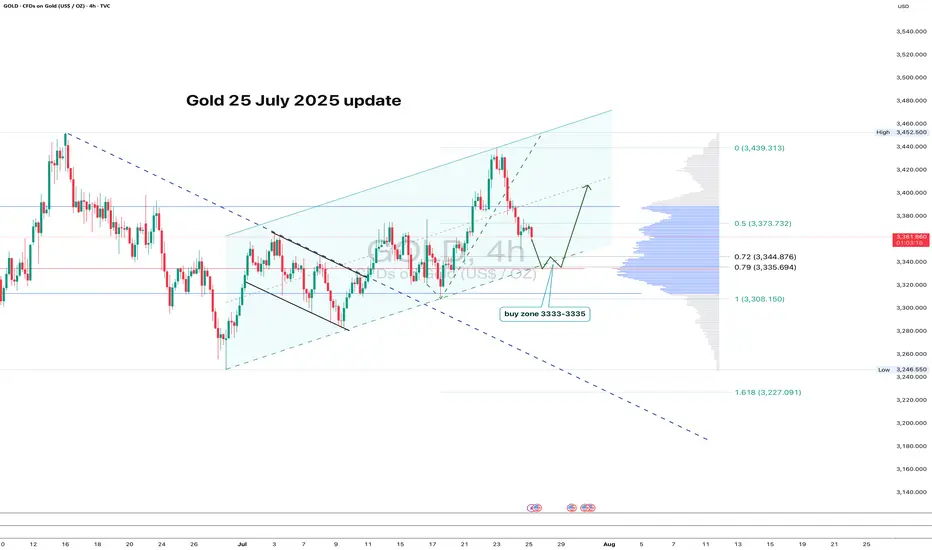
GOLD: clean pullback - now let’s see if support holdsGold continues to trade within an ascending channel on the 4H chart. After a local high, the price pulled back and is now approaching the key zone at 3333–3335. This area lines up with the 0.79 Fib retracement, the lower channel boundary, and a major volume cluster — a classic confluence zone.
If buyers show up here and we get a bullish reversal candle, this becomes a valid long setup with a tight stop just below the level. First target is 3373 (0.5 Fib), followed by a potential retest of the high near 3439.
The structure remains intact, the pullback is orderly, and volume supports the move. As long as the channel holds - the bias stays bullish.
XAUUSD Update - Continuation to Break the Bermuda triangle ?on the last week, we could see that triangle pattern has been breakout.
This week, it will continuation to break more higher ?
Let the chart answer it...if 3380's level could be touch, it's a first symptom of reversal to upside movement.
At the bottom side of triangle, we could see that it still respect to the bottom trend line.
Have a blessing week a head !

Japanese Candlestick Cheat Sheet – Part OneSingle-Candle Formations That Speak
Before you dream of profits, learn the one language that never lies: price.
Indicators are just subtitles — price is the voice.
Japanese candlesticks are more than just red and green bars — they reflect emotion, pressure, and intention within the market.
This series will walk you through the real psychology behind candlestick patterns — starting here, with the most essential:
🕯️ Single-candle formations — the quiet signals that often appear before big moves happen.
If you can’t read a doji, you’re not ready to understand the market’s hesitation.
If you ignore a hammer, you’ll miss the moment sentiment shifts.
Let’s start simple. Let’s start strong.
This is Part One of a five-part series designed to build your candlestick fluency from the ground up.
1. DOJI
Bias: Neutral
What is the Doji pattern?
The Doji candlestick pattern forms when a candle’s open and close prices are nearly identical, resulting in a small or nonexistent body with wicks on both sides. This pattern reflects market equilibrium, where neither buyers nor sellers dominate. Dojis often appear at trend ends, signaling potential reversals or pauses.
As a fundamental tool in technical analysis, Dojis help traders gauge the psychological battle between buyers and sellers. Proper interpretation requires context and experience, especially for spotting trend shifts.
Meaning:
Indicates market indecision or balance. Found during trends and may signal a reversal or continuation based on context.
LONG-LEGGED DOJI
Bias: Neutral
What is the Long-Legged Doji pattern?
The Long-Legged Doji captures a moment of intense uncertainty and volatility in the market. Its long wicks represent significant movement on both sides, suggesting that neither buyers nor sellers have control. This back-and-forth reflects the psychology of market participants wrestling for control, which often foreshadows a shift in sentiment. When traders see a Long-Legged Doji, it highlights the need to monitor for potential changes in direction.
They can appear within trends, at potential reversal points, or at consolidation zones. When they form at the end of an uptrend or downtrend, they often signal that the current trend may be losing momentum.
Meaning:
The prominent wicks indicate volatility. Buyers and sellers pushed prices in opposite directions throughout the session, ultimately reaching an indecisive close.
SPINNING TOP
Bias: Neutral
What is the Spinning Top pattern?
A Spinning Top is a candlestick with a small body and long upper and lower wicks, indicating that the market has fluctuated significantly but ultimately closed near its opening price. This pattern often points to a moment of indecision, where both buyers and sellers are active but neither dominates. Spinning Tops are commonly found within both uptrends and downtrends and can suggest that a trend is losing momentum.
For traders, a Spinning Top provides a valuable insight into market psychology, as it hints that the prevailing sentiment may be weakening. While Spinning Tops alone aren’t always definitive, they can serve as a precursor to larger moves if the following candles confirm a shift in sentiment.
Meaning:
Shows indecision between buyers and sellers. Common in both up and downtrends; signals potential reversal or pause.
HAMMER
Bias: Bullish
What is the Hammer pattern?
A Hammer candlestick appears at the end of a downtrend, with a small body and a long lower wick. This shape reflects a moment when sellers pushed prices lower, but buyers managed to absorb the selling pressure and drive prices back up before the close. This pattern is particularly important for spotting potential reversals, as it indicates that buyers are beginning to reassert control.
Hammers reveal the underlying psychology of a market where buying confidence is emerging, even if sellers have dominated for a while. To successfully trade this pattern, it’s essential to confirm the reversal with subsequent candles.
Meaning:
Showing rejection of lower prices. Signals potential bullish reversal, especially if followed by strong buying candles.
INVERTED HAMMER
Bias: Bullish
What is the Inverted Hammer pattern?
The Inverted Hammer forms at the bottom of a downtrend, with a small body and long upper wick. This pattern shows that buyers attempted to push prices higher, but sellers ultimately brought them back down by the close. The Inverted Hammer is an early sign of buyer interest, hinting that a trend reversal may be underway if subsequent candles confirm the shift.
Interpreting the Inverted Hammer helps traders understand where sentiment may be shifting from bearish to bullish, often marking the beginning of a recovery. Recognizing these patterns takes practice and familiarity with market conditions.
Meaning:
Showing rejection of higher prices. Can signal bullish reversal if confirmed by subsequent buying pressure.
DRAGONFLY DOJI
Bias: Bullish
What is the Dragonfly Doji pattern?
The Dragonfly Doji has a long lower wick and no upper wick, forming in downtrends to signal potential bullish reversal. This pattern reveals that sellers were initially in control, pushing prices lower, but buyers stepped in to push prices back up to the opening level. The Dragonfly Doji’s unique shape signifies that strong buying support exists at the lower price level, hinting at an impending reversal.
Recognizing the psychology behind a Dragonfly Doji can enhance a trader’s ability to anticipate trend changes, especially in markets where support levels are being tested.
Meaning:
Found in downtrends; suggests possible bullish reversal if confirmed by a strong upward move.
BULLISH MARUBOZU
Bias: Bullish
What is the Bullish Marubozu pattern?
The Bullish Marubozu is a large, solid candle with no wicks, indicating that buyers were in complete control throughout the session. This pattern appears in uptrends, where it signals strong buying momentum and often foreshadows continued upward movement. The absence of wicks reveals that prices consistently moved higher, with little resistance from sellers.
For traders, the Bullish Marubozu offers a glimpse into market psychology, highlighting moments when buyer sentiment is particularly strong. Learning to identify these periods of intense momentum is crucial for trading success.
Meaning:
Showing complete buying control. Found in uptrends or at reversal points; indicates strong buying pressure and likely continuation of the trend.
SHOOTING STAR
Bias: Bearish
What is the Shooting Star pattern?
The Shooting Star appears at the top of an uptrend, characterized by a small body and a long upper wick, indicating a potential bearish reversal. Buyers initially drove prices higher, but sellers took over, bringing prices back down near the open. This shift suggests that buyers may be losing control, and a reversal could be imminent.
Interpreting the Shooting Star gives traders valuable insights into moments when optimism begins to fade, providing clues about a potential trend shift.
Meaning:
Indicating rejection of higher prices. Signals a potential bearish reversal if followed by selling pressure.
HANGING MAN
Bias: Bearish
W hat is the Hanging Man pattern?
The Hanging Man candle forms at the top of an uptrend, with a small body and long lower wick. This pattern suggests that sellers attempted to drive prices down, but buyers regained control. However, the presence of a long lower shadow hints that sellers may be gaining strength, potentially signaling a bearish reversal.
The Hanging Man pattern reflects market psychology where buyers might be overextended, making it a valuable tool for identifying potential tops in trends.
Meaning:
Signals potential bearish reversal if confirmed by selling candles afterward.
GRAVESTONE DOJI
Bias: Bearish
What is the Gravestone Doji pattern?
With a long upper wick and no lower wick, the Gravestone Doji reveals that buyers pushed prices up, but sellers eventually regained control. Found in uptrends, it suggests that a bearish reversal could be near, as the upper shadow indicates buyer exhaustion. The Gravestone Doji often appears at market tops, making it a valuable indicator for those looking to anticipate shifts.
Understanding the psychology behind this pattern helps traders make informed decisions, especially in markets prone to overbought conditions.
Meaning:
Showing rejection of higher prices. Found in uptrends; signals potential bearish reversal if followed by selling activity.
BEARISH MARUBOZU
Bias: Bearish
What is the Bearish Marubozu pattern?
The Bearish Marubozu is a large, solid bearish candle without wicks, showing that sellers held control throughout the session. Found in downtrends, it signals strong bearish sentiment and suggests that the trend is likely to continue. The lack of wicks reflects consistent downward momentum without significant buyer support.
This pattern speaks about market psychology, offering traders insights into moments of intense selling pressure. Recognizing the Bearish Marubozu can help you align with prevailing trends and avoid buying into weakening markets
Meaning:
Showing strong selling pressure. Found in downtrends; signals continuation of the bearish trend or an intensifying sell-off.
👉 Up next: Double-candle formations – where price meets reaction.
GOLD Weekly Idea💡Why Gold Pulled Back
- Gold pulled back today after hitting $3439.04, just below resistance at $3451.53. Traders took profits ahead of key Fed and trade headlines. Right now, it’s trading around $3414.48, down 0.50%.
- The dip came after the U.S.-Japan trade deal eased geopolitical tension, cutting safe-haven demand. Plus, U.S. bond yields are climbing (10-year at 4.384%), which adds pressure on gold.
Support is building at $3374.42, with stronger buying interest expected around $3347.97 and the 50-day moving average at $3336.40 — a key level bulls want to defend.
Short-term looks a bit weak, but as long as gold holds above the 50-day MA, the bullish trend remains intact. Longer-term, weakness in the dollar, central bank gold buying, and concerns about Fed independence could push prices higher.
🔍Watching the Fed’s July 29–30 meeting next
The Myth of Gold Reversals – Why Traders Keep Catching the KnifeGold is a master of deception.
It shows a clean wick into a zone, but reacts just enough to pull in early buyers or sellers — then rips straight through their stops like they weren’t even there.
The reversal looked real and the candles seemed perfect.
But the move? It was never meant for them.
This isn’t bad luck, but traders who survive aren’t trying to guess, they are the ones reading the reaction after the trap.
Let’s break down how these traps happen — and how Smart Money actually operates when XAUUSD is loading a real move.
🟥 Sell Trap – The "Instant Short" Mistake
Price pushes up into a clear reaction zone — maybe an OB, maybe an imbalance, a FVG, or a gap.
Structure looks stretched. Traders recognize a premium zone and decide it’s time to short.
The trap? Jumping in immediately on the touch, with no confirmation.
This is where Gold loves to trap sellers.
No M15 CHoCH/ BOS on M5 or real liquidity swept. Just a blind move and hope.
Price often pulls slightly higher — sweeping internal liquidity, triggering SLs — then shows a real rejection.
📌 Here’s what needs to happen before selling:
• First: look for a liquidity sweep (equal highs or engineered inducement)
• Then: price must shift — CHoCH or BOS on M15 or M5
• Finally: confirmation via bearish engulf, imbalance fill, or break + retest
• For experts: M1 can offer refined sniper triggers with minimal drawdown
💡 If none of this appears, it’s not a setup — it’s a trap.
🟩 Buy Trap – The "Wick Bounce" Illusion
Price taps a demand zone — again, a refined OB or imbalance, liquidity zone.
A long bullish wick forms. Some candles pause. It looks like a reversal.
But there’s no shift.Just hovering.
Many jump in long the second they see the wick. And then price breaks straight through.
📌 Here’s how to flip this trap into a real buy:
• Let price sweep liquidity below the zone — signs of a purge - true wick bounce
• Watch for a CHoCH or BOS on M15, M5, or even M1
• Look for a strong bullish engulf from the reactive level
• Confirm via imbalance fill or price reclaiming broken structure
📍 If all that happens — the trap becomes your entry.
If not? Stand down.
📊 What Smart Traders Actually Do Differently
They don’t chase wicks.
And never enter just because price tapped a line.
IT IS ALL ABOUT READING STRUCTURE AND PRICE ACTION.
Here’s how:
• Mark the highest probability reaction zones — above and below current price;
• Set alerts, not blind entries;
• Wait for price to come into their zone and then watch what it does there;
• Look for confirmation: CHoCHs, BOS, engulfing candles, FVG fills, clean rejections;
• And always keep one eye on the news — because Gold reacts fast and violently when volatility hits.
• Repeat this work daily until they learn how to recognize signs faster and more secure.
That’s the difference between chasing the reversal… and trading the move after the trap.
Because in this game, patience isn’t just a virtue — it’s survival.
And Gold? Well, XAUUSD has no mercy for those in a hurry and not studying its moves day by day, month after month and so on. Learn structure and price action even if you join any channel for help if you are serious about trading this amazing metal.
If this lesson helped you today and brought you more clarity:
Drop a 🚀 and follow us✅ for more trading ideas and trading psychology.
xauussWe will probably have a minor correction in this direction. We will wait for the trend line to break, if it breaks, the targets will be touched in order.

How to correctly grasp the gold trading opportunities?Yesterday, gold prices saw a technical rally amidst volatile trading, followed by a downward trend under pressure. Bulls strongly supported a rebound at 3280 in the Asian session. The European session saw an accelerated upward move, breaking through 3314 before retreating under pressure. We also precisely positioned short positions below 3315, achieving a perfect target of 3290-3295. During the US session, the market again faced pressure at 3311, weakening in a volatile trend before breaking through 3300. The daily chart ultimately closed with a medium-sized bullish candlestick pattern, followed by a pullback and then a decline.
Overall, after yesterday's rebound, gold prices remain under pressure at the key resistance level of 3314. The short-term bearish weakness line has moved down to this level. If pressure continues in this area in the short term, gold will maintain a weak and volatile structure, with intraday trading remaining focused on rebounds and upward moves. If you are currently experiencing confusion or unsatisfactory trading strategies, please feel free to discuss your options and help avoid investment pitfalls.
From a 4-hour analysis perspective, focus on resistance at 3305-3315 on the upside. A rebound to this level is a good opportunity to short against resistance. Focus on support at 3280-3270 on the downside. Unless the price stabilizes strongly, consider not entering long positions below this level. The overall strategy remains to short on rebounds, with the same rhythm. I will provide timely notifications of specific levels from the bottom, so keep an eye on them.
Gold Trading Strategy: Short on rebounds near 3305-3315, with targets at 3290-3280-3270.
XAUUSD ShortElite analysis - NEWS TRADE
Executed of a 3m OB
Targeting lower LPs
Price is reacting at New Event of this OB.