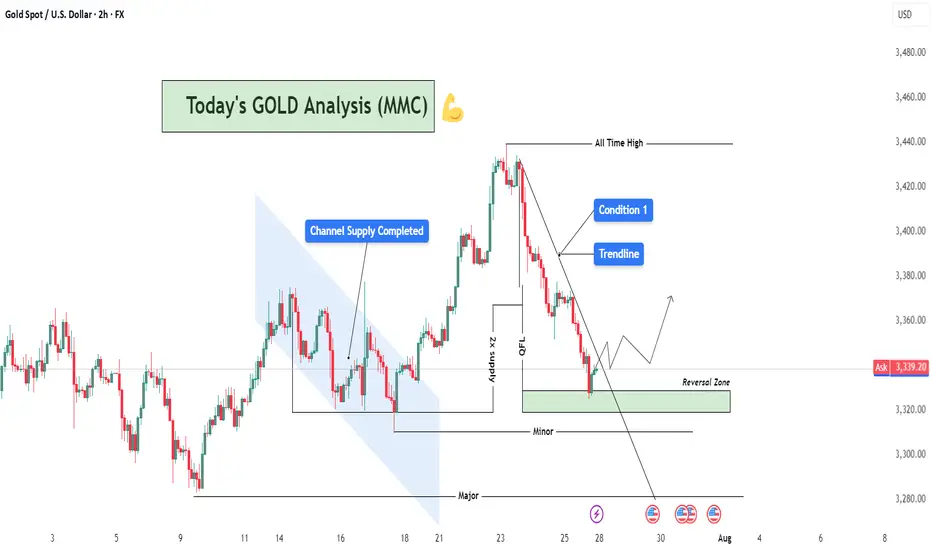
XAUUSD Analysis : Reversal Zone & Trendline Break Setup 🧠 Market Breakdown (Based on MMC Concepts)
Gold (XAU/USD) recently touched an All-Time High, followed by a sharp correction respecting a clean descending trendline — confirming strong selling pressure in the short term.
After price completed a Channel Supply zone (highlighted), it dropped significantly and created a 2x Supply Structure along with a QFL (Quasimodo Failure Level) — a strong indication of liquidity engineering by smart money.
Now, price has entered the Major Reversal Zone, which aligns with a key minor structural demand level. The reaction here becomes highly important, as it could mark the beginning of a new bullish leg.
📌 Technical Conditions
Trendline (Condition 1): Still active; breakout confirmation required for bullish entry.
Reversal Zone (Demand Area): Price currently reacting; signs of rejection forming.
Smart Money Behavior: Liquidity sweep + QFL zone = potential institutional accumulation.
Momentum Watch: Look for bullish engulfing or strong pin bar as confirmation.
🎯 Price Levels to Watch
Upside Targets:
🔹 TP1: 3,360 – 3,380
🔹 TP2: 3,420 – 3,440
Invalidation Zone:
🔻 Break and close below 3,300 = bearish continuation likely.
💡 Conclusion
Gold is approaching a decision point. If this reversal zone holds and we break the trendline, we could see a strong rally back toward previous supply zones. However, failure to hold could bring price lower for further liquidity grabs.
Stay patient. Let price confirm.
GOLD trade ideas
XAUUSD bullish reversal from a demand zoneThe setup also aligns with a liquidity sweep below previous lows, which could trigger a reversal. Price is now breaking minor resistance levels, creating early confirmation for bullish momentum.

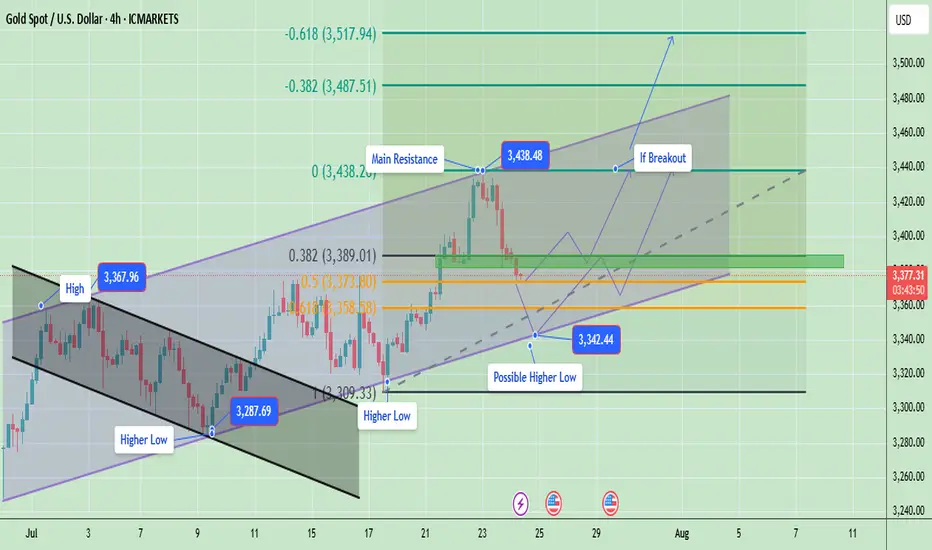
Gold Breakout or Pullback Ahead?Currently, price is in a correction phase within this rising channel after hitting the upper resistance near $3,438. The pullback is moving toward the mid and lower channel zones, which is healthy for a bullish continuation. Gold is in a healthy pullback phase inside a bigger bullish trend. If support at $3,358 – $3,373 holds, expect an upward push back to $3,438 → $3,487 → $3,517 in the coming sessions. Only a clean break below $3,309 would signal a deeper bearish move.
Gold is likely to consolidate or retest the lower channel support ($3,358 – $3,373). If buyers defend this zone, the price is expected to bounce back toward $3,400 – $3,420 and eventually retest $3,438.
Key Price Zones
- Main Resistance: $3,438 (if broken, potential rally toward $3,487 → $3,517)**
- Immediate Support: $3,373 (first reaction level)
- Major Support: $3,358 (key level to protect bullish structure)
- Potential Higher Low Zone: Around $3,342.44
Expected Price Behavior
- If gold holds above $3,373 – $3,358, it is likely to form a new higher low near $3,342 – $3,358 before attempting to push higher.
- A successful breakout above $3,438 would indicate continuation of the bullish momentum targeting $3,487 and $3,517 ).
- Failure to hold above $3,358 may open the door for a deeper correction toward $3,309, but the overall trend remains bullish unless that level is broken.
Trend Outlook
- Short-Term Trend: Consolidation / corrective pullback within a bullish channel
- Medium-Term Trend: Bullish (higher lows and breakout structure intact)
- Long-Term Trend: Bullish as long as the channel holds above $3,309
Gold is currently in a pullback phase after a strong bullish breakout. The market is likely forming a higher low and may resume upward momentum once the $3,373 – $3,358 zone is confirmed as support. A breakout above $3,438 would validate a bullish continuation toward $3,487 - $3,517.
Note
Please risk management in trading is a Key so use your money accordingly. If you like the idea then please like and boost. Thank you and Good Luck!
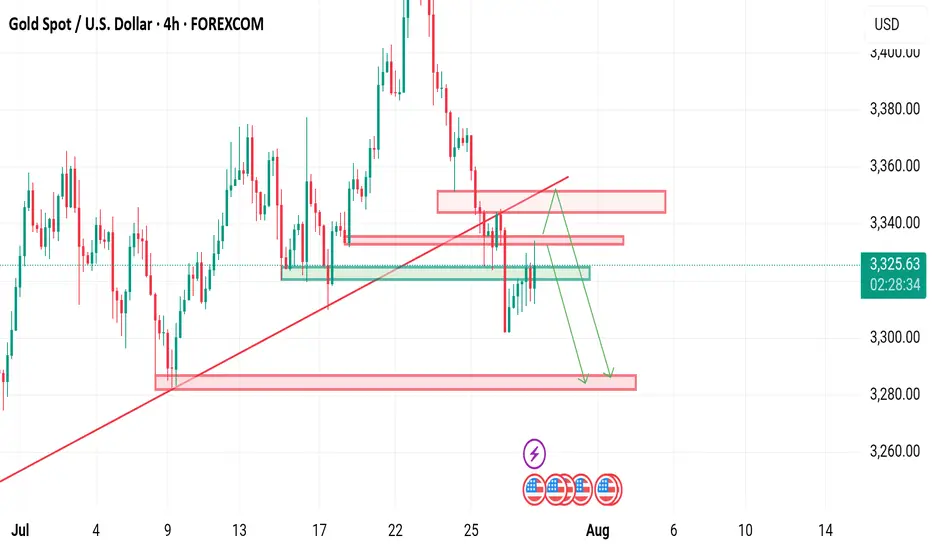
XAUUSD is still bearish Gold is currently below rising channel and holding the Range of 3320-3335,although yesterday implusive drop is incompleted without testing 3290-3280
What's possible scanarios we have?
▪️I'm still on bearish side till 3345 is invalidated and candle flips above. I open sell trades at 3332 again and holds it .
if H4 & H1 candle close above 3345 I will not hold or renter sell.
▪️Secondly if H4 candle closing above 3345 this down move will be invalid and Price-action will reached 3370.
Golden View 20250729How should we view the current market conditions?
High-level shock, large triangle convergence and breakout, has been confirmed
Bearish expectations
Next, you can try to adopt a short strategy.
The question is, where to enter the short position?

asian high sweep modelxauusd 15min view asian high sweep model with ote zone go with some ltf1min confirmation

XAUUSD Technical Analysis – Educational Insight Key Observations:
🔴 Strong Support Zone (3,278 – 3,299 USD)
This zone has been highlighted as a key institutional level where buyers have consistently stepped in.
It aligns with previous Breaks of Structure (BOS), confirming its historical significance.
📉 Recent Price Action:
Price is retracing from the highs of around 3,439 USD and is approaching the strong support zone again.
A possible liquidity grab near the support is anticipated before a bullish reversal.
🔄 Break of Structure (BOS):
Multiple BOS marked indicate shifts in market direction and the presence of aggressive buying/selling phases.
These BOS events help identify trend continuation or reversal points.
🟢 Bullish Fair Value Gap (FVG):
A bullish FVG is present, indicating imbalance in price movement where institutions may look to fill orders.
Price previously reacted positively to this zone, indicating unfilled demand.
📈 Target Area:
A clearly marked target at 3,440.487 USD, which aligns with Buy-Side Liquidity, suggests a potential liquidity run.
This implies smart money may drive price upwards after collecting liquidity below support.
Volume Profile (VRVP):
The horizontal volume bars show the highest traded volume areas, providing confirmation for key support zones and BOS reactions.
🧠 Educational Insights:
BOS (Break of Structure) is used by institutional traders to spot shifts in trend. It typically signals continuation or reversal when aligned with liquidity concepts.
Liquidity Zones (like buy-side or sell-side liquidity) often serve as magnets for price; smart money aims to trigger orders and trap retail traders.
Fair Value Gaps represent imbalances where price moved too fast; institutions may return to these zones to execute pending orders.
Volume Profile Analysis helps in understanding where the most buying/selling occurred—confirming support and resistance zones.
📌 Strategy Suggestion (For Learning Only):
Entry Idea: Wait for price to tap the strong support (ideally sweep liquidity slightly below).
Confirmation: Look for bullish engulfing or BOS on lower timeframe to confirm reversal.
Target: 3,440 area where buy-side liquidity resides.
Stop Loss: Below the strong support (near 3,270 level) to protect against deeper liquidity grabs.
📢 Disclaimer (Educational Use Only):
This analysis is for educational purposes and not financial advice. Trading involves significant risk; always do your own research or consult a financial advisor.

XAUUSD SELL SHORTXAUUSD SELL SHORT
- In Daily TF H4 TF Market is bearish
Selling from H4 SIBI In LTF Valid MSS then our entry

XAUUSD Expecting bullish Movement Gold is currently testing a strong demand zone between 3340 to 3335, which previously acted as a support area. The price action indicates potential for a bullish reversal from this zone, supported by oversold conditions and historical reaction levels.
Entry Zone: 3340 to 3335
First Target: 3375
Second Target: 3390
Two potential scenarios are highlighted:
A direct bullish reversal from the 3340–3335 zone
A slight consolidation before continuation to the upside
This setup offers a favorable risk-to-reward opportunity for intraday or short-term swing traders. Monitor price action confirmation signals before entering

#GOLD Will Keep Growing!
HI,Traders !
#GOLD keep trading in An uptrend
along the rising support So as the gold
is approaching A the support we will be
Expecting a bullish rebound !
Comment and subscribe to help us grow !

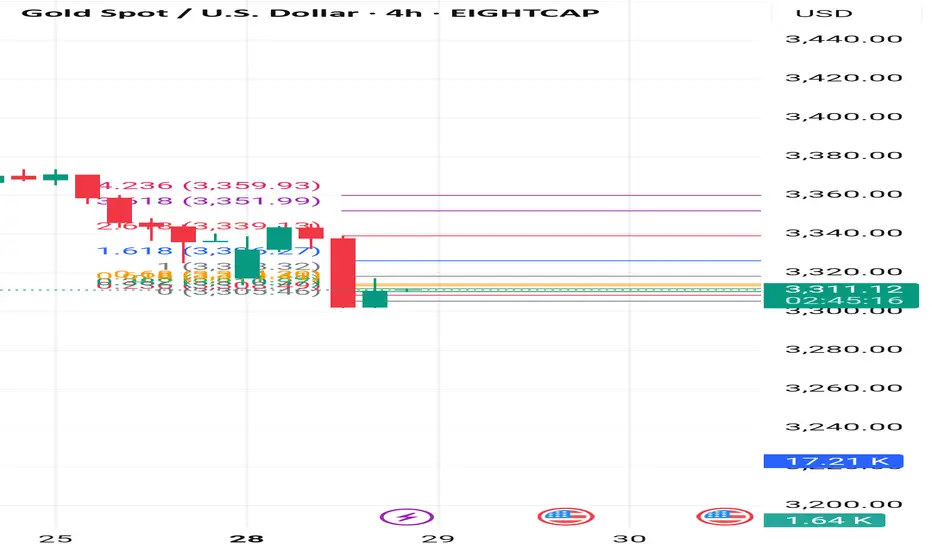
XAU / USD 4 Hour ChartHello traders. Here is a lower time frame analysis pertaining to the weekly that I recently posted. Area to watch is marked. It is the end of the month, things get tricky. Trade carefully. Be well and trade the trend. Shout out to Big G. Happy Wednesday.

GOLD BUY M15 Gold (XAUUSD) 15-Minute Chart Analysis – July 28, 2025
Price is currently forming a potential bullish setup after a recent drop. A bullish order block area has been highlighted (purple zone), indicating a possible demand zone where buyers might step in.
Entry Zone: Around 3333 – current price region.
Stop Loss (SL): 3322 (placed below the demand zone).
Target: 3350 – marked as the main bullish target.
The expected move is a bounce from the demand zone, with multiple small retracements, leading to a potential breakout toward the resistance zone around 3350.

XAUUSD BUYS PROJECTION Hey everyone wow is been long since I posted here I can say for sure trading has never been so tougher for me cuz am tryna refine my edge and I miss posting and sharing my ideas here so this is my analysis on Gold after seeing Gold rejected a strong resistance zone and price keeps pushing down tho I missed the sells but market is always full of opportunity and here are my zones to take buys from,mind you these zone are very strong support zones that mostly buyers get in the market so I will be waiting for price to get to the first zone which is the green and the second is for scaling in after placing the first on breakeven and yes I will update you guys…..

Elliott waveAccording to the bearish structure, the ABC wave is completed, there are 5 more bearish waves.
Sell 3334, stoplos 3344, tp 3310

Bullish or Bear trapHello Traders 👋
What are your thoughts on XAUUSD
Looking at the daily timeframe I anticipate manipulation by market players on gold.
Is likely that market players will stop Hunt Traders who have their stop losses at the different lows which is indicated with a red circle.
For every buyer there must be a seller and for every seller there must be a buyer.Where they are no sellers in the market the institutions will want to trigger stop losses in order to buy,which is known as stop hunting.That is to takeout previous buyers in the market and generate liquidity to buy.
And this stop hunting usually happens in a ranging market.
Looking at the structure of gold we can see that gold is ranging,
We can see a low or support of the range which was previously resistance and turned support for the ranging market.
I see the market using sell liquidity to liquidate buyers and react at the support or low of the range and move up to the range of the resistance

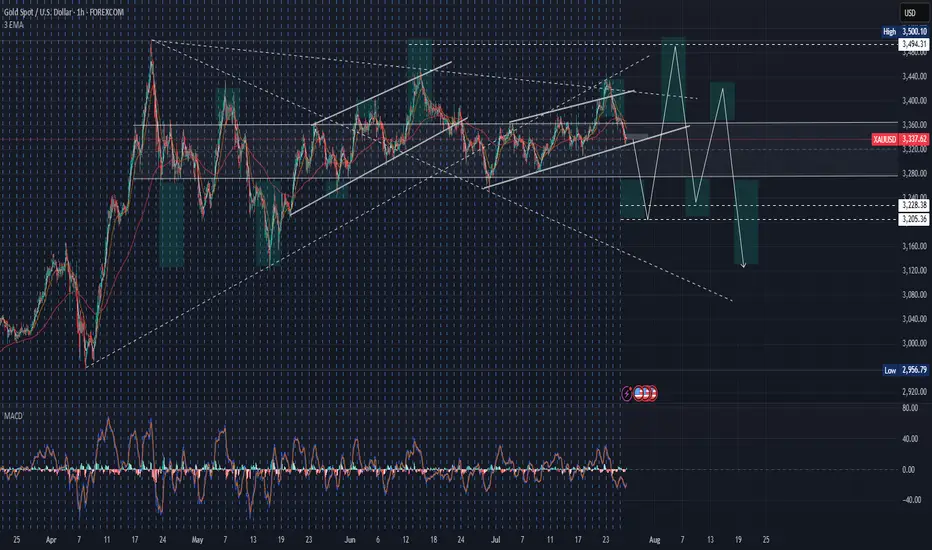
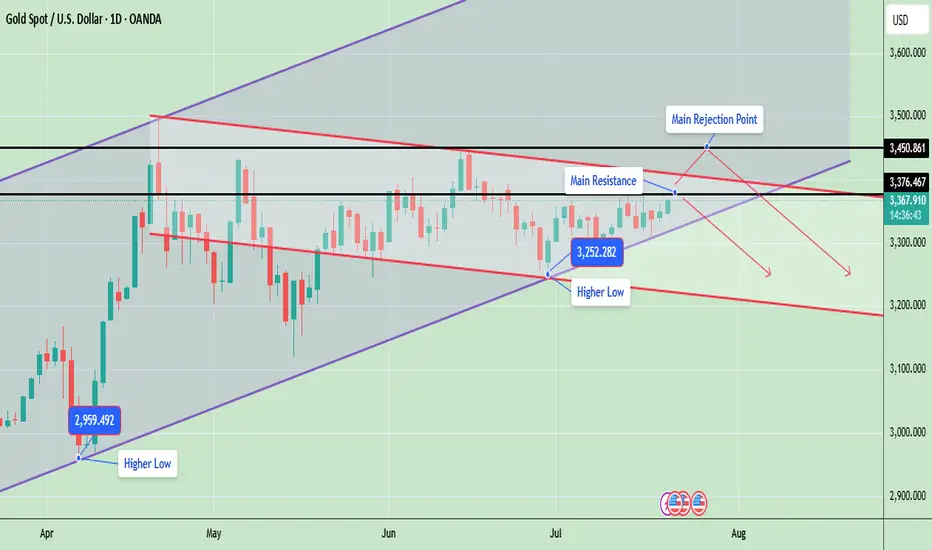
Gold Price Update – Testing Key ResistanceGold is currently trading around 3367, showing strong bullish momentum as it continues to form higher lows, which indicates an ongoing uptrend. The market structure is developing inside a rising wedge pattern, with the price consistently respecting both the ascending support and resistance lines.
Gold is now testing a key resistance zone between 3376 and 3450, an area that previously acted as a major supply zone and caused sharp rejections. A successful breakout and close above 3450 will likely confirm a bullish continuation and may open the door for a rally toward 3500 and possibly 3580. However, if gold fails to break this level, it could retrace back to the 3300 or 3250 support zones, especially if a rejection candle forms in the daily timeframe.
📊 Key Technical Highlights:
- Price has approached the upper resistance boundary of the wedge.
- Daily candle is bullish, indicating strong buying momentum.
- However, unless price closes above 3,376–3,450, there’s still a risk of rejection from the top channel and a pullback toward 3,300–3,250.
🔑 Key levels to watch:
- Gold is currently trading around $3,367, just below a crucial horizontal resistance at $3,376
- A strong breakout above $3,376, and especially above $3,450, could open the door for further bullish movement toward the $3,500–$3,600 range, following the upper trendline of the ascending channel.
- On the downside, if price fails to hold the higher low at $3,252, a drop toward $3,200 or even $3,100 is possible aligning with the downward red trendline.
- The structure remains bullish overall, as price is still making higher lows and staying within the rising channel
📊 Weekly Gold Chart Analysis
Gold is currently trading around $3,368, forming a symmetrical triangle pattern on the weekly timeframe. This pattern typically indicates a period of consolidation before a potential breakout in either direction. The price is getting squeezed between lower highs and higher lows, which is a sign of decreasing volatility and approaching breakout.
🔑 Key Technical Insights:
- ✅ Current Structure: Price has been consolidating within a triangle since April 2025 after a strong upward move. It is now near the apex of the triangle, suggesting a breakout is imminent—most likely in the next 1–2 weeks.
🔼 Bullish Breakout:
- If gold breaks above the triangle resistance (~$3,385–$3,393), it could trigger a sharp rally.
- Upside targets post-breakout: $3,450, $3,500, $3,600+ (if momentum continues)
🔽 Bearish Breakdown:
- A break below the triangle support (~$3,335–$3,325) may lead to a deeper correction.
- Downside targets post-breakdown: $3,285, $3,200
- Possibly $3,100–$3,050 if bearish sentiment intensifies
📉 Volume Drop:
As typical with triangles, volume has likely decreased, signaling indecision. Once volume returns, it will likely confirm the breakout direction.
Note
Please risk management in trading is a Key so use your money accordingly. If you like the idea then please like and boost. Thank you and Good Luck!
GOLD Long After Lower Dip - Catching PullbackOANDA:XAUUSD / TVC:GOLD Long Trade, with my back testing of this strategy, it hits multiple tp, here price will pullback up.
Price will bounce in this zone.
I kept SL slight big to be safe because TP levels are good so I don't want to get pushed out because of tight SL.
Note: Manage your risk yourself, its risky trade, see how much your can risk yourself on this trade.
Use proper risk management
Looks like good trade.
Lets monitor.
Use proper risk management.
Disclaimer: only idea, not advice

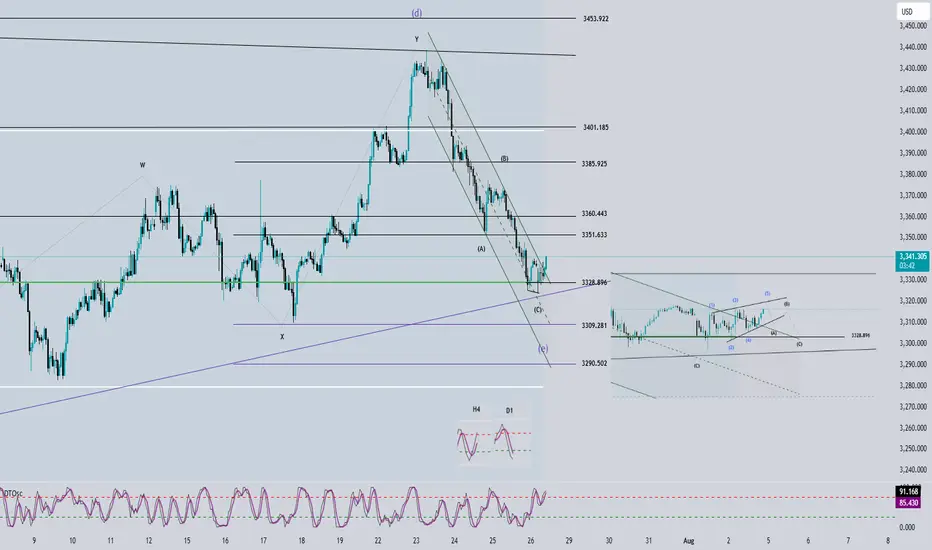
Elliott Wave Analysis – XAUUSD – July 28, 2025📊
________________________________________
🔍 Momentum Analysis:
• D1 Timeframe: Momentum has entered the oversold zone. This strongly suggests a potential bullish reversal today, which could lead to a rally or sideways movement lasting around 4–5 days.
• H4 Timeframe: Momentum is reversing upward. This indicates a likely bullish or sideways move in the short term, at least until momentum reaches the overbought zone (estimated within the next 2 H4 candles).
• H1 Timeframe: Momentum is currently overbought, so we may first see a pullback or sideways movement until a clearer reversal signal appears.
________________________________________
🌀 Wave Structure Analysis:
• On the H4 chart, as noted in previous plans, the assumption that price is forming a contracting triangle (abcde) is still valid. Price is currently in the final leg (wave e) of this triangle.
• On the H1 chart, we can observe a channel structure, within which an abc corrective pattern is unfolding.
• The lower boundary of the triangle (marked by the green trendline) combined with support zones will be critical areas to monitor for the end of wave e.
🔺 Note: Wave e does not necessarily end precisely at the triangle boundary – it can slightly overshoot. Hence, we’ll rely on smaller wave structures to identify potential reversal zones.
________________________________________
🎯 Key Price Zones to Watch:
• Target 1: 3329
• Target 2: 3309
• Target 3: 3290
________________________________________
🔎 Lower Timeframe Structure (M10):
From the current price action (as shown in the chart), we can see a leading diagonal triangle structure forming. This is a pattern commonly seen in wave 1. If this pattern is confirmed, a sharp and steep decline toward the 3329 zone is likely.
________________________________________
⚖️ Combining Momentum & Wave Structure:
• D1: Signals a potential reversal → favors Buy setups.
• H4: Momentum is rising, but price hasn’t confirmed a new bullish trend → need to stay alert and tighten Stop Loss.
• H1: Overbought + possible leading diagonal → Expecting a pullback for wave 2 toward 3329 → this would be the optimal Buy zone.
________________________________________
🧭 Trade Plan:
• For experienced traders:
→ Wait for price to reach key levels and watch for reversal signals before entering.
• For beginners:
→ Use the following Limit Buy setup:
✅ Setup 1:
• Buy zone: 3330 – 3328
• Stop Loss: 3320
• TP1: 3351
• TP2: 3370
• TP3: 3385
✅ Setup 2:
• Buy zone: 3310 – 3308
• Stop Loss: 3300
• TP1: 3328
• TP2: 3351
• TP3: 3370
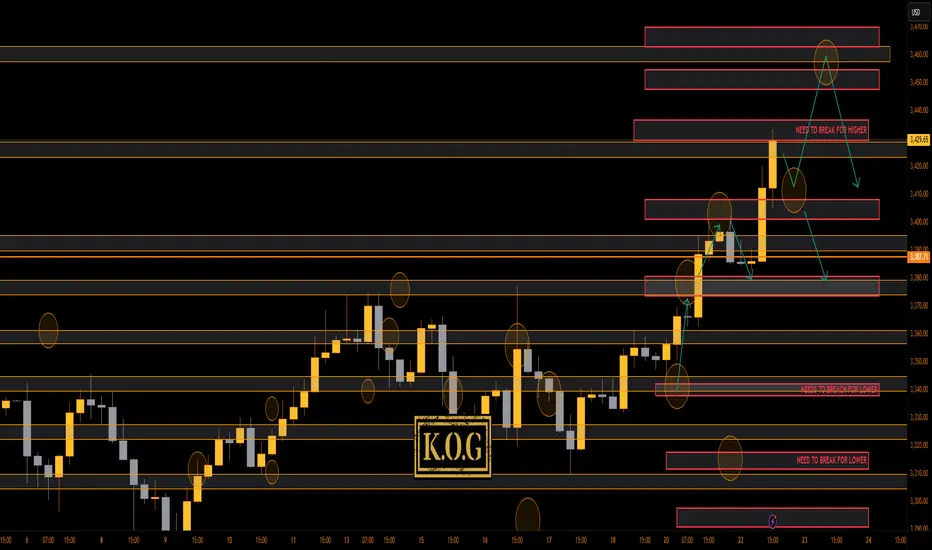
THE KOG REPORT - UpdateA rare day for us today even though we got the level for the short from above, we activated again, and due to everything lining up confirming the short into the lower order region where we wanted to bounce, we took it. Gold, had other plans, engulfing upside resulting in us having to SL the trade. It then went on to break above and complete our daily targets.
You win some, you lose some!
Now, we have support below at the 3410 region which will need to break to change short-term structure, while there is the order region above 3430-35 which could hold price and accumulate. All our bullish targets for the day are completed, we just wanted lower to then go higher.
If lower support can be targeted and held, we could see a move higher into the 3345-50 region before then a reaction in price. I'm still not happy with this move, something doesn't quite look right, so let's play it day by day.
RED BOXES:
Break above 3395 for 3404✅, 3410✅ and 3420✅ in extension of the move
Break below 3375 for 3368 and 3355 in extension of the move
As always, trade safe.
KOG
Smart Money Concepts (SMC)Positive aspects of the analysis:
1. Clear structural change (BOS and CHoCH):
A breakout of the previous bearish structure (Break of Structure) and a change in character (CHoCH) are evident, indicating an intention to change the trend.
2. Fake Out Identified:
The "fake out" toward the resistance zone is typical of liquidity traps designed to catch buyers before the actual decline. This provides institutional confluence for the short.
3. 15M block order + resistance zone:
Entry from a 15-minute OB, within a broader resistance zone. This strengthens the entry points, as there is a high probability of a bearish reaction there.
4. Mitigation of the previous 1H FVG:
The market has already mitigated the 1H Fair Value Gap, which generally indicates that the price no longer needs to rise further to balance this inefficiency.
5. Target in a logical zone (3,317):
Take profit placed just before a lower support zone. This is prudent, as many traders seek to close partial positions or exits before major support.

XAUUSD - Parabolic move ahead in GOLD.Gold currently at 3339 is retesting its trendline breakout, setting the stage for a potential move to $4,000 as momentum builds. I expect all metals, particularly precious ones, to perform strongly moving forward.
If you like this idea, do boost and share :)
