GOLD trade ideas
GOLD 15M BEARS IN CONTROLGold done the damage of LIQUIDITY GRAB AND SL HUNTING, now MONEY PEOPLE ready to dump this.
I took 15m sell as seen on the chart, Lets hope works before we close this FRIDAY
GOOD LUCK

Bullish Outlook Intact: Gold Targeting 3400-3410Gold encountered resistance and retreated several times on its way to 3400, but it remained above 3370 during the pullback, perfectly maintaining the integrity of its volatile upward trend. Therefore, even though gold's upward momentum has weakened, I still believe that due to structural support, gold still has the potential to reach the 3400-3410 area, and may even continue its bullish trend to the 3420-3430 area.
As gold prices rise, market sentiment tends to be more optimistic, and the price behavior reflected by the candlestick chart becomes clearer. The lows of gold continue to rise, and the highs always insist on setting new highs in the process of rising. The oscillating upward structure is particularly obvious. While greatly limiting the retracement space, it also greatly consolidates the support structure below and is conducive to further rises in gold. At present, gold has been confirmed to have stabilized above 3370, so gold may not give another chance to fall back to the 3360-3350 area.
Then in the next short-term trading, the gold pullback is a buying opportunity. We focus on the opportunity to participate in long gold after gold retreats to 3380-3370. The target will first look at the 3400-3410 area, and the higher target area is in the 3420-3430 area.

Possible long positions with levels for XAUUSD-Gold Entry: $3,381.000
Take Profit: $3,396.589
Stop Loss: $3,370.024
Current Status & Outlook: The current candlestick formation on the 15-minute timeframe is bullish, suggesting momentum is building towards the Take Profit target. This idea is based on the premise that the bulls will continue to drive the price to test the recent high.
Disclaimer
This analysis is for educational and informational purposes only and does not constitute financial advice. The provided trade idea is based on technical analysis and historical price action, and past performance is not indicative of future results. Trading foreign exchange on margin carries a high level of risk and may not be suitable for all investors. Before deciding to trade, you should carefully consider your investment objectives, level of experience, and risk appetite. You could lose some or all of your initial investment. Seek advice from an independent financial advisor if you have any doubts. Any action you take upon the information on this chart and analysis is strictly at your own risk.

XAUUSD Short Re EntryElite Analysis
BE on previous entry
Targeting lower liquidity pools. Still vigilant to liquidity that will be coming up.

XAUUSDStart of Phase D in the distribution structure
Thanks to the esteemed professor, Professor Ramtia Seddiqi.
ARAM PISHBIN

Gold (XAU/USD) - 2H Wave Setup + Scalp Opportunities# 🔻 Gold (XAU/USD) - 2H Wave Setup + Scalp Opportunities Ahead
**By: Mohsen Mozaffarinezhad**
📅 August 7, 2025 | ⏰ Valid through August 8 (End of NY Session)
⏱ Timeframe: 2H
📌 Method: Elliott Wave + Supply/Demand + SSL Hybrid Confirmation
---
## 🧠 Market Context:
Price has completed a **strong bullish leg** and is currently forming a classic **(a)-(b)-(c)** corrective pattern. We are now between **point (b)** and the potential completion of **(c)**. The broader market is expected to **retest the lower demand POI**, possibly before resuming the uptrend.
---
## 🔎 Technical Highlights:
- 📉 Bearish correction in progress: (b) → (c)
- 📦 Major **Supply** above 3,390 – acted as rejection point
- 🟦 Strong **Demand Zone**: 3,345 – 3,320
- 🔁 Price forming a potential **ABC correction**
- 🔔 **Point of Interest (POI)** near 3,350 may offer entry confirmation
- 💠 **SSL Channel**: Currently bearish crossover
- 🔄 **RQQ, HT, MACD, RSI**: Bearish/neutral, waiting for reversal signals
- 📊 **Volatility (Vol %ile)**: 67%
- 🎯 **ATR**: 13.52 (2H – medium range)
- 🧯 **Risk Level:** Normal
---
## 🟢 Scalp Strategy:
Scalp traders can take advantage of both micro-swings at **points (a) and (b)** using lower TF (M5/M15) confirmations:
### 🎯 Scalp Buy:
- 📍 Entry: Near 3,345–3,350
- 🛑 SL: Below 3,340
- 🎯 TP: 3,365–3,370 (short-term liquidity sweep)
- ⚠️ Only on bullish SSL + RSI divergence (M5)
### 🎯 Scalp Sell:
- 📍 Entry: Near 3,375–3,380 (**point b rejection**)
- 🛑 SL: Above 3,385
- 🎯 TP: 3,360 then 3,350
- ⚠️ Use Heikin-Ashi reversal + SSL confirmation
---
## 📌 Mid-Term Outlook (Swing):
If price reaches **point (c)** around the **lower demand zone** and reacts with bullish structure (BOS, CHoCH), we anticipate a strong rally toward:
- **TP1:** 3,385
- **TP2:** 3,400
- **TP3:** 3,420 (next macro supply)
---
## ⚠️ Notes:
> This setup remains **valid until the end of NY session, August 8**.
> Wait for **clear confirmation** before execution.
> All scalps are suggested with **tight risk management**.
_Analysis by Mohsen Mozaffarinezhad | Educational Purposes Only_
---
#gold #xauusd #elliottwave #supplydemand #sslhybrid #scalping #smartmoney #tradingview #forexanalysis

Big Selling is about to see in GoldAs you can see in gold still running in internal range waiting for external range sweep and then can continue in the down side direction.
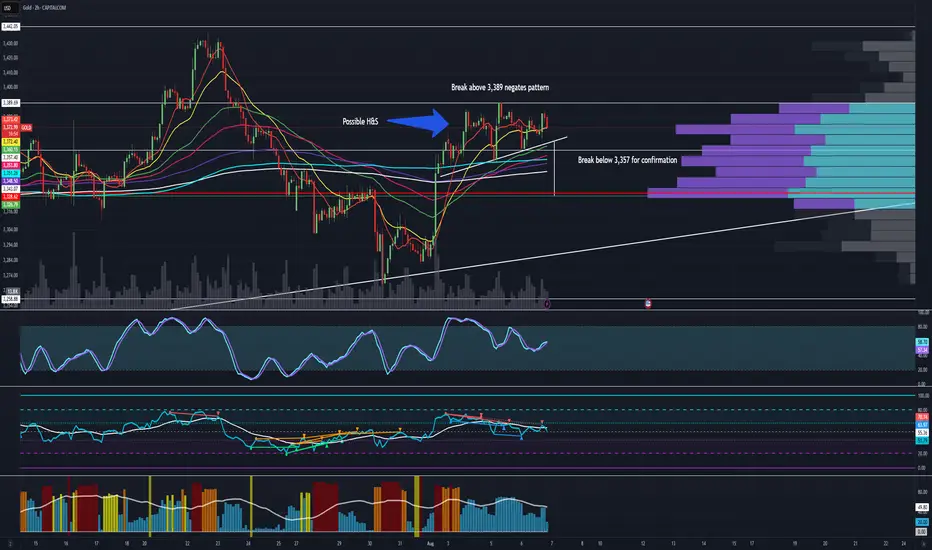
Possible Head and Shoulders Pattern - Analysis and TargetsWe have a possible head and shoulders formation on Gold. Upon a break below 3,358, we would have a target down to 3,327 which also would line up with our volume blocks on the VPVR. A break above 3,390 would negate this pattern. If we break down we are still in a macro ascending triangle formation which would be a bullish formation until proven otherwise.
Short Term : Bearish
Medium/Long Term : Bullish
XAUUSD (Gold) Trading Plan – M15 Timeframe📅 For: Wednesday 6th August – Thursday 7th August 2025
⏱ Timeframe: 15-Minute (M15)
📈 Strategy Type: Intraday Trend-Following with Scaling Out
📊 Bias: Bullish
🎯 Approach: Buy-the-Dip with Laddered Targets
🧠 Market Structure Overview
Gold continues to build a solid bullish structure on the lower timeframes, respecting trend channels and maintaining higher highs and higher lows. After Monday and Tuesday’s impulsive moves, price action is now consolidating within a rising range, offering a clean opportunity to trade retracements toward support and ride continuation waves.
M15 structure shows Gold is setting up for a healthy pullback toward key dynamic support, creating a prime dip-buying setup. This plan focuses on precision entries after retracement and riding momentum toward well-defined short-term resistance zones.
🔍 Execution Plan Details
✅ Phase 1: Buy After Retracement to 3369 (Key Intraday Support)
Buy Level: 3369
Why This Level?
Confluence of dynamic support (50 EMA on M15)
50–61.8% Fibonacci retracement of previous M15 impulse leg
Intraday support formed from previous structure breakout
Entry Confirmation:
Bullish engulfing candle, pin bar, or rejection wick on M15
RSI (14) bouncing above 40
Price holds above 3367 for at least two candles
Stop Loss:
Below 3362 (structure invalidation zone)
🎯 Target 1: 3377
Reasoning:
First resistance level from earlier London/NY sessions
Key psychological intraday level
Expected reaction zone from sellers
Action at 3377:
Take 30–40% profit
Move SL to breakeven or just below 3371
Prepare for potential re-entry on pullback
✅ Phase 2: Wait for Pullback (Post-3377 Push)
Retracement Zone: 3372–3373
Why?
Higher low formation expected
Intraday support from previous resistance-turned-support
Good re-entry zone to catch second leg
Confirmation to Re-enter:
Small bullish flag breakout or strong bullish candle
MACD crossover on M5/M15 for added momentum confidence
🎯 Target 2: 3383
Why This Target?
Prior M15 swing high
Aligned with 1.272 Fibonacci extension from initial move
Could act as a mid-term resistance or NY high
Action at 3383:
Secure another 30–35% profit
Move trailing SL up to 3377 or dynamic support (50 EMA)
Watch volume and price reaction at this zone
✅ Phase 3: Final Re-Entry or Hold Toward 3390
Retracement Zone: 3378–3380
Conditions:
Strong bullish price action continuation
Rejection from support after healthy consolidation
🎯 Target 3: 3390
Why This Target?
Next significant resistance and round number magnet
Frequently tested during NY session extensions
May attract liquidity from late buyers and algorithmic activity
Final Action at 3390:
Close all remaining positions
Wait for reversal or potential breakout setup for the next day
⚠️ Risk & Trade Management
Risk per trade: 1.0–1.5% of account capital
SL Management:
BE after TP1
Trailing SL based on price structure and moving average
Entry Conditions:
No entry without confirmation
Avoid entries during major high-impact news events
🔁 Summary Table
Phase Buy Level Target Stop Loss Action
Phase 1 3369 3377 3362 Take 30–40%, move SL to BE
Phase 2 3372–3373 3383 3369 Take 30–35%, trail SL
Phase 3 3378–3380 3390 3372 Close all positions
🧭 Session Timing Considerations
Asian Session: Watch for retracement and entry toward 3369
London Open (3pm SGT): Momentum likely builds to hit 3377–3383
New York Open (8:30pm SGT): Final push possible to 3390 if volume supports
If price opens above 3377, wait for a pullback to re-enter — no FOMO chasing.
📊 Technical Tools Used
Fibonacci Retracement & Extensions
EMA 50 & 200 (M15) for dynamic support/resistance
RSI (14) for momentum divergence and confirmation
MACD (5,13,1) for timing micro-entries

GOLD clear sightDear all my friends wish you bests.
1. We have strong trading range in Daily and 4H this mean market can move up and down anytime and grab liquidity.
2. Analyzing waves going to show there is a downtrend structure as correction but if you look it in weekly its always upward for gold.
3. as market couldnt pass 3452 its going to 3152
if you trade daily careful market moves extremly crazy as we have big trading range in daily.
"IT'S JUST GOOD BUSINESS"

XAUUSD: Buy ideaOn XAUUSD we would have a high probability of having an uptrend after the rebound on the support line and also with the strong break of the vwap and the resistance line by a large green candle.

Gold Analysis and Trading Strategy | August 6✅ Fundamental Analysis
🔹 Tariff Policies Increase Global Uncertainty: U.S. President Donald Trump has proposed imposing high tariffs on countries such as Canada, Brazil, and India. This move may increase operating costs for global businesses and further intensify economic uncertainty, prompting a continued inflow of safe-haven capital into the gold market.
🔹 Fed Leadership Change Expectations Bullish for Gold: Trump has expressed intentions to replace current Federal Reserve Chair Jerome Powell. The market anticipates that the new appointee will likely adopt a more dovish stance, which could suppress the U.S. dollar and provide medium-to-long-term support for gold prices.
✅ Technical Analysis
🔸 During the Asian session, gold experienced a slight pullback but stabilized afterward, maintaining a steady upward consolidation structure. This trend is expected to continue into the European session, with short-term focus on a potential breakout above key resistance zones.
🔸 4-Hour Chart Analysis: Price action shows signs of rejection near the accelerated uptrend line, indicating short-term downside pressure. Gold is currently near the upper Bollinger Band, with MACD momentum weakening—suggesting a possible technical correction and that caution is warranted when buying at higher levels.
🔸 1-Hour Chart Analysis: The price has started to flatten out and is now trading below the moving averages. Key technical indicators such as KDJ and MACD have formed bearish crossovers, implying a likely short-term pullback before the trend resumes higher.
🔴 Resistance Levels: 3385–3390 / 3405–3430
🟢 Support Levels: 3365–3370 / 3345–3350
✅ European Session Trading Strategy Reference
🔺 Long Strategy:
🔰 If gold pulls back and stabilizes in the 3365–3370 area, consider light long positions.
🎯 Target: 3390–3400
🔻 Short Strategy:
🔰 If gold rebounds to the 3390-3395 area and shows signs of resistance, consider light short positions.
🎯 Target: 3370–3360
⚠️ Strategy Summary:
🔰 A confirmed breakout above 3390 could open up upside potential toward the 3400–3430 range.
🔰 A breakdown below 3350 would increase the risk of a deeper correction.
🔥Trading Reminder: Trading strategies are time-sensitive, and market conditions can change rapidly. Please adjust your trading plan based on real-time market conditions. If you have any questions or need one-on-one guidance, feel free to contact me🤝

gold trading strategy for todayThe price is 3,400 USD/ounce. The main reason is believed to be due to the weaker-than-expected US labor market, increasing the possibility of the US Federal Reserve (FED) cutting interest rates, thereby promoting the increase of this precious metal as investors seek gold as a safe haven.
Some analysts note that, since reaching a historical peak of 3,500 USD on April 22, 2025, the gold price has fluctuated in a narrow range from 3,180 to 3,400 USD/ounce. Based on macro assumptions, analysts predict that the gold price may reach 3,850 USD/ounce in the second quarter of 2026 and the current period is like "compressing the spring" - preparing for a strong increase in gold prices in the near future.
Meanwhile, Citigroup (a US multinational financial group) has just raised its forecast for world gold prices to $3,500/ounce in the next 3 months, $3,300/ounce for 6-2025, $3,300 - $3,600/ounce. The main reasons include concerns about US economic growth, high inflation due to US President Donald Trump's tariff policy and a weakening USD.
"Gold on Fire! Smart Money Bulls Aiming for Final Target🟡 "Gold on Fire! Smart Money Bulls Aiming for Final Target
Overview:
The XAUUSD chart presents a clear smart money structure, showing a bullish recovery from a strong demand zone and a current move toward a significant supply (resistance) area.
🔍 Key Technical Highlights:
Strong Support Zone
The price reacted powerfully from the well-marked strong support zone (~3,260), aligned with a previous Bullish Fair Value Gap (FVG) and BOS (Break of Structure), confirming bullish intent.
Bullish Market Structure
A clean CHoCH (Change of Character) confirmed the end of the previous bearish leg.
Multiple BOS followed, solidifying the bullish shift in momentum.
Liquidity Grab & Price Expansion
Price swept equal lows (EQL) and mitigated bullish FVG, collecting sell-side liquidity before reversing.
The breakout pushed toward the current level of ~3,380, targeting the Buy-Side Liquidity zone and resistance.
Resistance & Fair Value Gap
The final target is aligned at 3,427.83, situated inside a high-probability bearish FVG and resistance zone.
This area previously rejected price (noted with the red circle), making it a critical supply zone.
Partial Target Hit
Price has already achieved half of the projected move, indicating bullish strength and proper SMC execution.
The current consolidation near the mid-level suggests accumulation or re-accumulation before a final push toward the target.
📈 Educational Notes:
Fair Value Gaps (FVG) highlight inefficiencies in price delivery. These zones often act as magnets for price and reversal points, as seen here.
Break of Structure (BOS) and Change of Character (CHoCH) are crucial for identifying trend shifts. This chart reflects a textbook bullish transition.
Liquidity concepts (EQL, Buy-Side) emphasize institutional behavior. Price often hunts liquidity before moving to new highs or lows.
✅ Conclusion:
XAUUSD is playing out a well-structured bullish smart money setup, with price currently in mid-path toward the final target. Traders should monitor reactions at the 3,427 resistance zone, which will be critical for potential reversal or continuation scenarios.

Next movement is so critical The next movement of the gold will make the last decision , 1h fram above the 3352 will make the next target 3360/3380/3400
Be careful and chill !
Breaking the 3348 may see rejection on 3344 3340 as said in the morning ! Will follow up with it

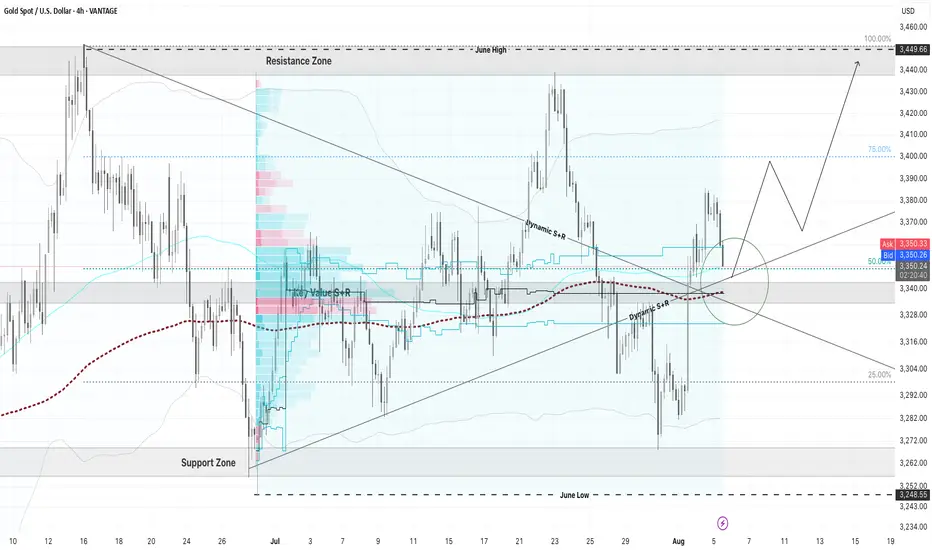
Gold Traders Pay Attention! Major Moves Incoming ? XAU/USD is setting up for a monster move — and all the signs are lining up! 👇
This is a perfect storm of technical confluence you don’t want to miss:
📊 After weeks of consolidation, gold has just broken out of a downtrend, retested the zone, and is now sitting on a major decision point. This zone is packed with:
✅ A dynamic trendline flip (was resistance, now acting as support)
✅ 200 EMA cushioning the retest
✅ 50% Fibonacci retracement aligning perfectly
✅ High-volume node from the volume profile = big player interest
✅ Mid-Bollinger Band offering bounce potential
✅ Strong bullish market structure forming
All eyes are on this green circle zone— a critical battle between bulls and bears. If bulls win here, we could see a powerful move straight into the upper resistance zone, possibly breaking previous June highs! 🦍💥
This is what smart money setups look like — multiple confirmations, clean structure, and asymmetric reward potential. 🔑📈
Tag a gold trader who needs to see this, and drop a ⚡️ if you're locked in on this breakout setup!
VANTAGE:XAUUSD FOREXCOM:XAUUSD EIGHTCAP:XAUUSD
Gold Breaks Support – Risk of Pullback Toward $3,310📊 Market Summary:
Gold prices initially rose on weaker-than-expected U.S. jobs data, which lowered Treasury yields and weakened the U.S. dollar. However, after breaking the key support at $3,365, gold continued to decline toward $3,354, and briefly touched $3,352, signaling rising technical selling pressure. Despite a 92% market expectation for a Fed rate cut in September, the technical breach increases the risk of a deeper correction.
📉 Technical Analysis:
• Key Resistance: Around $3,365–$3,370 – this zone now acts as short-term resistance; stronger resistance lies at $3,375–$3,380 if prices recover.
• Nearest Support:
The $3,365 level was broken.
New support is seen at $3,352–$3,350; a continued drop may bring prices to $3,335, and possibly toward $3,310–$3,300.
• EMA 09: Price is now below the 9-day EMA, suggesting a short-term bearish trend.
• Momentum / Volume / Candlestick:
RSI is near 50, slightly bearish; volume is tapering on the downside, indicating distribution.
Early signs of a head-and-shoulders (H&S) pattern are developing.
📌 Outlook:
Gold may continue declining in the short term if it stays below the $3,350–$3,352 zone.
A further drop toward the $3,335 – $3,310 region is possible.
If price rebounds and closes above $3,365, the bearish momentum could be neutralized.
💡 Suggested Trade Strategy:
🔻 SELL XAU/USD : $3,355–$3,358
🎯 TP: 40/80/200 pips
❌ SL: ~$3,361
🔺 BUY XAU/USD : $3,305–$3,302 (if price pulls back deeper)
🎯 TP: 40/80/200 pips
❌ SL: ~$3,299

BUY XAUUSD 5.8.2025Confluence order: BUY at M15
Type of order: Limit order
Reason:
- The current top is not touching anything, expected to rise to the H1 above.
- M15~FIBO 0,5-0,618 (same position)
Note:
- Management of money carefully at the last bottom (3,370)
Set up entry:
- Entry buy at 3,364
- SL at 3,360
- TP1: 3,370 (~1R)
- TP2: 3,383 (~4R)
- TP3: 3,391 (~6R)
Trading Method: Price action (No indicator, only trend and candles)

Gold Extends Gains as USD Weakens📊 Market Overview:
Gold prices are extending their gains during the Asian and European sessions today, as the US dollar weakens following weaker-than-expected US jobs data. Rising unemployment and a softer Non-Farm Payroll report boosted expectations that the Fed may cut interest rates in September. The US 10-year Treasury yield also dipped slightly, supporting gold's safe-haven appeal.
📉 Technical Analysis:
• Key Resistance: $3,385 – $3,390
• Nearest Support: $3,365 – $3,370
• EMA: Price is trading above the EMA 09, indicating a short-term bullish trend
• Candles / Volume / Momentum: H1 candles show steady buying pressure with stable volume, but we should monitor potential profit-taking if price nears the $3,390–$3,400 zone.
📌 Outlook:
Gold may continue to rise in the short term if USD weakness persists and bond yields stay low. However, failure to break above $3,390 could lead to a pullback toward support levels.
💡 Suggested Trading Strategy:
🔺 BUY XAU/USD: $3,365 – $3,368
🎯 TP: 40/80/200 pips
❌ SL: $3,362
🔻 SELL XAU/USD : $3,392 – $3,395 (if reversal signal appears)
🎯 TP: 40/80/200 pips
❌ SL: $3,398

GOLD is Flying High, I won't miss the rocketConfirmation:
If 4H price action closes above Previous Day's High (PDH), I will be looking for longs.
Within my Area of Opportunity (AoO), I have outlined targets with their success rate.

XAUUSD 30M Range Trap Holding, But Will Bulls Break Above $3366Gold is currently trading within a well defined intraday range, with clear resistance around $3,366.36 and support near $3,339.78. After a strong initial move, price action has stalled, reflecting indecision and balanced order flow between buyers and sellers.
The market now approaches a key inflection point:
→ A confirmed 30 minute candle close above $3,366.36 would signal potential bullish continuation, with immediate targets at $3,368.99 and $3,371.11
→ Conversely, a close below $3,339.78 may trigger a downside move toward $3,331.66, followed by $3,328.21
Momentum remains neutral within the range, and any premature entries carry increased risk of whipsaw. Patience is essential, a clean breakout with structure and volume confirmation will offer higher probability trade setups.
This remains a rangebound environment until proven otherwise. Breakout traders should stay alert, but disciplined.
#XAUUSD #Gold #TechnicalAnalysis #PriceAction #SupportResistance #BreakoutWatch #MarketStructure #30mChart

Chart Type:* XAUUSD (Gold) – 15 min chart Pattern:AscendingHere’s a simpler breakdown with highlights:
---
*🟡 Chart Type:* XAUUSD (Gold) – 15 min chart
*📊 Pattern:* *Ascending Bullish Triangle*
---
*🔹 Key Highlights:*
- *Orange Line:* Rising *support* (buyers pushing price up)
- *Purple Zone:* Strong *resistance* area (price keeps rejecting)
- *Blue Arrow:* Suggesting a *breakout* to the upside
- *White Path:* Expected *price movement* if breakout happens
---
*🎯 Target Zone (Green Area):*
Where price may go if breakout is successful
*🛑 Stop-Loss Zone (Red Area):*
Where to exit trade if breakout fails
---
📝 Simple Explanation:*
Price is going up slowly and getting squeezed. If it breaks above the purple line, a *strong bullish move* is expected.
