GOLD is Flying High, I won't miss the rocketConfirmation:
If 4H price action closes above Previous Day's High (PDH), I will be looking for longs.
Within my Area of Opportunity (AoO), I have outlined targets with their success rate.
GOLD trade ideas

XAUUSD 30M Range Trap Holding, But Will Bulls Break Above $3366Gold is currently trading within a well defined intraday range, with clear resistance around $3,366.36 and support near $3,339.78. After a strong initial move, price action has stalled, reflecting indecision and balanced order flow between buyers and sellers.
The market now approaches a key inflection point:
→ A confirmed 30 minute candle close above $3,366.36 would signal potential bullish continuation, with immediate targets at $3,368.99 and $3,371.11
→ Conversely, a close below $3,339.78 may trigger a downside move toward $3,331.66, followed by $3,328.21
Momentum remains neutral within the range, and any premature entries carry increased risk of whipsaw. Patience is essential, a clean breakout with structure and volume confirmation will offer higher probability trade setups.
This remains a rangebound environment until proven otherwise. Breakout traders should stay alert, but disciplined.
#XAUUSD #Gold #TechnicalAnalysis #PriceAction #SupportResistance #BreakoutWatch #MarketStructure #30mChart

Chart Type:* XAUUSD (Gold) – 15 min chart Pattern:AscendingHere’s a simpler breakdown with highlights:
---
*🟡 Chart Type:* XAUUSD (Gold) – 15 min chart
*📊 Pattern:* *Ascending Bullish Triangle*
---
*🔹 Key Highlights:*
- *Orange Line:* Rising *support* (buyers pushing price up)
- *Purple Zone:* Strong *resistance* area (price keeps rejecting)
- *Blue Arrow:* Suggesting a *breakout* to the upside
- *White Path:* Expected *price movement* if breakout happens
---
*🎯 Target Zone (Green Area):*
Where price may go if breakout is successful
*🛑 Stop-Loss Zone (Red Area):*
Where to exit trade if breakout fails
---
📝 Simple Explanation:*
Price is going up slowly and getting squeezed. If it breaks above the purple line, a *strong bullish move* is expected.

Gold XAUUSD Weekly Analysis 4-8 August 2025XAUUSD Weekly Outlook (SWING)
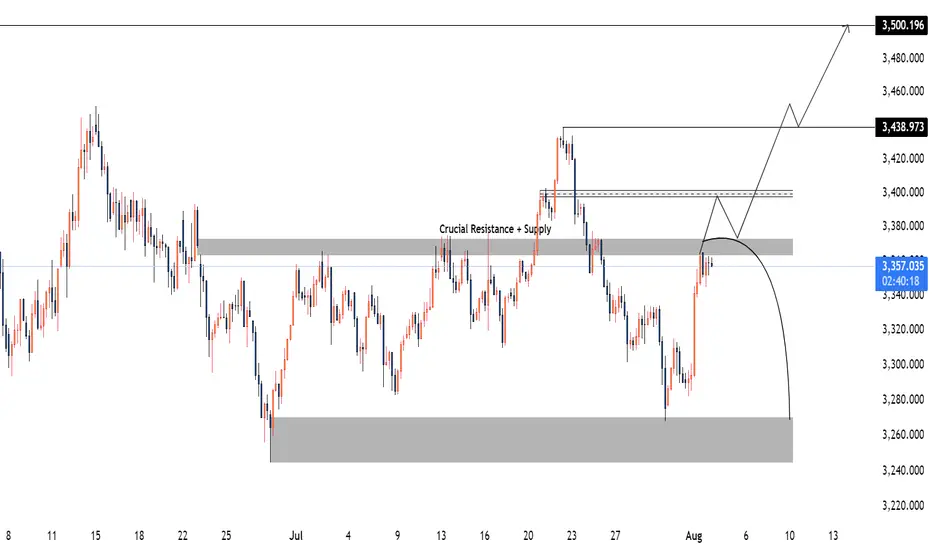
Price is currently approaching a crucial resistance and supply zone between 3363 – 3373. This area has historically acted as a strong rejection point and remains a significant decision level for upcoming market direction.
Bullish Scenario:
If price breaks and closes above the 3363–3373 zone and later retests it successfully—potentially around the 3400 level—this would indicate a bullish market structure shift. A strong reaction from the retest could open the path toward 3438, with a possible extension to 3500.
Bearish Scenario:
Alternatively, a rejection from the 3363–3373 supply zone without a confirmed breakout would likely trigger a downside move, targeting the lower demand area near 3250.
This 3363–3373 zone remains the key pivot. Watch for price action confirmation to validate either scenario.
04/08/25 Gold Swing LevelsBack to Gold but with daily swing levels.
Monday 04/08/25 levels are marked; depending on if market opens with a gap, price should continue upwards.
Trade parameters
Entry on 5 min chart
Sl: 30-50pips
TP: 2-4x SL

Nonfarm Pay Attention Zone✏️ OANDA:XAUUSD is recovering and increasing towards the resistance zone of yesterday's US session. The 3315 zone is considered a strategic zone for Nonfarm today. A sweep up and then collapse to the liquidity zone of 3250 will be scenario 1 for Nonfarm today. If this important price zone is broken, we will not implement SELL strategies but wait for retests to BUY. It is very possible that when breaking 3315, it will create a DOW wave with the continuation of wave 3 when breaking the peak of wave 1.
📉 Key Levels
SELL trigger: Reject resistance 3315.
Target 3250
BUY Trigger: Break out and retest resistance 3315
Leave your comments on the idea. I am happy to read your views.

Bullish
Description
Hi traders
I think after the fake break that happened last week at 3280, we should be ready to move higher with a target of 3430-3450 and if the fundamentals are impressive, even a break of the previous high.
Of course, the resistance zone of 3385-3405 is in the way of the price.
I hope that the analysis I am providing is accurate and effective.
Possible positions this week
A:Suitable prices for BUY positions
1)3345-3340
2)3174-3150
B:Suitable prices for SELL positions
1)3385-3405(Of course, with approval from the market and the type of candles)
This is just an analysis and everyone is responsible for their own work.
Hoping for a good and profitable week.

XAUUSD Gold Trading Plan – Monday, 4th August 2025Strategy Type: Intraday / Short-term swing
Bias: Bullish (Buy-the-dip)
Methodology: Price Action + Fibonacci Retracement + Momentum Confirmation
Key Zones: 3366, 3377, 3388
Market Overview
As we head into Monday, 4th August, Gold (XAUUSD) remains in an overall uptrend, supported by bullish macro sentiment driven by weakening USD strength and ongoing uncertainty in global risk assets. Despite last week’s slight pullback, the structure still supports a continuation pattern, especially above the 3350 support region.
The previous week closed with a higher low formation, and current price action shows a healthy retracement rather than a reversal. We anticipate that Gold will respect key Fibonacci retracement levels and rally in phases, allowing for multiple entries and scaling opportunities.
🔍 Trading Plan Summary
✅ Step 1: Buy on Retracement to 3366 (1st Target Area)
Entry Zone: Around 3366
Reasoning: This level is a confluence zone — minor support from Friday’s breakout, aligning with intraday Fibonacci retracement (~38.2% pullback from recent swing low to high).
Confirmation: I’ll look for bullish candle confirmation on 15m/30m chart (e.g., bullish engulfing, pin bar, or strong rejection wick) before entering.
Stop Loss: Below 3356 (previous swing low / invalidation level)
🎯 Target 1: 3377
This will be the first take-profit zone after price reaches the next resistance / previous order block zone.
I will secure partial profits here and trail SL to entry or +5 to lock in risk-free trade.
✅ Step 2: Wait for Retracement Again (Post-3377 Pullback)
If price pulls back after hitting 3377, I’ll wait for the new higher low to form — ideally somewhere between 3370–3373.
I’ll re-enter long with confirmation, targeting the next key level.
🎯 Target 2: 3388
This level is the next visible resistance on 1H/4H structure and may trigger profit-taking or reversal pressure.
I plan to close the majority of my position here unless price shows strong breakout momentum.
⚠️ Risk Management Notes
Maximum total exposure: 1.5% of account (0.5% per trade entry)
All trades will have a defined SL; no averaging down.
Avoid entering if price gaps up directly above 3377 on Monday open — in that case, I’ll reassess structure and wait for new retracement levels.
🛠 Tools to Watch
DXY (Dollar Index): If DXY weakens further below 104.50, this supports the bullish Gold thesis.
US Bond Yields: Any decline in yields also gives bullish pressure on Gold.
Volume & RSI Divergence: For entry and exit confidence.
News Risk: Keep an eye on any surprise geopolitical tensions or Fed commentary, though major data events are limited on Monday.
🔁 Summary of Execution Plan
First Buy Entry: 3366 → TP1: 3377
Second Buy Entry (on retracement): ~3371 → TP2: 3388
SL Discipline: Below swing structure, never moved unless TP1 hits.
Profit Securing: Partial at 3377, majority at 3388
Trade Review: At EOD, whether plan was followed or not

**#XAUUSD H5 Higher Timeframe Analysis**
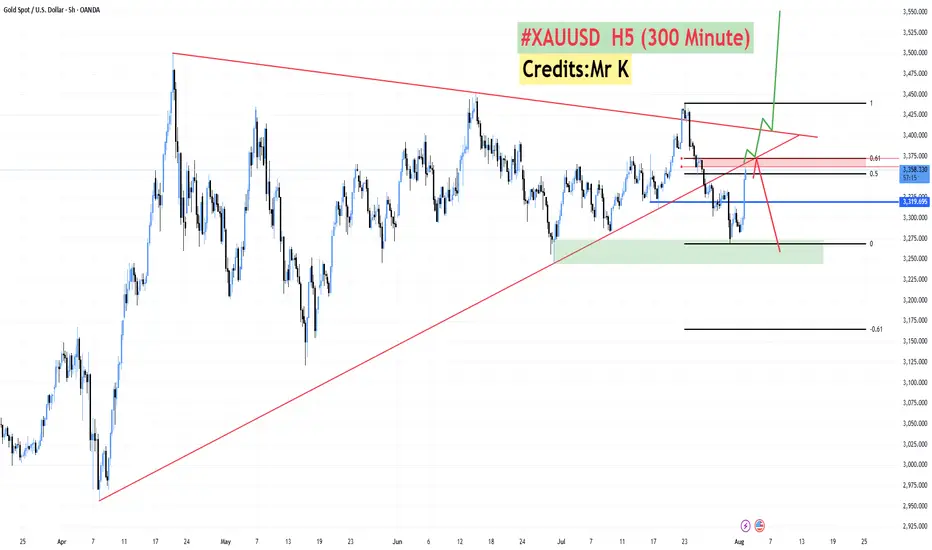
📊 **#XAUUSD H5 Higher Timeframe Analysis**
What we witnessed today was a **tremendous recovery in Gold 🟡** after **3–4 consecutive bearish sessions 📉**.
📅 **Today’s candle** has **completely flipped the weekly structure**, turning a fully **bearish weekly candle into a bullish one 📈** — thanks to the **NFP data** that came in **favor of Gold and against the Dollar 💵❌**.
🔍 However, price is now approaching a **critical confluence zone**:
* 🧭 A **long-running trendline** (since April)
* 🔴 An **H4 Bearish Order Block**
* 📐 The **Fibonacci Golden Zone (0.50–0.618)** at **3362–3372**
📌 **From this level, we have two possible scenarios:**
1️⃣ **Sharp Rejection 🔻:**
Price may **reverse sharply** from the 3362–3372 zone and **resume the bearish trend**.
2️⃣ **Breakout & Trap Theory 🔺:**
If price **sustains above this zone**, it may signal that the recent **3–4 day drop was a fake breakdown**, designed to **trap sellers** and grab liquidity for a **further upside move**.
✅ **Confirmation will come if we get an H4–H6 bullish candle close above the trendline** and back inside the **buying zone of 3375–3390**.
🔓 **A breakout above the triangle pattern** will likely lead to a **strong bullish continuation 📈🚀**.
"Gold at Crucial $3,407 Resistance — Breakout or Reversal Ahead?Technical Analysis (H4 Chart)
Trend Structure
Price is moving inside an ascending channel (black lines).
Currently testing the mid-upper zone of the channel, near $3,400–$3,407 resistance.
Key Levels
Support: $3,380 / $3,340 / $3,300
Resistance: $3,407 / $3,486 / $3,544
Major psychological support at $3,244.
Patterns
Blue arrows mark previous strong rejections from the same resistance zone, suggesting sellers are active there.
Two scenarios drawn:
Bullish breakout → Break above $3,407, retest, then target $3,486–$3,544.
Bearish rejection → Fail at $3,407, break below $3,380 → target $3,300–$3,280 zone.
Trading Bias
Inside the channel → buyers have slight control.
Break below channel → momentum shifts bearish.
Fundamental Analysis
Bullish Factors for Gold:
US Economic Slowdown: Any weak US data (CPI, job numbers) increases the chance of Fed rate cuts → boosts gold.
Geopolitical Risks: Ongoing global tensions keep safe-haven demand strong.
Central Bank Buying: Several emerging market central banks are increasing gold reserves.
Bearish Factors for Gold:
Strong US Dollar: If upcoming US data is strong, USD gains → gold drops.
Rising US Yields: Higher bond yields reduce gold’s appeal.
Risk-On Sentiment: Stock market rallies can pull funds out of gold.
Outlook
Above $3,407 with strong volume → likely bullish toward $3,486 and possibly $3,544.
Failure at $3,407 and break below $3,380 → short-term bearish toward $3,300.
Fundamental triggers will likely be US CPI data and Fed rate outlook in the coming week.

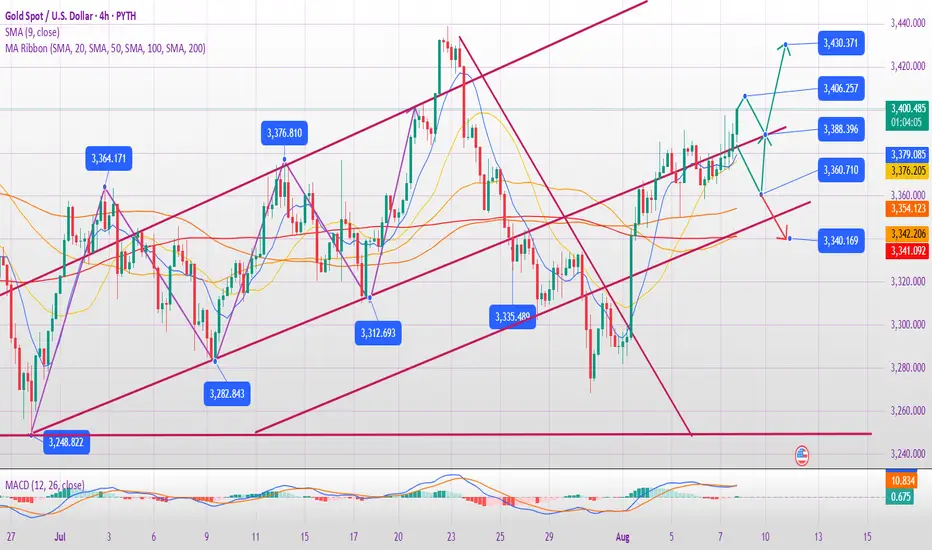
XAUUSD – HTF structure points to higher TPLooking at the higher timeframe structure, this 4H move is aligning perfectly with bullish momentum. Even if we see a pullback, it’s likely just a retest for continuation — not a full reversal.
Key points:
• HTF bias: Bullish, with room beyond local 3,440 resistance
• Pullback zones: 3,377 / 3,361 — both valid re-entry levels if retested
• Targets: First watch 3,508, but HTF suggests we can push higher
• Plan: Stay patient, treat dips into structure as opportunities to stack buys
Bigger picture remains bullish until HTF structure breaks.

Will gold successfully break through 3400 on August 8th?
I. Daily Analysis
Overall Trend: Gold remains at the end of a converging triangle, with upper resistance at 3406 and lower support at 3360, awaiting guidance on the direction of a breakout.
Key Moving Average: The 5-day moving average at 3372 remains a short-term bullish-bearish watershed. If it holds above this level, the market will likely remain volatile and bullish. If it breaks, a pullback to 3360 or even lower is possible.
K-line Pattern: Wednesday's daily close was a small bearish candlestick, but the upward trend was not broken. Thursday's Asian session saw a high of 3398 before retreating, indicating psychological pressure at the 3400 level.
II. 4-Hour and Short-Term Analysis
Support and Resistance:
Key Support: 3370-3373 (61.8% retracement level), 3365 (morning low, bullish defensive level).
Key Resistance: 3398-3400 (psychological barrier), 3406 (upper limit of the triangle). Technical Indicators:
MACD is still in a correction phase, requiring short-term volatility to digest momentum.
The 4-hour middle line at 3371-72 resonates with the daily 5-day moving average. If the price stabilizes at this level during the European session, there is still potential for an upside move in the US session.
III. Today's Trading Strategy
1. Long Strategy (Primarily Buy on Dips)
Entry Point: If the price stabilizes after a pullback to 3370-3373, try a small buy position with a stop-loss below 3365.
Target: 3395-3400. A breakout could target 3406 or even higher.
2. Short Strategy (Approach with caution)
If the price falls below 3365, it could weaken. Short-term short positions could be targeted at 3360-3350.
If the suppression at 3406 is effective, you can try shorting, with a stop loss above 3410 and a target at 3390-3380.
3. Breakout Strategy
If the price breaks above 3406, follow the trend and buy long positions, targeting 3420-3430. Breaking below 3360: It may open up downward space, with the target at 3340-3330.
IV. Key Timeframes
European Market Trend: If 3370 holds, a second surge higher is possible in the US market; if pressure persists at 3398, a pullback to 3370-3365 is possible.
Focus on the US market: US economic data and the trend of the US dollar. If the US dollar continues to be weak, gold may be supported.
V. Risk Warning
Currently at the end of the triangle, be wary of false breakouts. It is recommended to operate with a light position and maintain strict stop-loss orders.
If 3365 falls, adjust your strategy to avoid blindly bottom-fishing.
Gold consolidates ahead of growthGold has encountered strong resistance and excessive pressure from bears. Before continuing its growth, the price may test the local trend support or the support zone of 3371–3358.
Scenario: bullish trend, but the price lacks the potential and consolidation to overcome resistance at 3400-3410. In this case, MM may form a trap to collect liquidity, such as a false breakdown of support, and only then move up.

XAUUSDXAU/USD Bullish Bias — Price is rebounding strongly from a key demand zone, with higher lows confirming sustained buying pressure. As long as the demand zone holds, the bias stays bullish, with momentum favoring a move toward the next resistance. Watch for confirmations during London and New York sessions, as gold typically reacts strongly in these hours.

XAU / USD 30 Minute ChartHello traders. We had news earlier, and I am currently looking for scalp positions. I marked my areas of interest on the chart. Looking to grab some pips while we have volume happening. I will update in a bit. Big G gets my thanks. Be well and trade the trend.

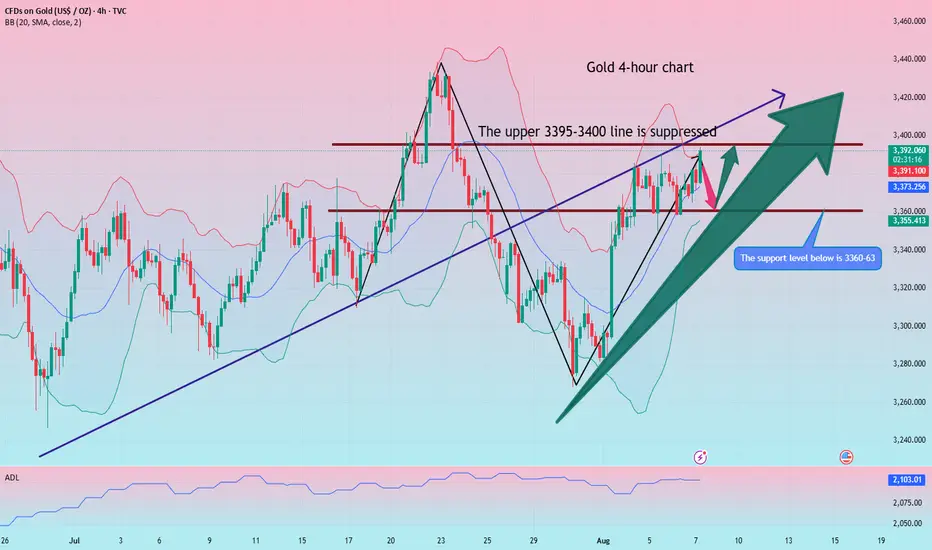
Gold range fluctuates, continue to be bullish after falling back
Yesterday, gold prices initially declined before rising, continuing the previous day's deep V-shaped rebound pattern. Prices came under pressure at 3378 in the Asian and European sessions, weakening and fluctuating downward. The European session continued its downward trend, breaking through 3360 to reach around 3358 before stabilizing and recovering. In the US session, bullish momentum continued to rebound, breaking through 3380 before falling back under pressure and weakening. The price finally closed around 3367, closing in a mid-yin-yang pattern of volatile adjustment. Overall, gold prices retreated again to test support near 3360, effectively establishing a wide range of bullish and bearish fluctuations in the short term. Further gains are expected today, challenging above 3390. However, given the recent volatile pattern of gold prices, it's not advisable to chase gains or sell losses in the short term. If your current trading is not ideal, I hope Yulia can help you avoid investment pitfalls. We welcome your communication.
According to the 4-hour chart, support is currently focused around 3365-60, while resistance is expected around 3395-3400. We should maintain a high-short-low-buy cycle within this range. In the intermediate range, we should be cautious in following orders and patiently wait for key entry points. I will provide detailed trading strategies during the trading session, so please stay tuned.
Gold Trading Strategy:
Go long on gold if it retraces to the 3360-65 level, with a stop loss at 3353 and a target of 3390-3395. Continue holding if it breaks below this level.
XAUUSD Gold Intraday 07 Aug (Short) XAUUSD Intraday Setup
Short Setup in between 3382–3392 Resistance
Price is approaching a key supply zone between 3382 and 3392, where previous equal highs were swept. This area may act as a reversal zone.
Looking for bearish confirmation within this range to initiate short positions.
Stop Loss: 3397
Target: Previous swing lows around 3352–3355
Bearish bias remains valid as long as price stays below 3397.

Will Gold Make a New High Amid Prospect of Sep Fed Rate Cut?Fundamental approach:
- Gold gained this week, supported by renewed trade tensions following new US tariffs on major partners and rising expectations of a Fed rate cut in Sep.
- Safe-haven demand strengthened after weak US NFP data heightened concerns about economic growth and reinforced market bets on monetary easing, while US President Trump's tariff announcements drove risk aversion.
- Comments from Fed officials signaled openness to policy adjustments, keeping investors focused on future rate moves even as the US dollar softened and global equities stabilized.
- XAUUSD could remain resilient if upcoming US labor and inflation data continue to disappoint.
Technical approach:
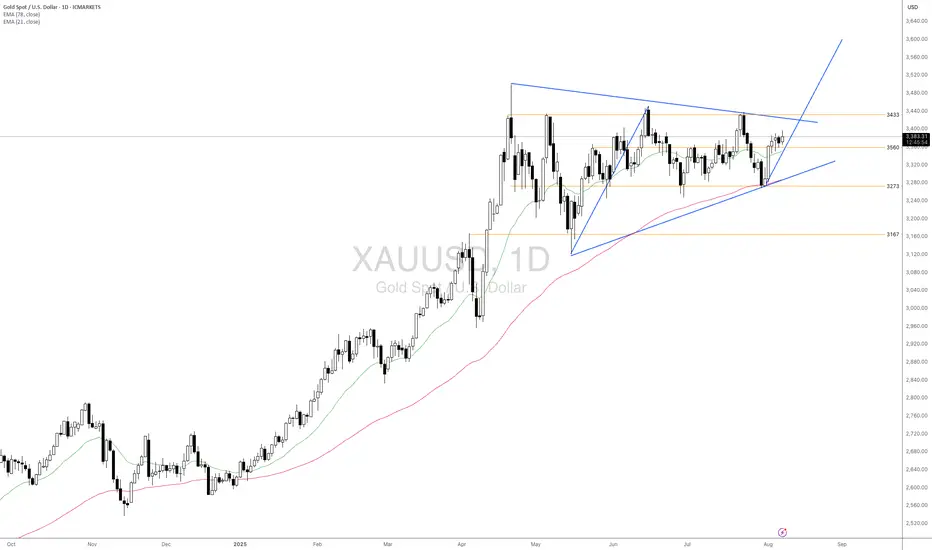
- XAUUSD fluctuates within a broad range. The price is forming a big Triangle Formation, awaiting an apparent breakout to determine the next movement.
- If XAUUSD breaches above the Triangle Pattern and the resistance at 3433, the price may continue to advance with the measured target at 3600.
- On the contrary, closing below support at 3560 may prompt XAUUSD to continue range-bound movement by retesting support at 3273.
Analysis by: Dat Tong, Senior Financial Markets Strategist at Exness
The bullish trend remains unchanged, seize the opportunityAfter today's opening, gold continued the bullish trend of yesterday. Judging from the daily line, gold has continued to rise, and it may only be a matter of time before it reaches a higher level. Judging from the 4H chart, the technical indicators are dead cross and shrinking, and the flexible indicators are repairing upward. The short-term middle track support is around 3372, and the upper side pays attention to the short-term pressure of 3395-3405. If the European session fails to effectively break through the short-term resistance, it will give the opportunity to test the 3380-3370 support again. If it is not broken, you can consider continuing to go long.
OANDA:XAUUSD

GOLD TRADE ANALYSIS – MISSED ENTRY & NEW OUTLOOK📈 GOLD TRADE ANALYSIS – MISSED ENTRY & NEW OUTLOOK 💡
07 August 2025 | XAUUSD | 15m TF
In the recent price action on Gold, I spotted a clean mSS (market structure shift) confirming bearish intent after liquidity sweep. Unfortunately, my first ideal entry near the supply zone was missed as price barely tapped the POI before delivering a significant drop.
However, the market offered a second chance — forming another bearish order block before diving into the discounted zone (demand area). This ultimately led to a strong bullish reaction, confirming accumulation and paving way for the rally we've just seen.
🔍 Current Expectation:
Price has now cleared internal liquidity and is pushing toward $3,396 — an important external liquidity level. I'm watching for:
A possible reaction/rejection from this high
Or a clean break and retest for continuation to $3,410+
🧠 Lesson:
Always remember, missed entries are part of the game. The key is not chasing — but re-aligning with the structure and waiting for fresh confirmations. Gold continues to respect key imbalances and reacts well around session opens.
📊 Let’s see how price reacts around this high. Any signs of weakness could offer a new intraday short opportunity.
#XAUUSD #GoldAnalysis #SmartMoneyConcepts #OrderBlocks #MarketStructure #ForexTrading #LiquiditySweep #TradingPsychology #RiskManagement #PriceAction #ForexNigeria #GoldTraders #FXSetup

XAUUSD rises due to tariff wars and weak economic dataXAUUSD rises due to tariff wars and weak economic data
Gold climbed to 3,380.00 level on August 7, hitting a two-week high, as renewed U.S. tariff threats and expectations of Federal Reserve rate cuts in September and December boosted its appeal. President Trump announced 100% tariffs on imported semiconductors (excluding U.S.-made), 25% on Indian imports, and 50% on select Brazilian goods. Additionally, Weak U.S. economic data and a cooling labor market further support gold’s rise.
Technically, price has formed the Pennant chart pattern right below the local resistance of 3,380.00. Further breakout of the level and ascending towards 3,440.00 level is expected in short-term.

Gold Intraday Trading Plan 8/7/2025Gold is trapped in a range from 3357 to 3385 right now. I will look for trading opportunity upon breaking of the resistance or support.
If 3385 resistance is broken, I will buy toward 3417.
If 3357 support is broken, I will sell toward 3315.
The market trend is still there, go long on the pullback#XAUUSD
Yesterday, gold experienced a V-shaped reversal: it was blocked at the 3382 line in the morning and then fluctuated and fell, then it fell to the support near 3349 and stabilized and rebounded, then rebounded to near 3390 in the evening and closed with a doji on the daily line. Judging from the overall trend, the bullish pattern has not changed.
Gold has limited room for decline in the short term, and a sharp drop is unlikely. Today's market tends to adjust and correct first before continuing to rise. The adjustment is only short-term, and is more to give everyone enough opportunities to get on board. The focus of the market below is 3375-3360, with the target looking at yesterday's high around 3390-3395. A break is expected to extend to the 3400-3420 area.
🚀 BUY 3375-3360
🚀 TP 3390-3395
