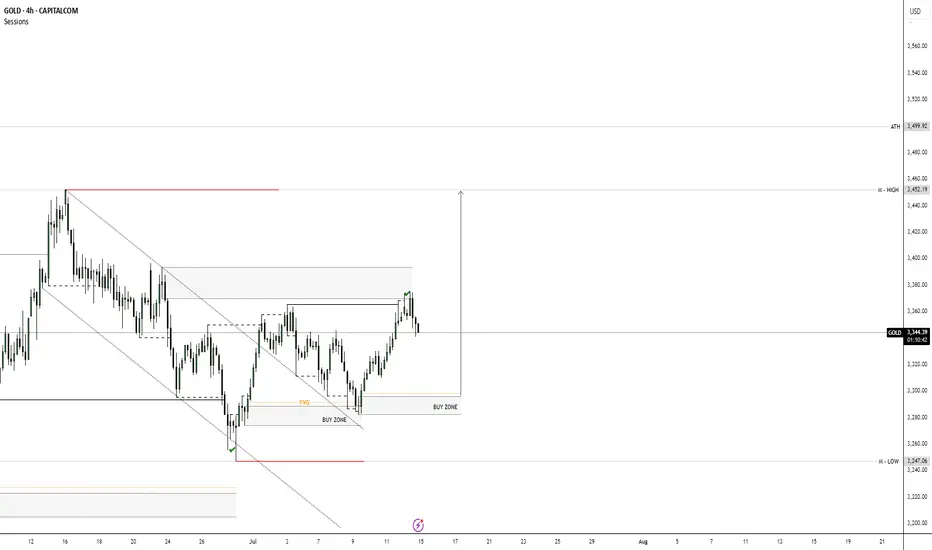
XAUUSD ANALYSYS 💸GOLD💸
Market Outlook: Bullish
• Price broke out of a downtrend channel and is now forming higher highs and higher lows — clear sign of a trend reversal.
• Current move is a pullback after a strong push up.
⸻
📍 Key Zones:
• Buy Zones and Fair Value Gaps (FVGs) are marked.
• These are areas where buyers may step in again.
• Price is pulling back into these zones — potential long entry area.
⸻
🎯 Target:
• The top red line marks a liquidity zone or resistance.
• Price is likely aiming to reach this area next.
⸻
📈 Trade Setup Idea:
• Buy on pullback to the FVG / Buy Zone.
• Stop Loss: Below the Buy Zone.
• Take Profit: At the previous high (resistance zone).
⸻
⚠️ Risk to Watch:
• If price breaks below the Buy Zone, bullish setup is invalidated — wait for new structure.
GOLD trade ideas
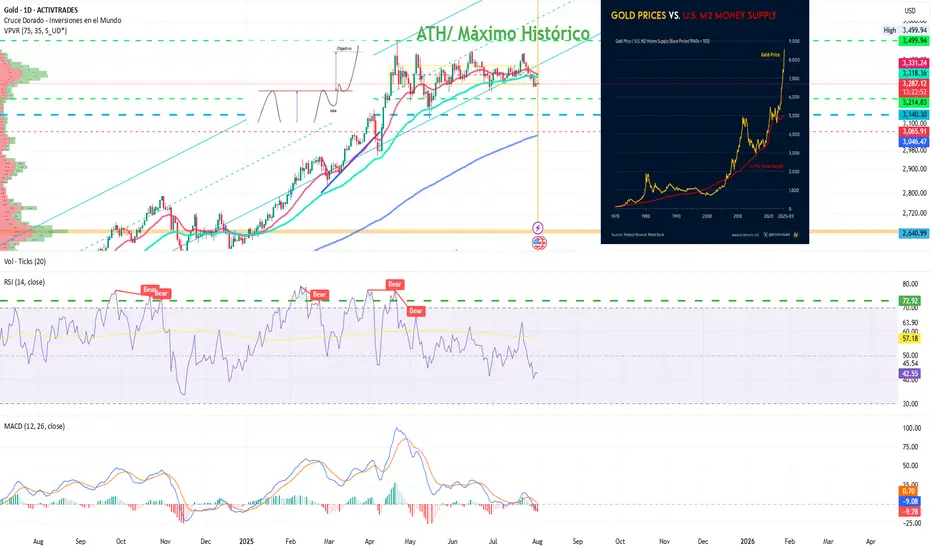
Gold: Are the Bulls Still Behind It?Ion Jauregui – Analyst at ActivTrades
Fundamental Analysis
In 2025, gold has appreciated around 27% year-to-date, reaching a peak of 33.37% at the end of April, driven by structural factors. Its strength is based on global de-dollarization, central bank purchases, persistent inflation, and expectations of real rate cuts in the U.S. Since real interest rates peaked in July 2023, gold has risen 74%, reinforcing its role as a hedge against monetary policy.
In addition, countries like China and Russia continue to accumulate gold as protection against the dollar and potential sanctions, supporting long-term structural demand. Diversifying with physical and financial gold (ETFs, mining stocks) is an increasingly common strategy in an environment of high debt, geopolitical tensions, and doubts about traditional safe-haven assets. A suggested allocation in a classic model portfolio could range between 10% and 25%, depending on the risk profile, in a typical equity-focused investment portfolio.
Technical Analysis
From a technical standpoint, gold has completed a long-term “cup with handle” formation that began in 2012, with an upside projection toward the $4,000 per ounce area. This pattern supports the continuation of its long-term upward structure.
In the short term, however, the price is in a consolidation phase after reaching all-time highs of $3,499.94 at the end of April. Since then, the lateral movement suggests a pause within the primary trend.
Technical indicators are showing mixed signals: RSI and MACD are pointing toward a possible oversold condition, suggesting a risk of short-term correction. Additionally, a bearish crossover between the 50-day and 100-day moving averages may reinforce selling pressure.
If this corrective scenario unfolds, gold could retrace toward a key support zone around $3,140, a level that has served as the base of the current range and where renewed buying interest could emerge.
Despite a possible pullback, the broader technical outlook remains constructive. Any correction would likely present tactical opportunities to re-enter the market—especially if expectations of real rate cuts or global geopolitical tensions persist.
Gold Consolidates After Highs
All in all, despite potential short-term pullbacks, gold continues to offer value as a tool for diversification, wealth protection, and a hedge against systemic risks. Its inclusion in portfolios remains relevant, even at current levels.
*******************************************************************************************
The information provided does not constitute investment research. The material has not been prepared in accordance with the legal requirements designed to promote the independence of investment research and such should be considered a marketing communication.
All information has been prepared by ActivTrades ("AT"). The information does not contain a record of AT's prices, or an offer of or solicitation for a transaction in any financial instrument. No representation or warranty is given as to the accuracy or completeness of this information.
Any material provided does not have regard to the specific investment objective and financial situation of any person who may receive it. Past performance and forecasting are not a synonym of a reliable indicator of future performance. AT provides an execution-only service. Consequently, any person acting on the information provided does so at their own risk. Political risk is unpredictable. Central bank actions can vary. Platform tools do not guarantee success.
GoldGold Giving pulllback and then again go sell this time target is 3247..if this level breaks and any close below h4 it will further downside


Gold (XAU/USD) Analysis:Following yesterday's Fed statements regarding the economic impact of tariffs and the decision to keep interest rates unchanged, gold prices dropped to $3,268, before rebounding today to retest the $3,310 zone. The short-term trend remains bearish.
1️⃣ A break and hold below $3,300 may push the price toward $3,280, and potentially $3,260.
🔻 A confirmed break below $3,260 could lead to a deeper decline toward a strong support zone near $3,245.
2️⃣ On the other hand, if bullish momentum appears and the price breaks above $3,310, it may open the path to $3,330 — a key level that could trigger a bearish rejection.
📈 However, if the price holds above $3,330, the next target would be $3,350.
⚠️ Disclaimer:
This analysis is not financial advice. It is recommended to monitor the markets and carefully analyze the data before making any investment decisions.

GOLD USDHI GUYS.
H4 CHART here we see on going buys for sculppers and scul [ping sells around the coner.
forcus on the big pictucture more distance more pips as soon as h4 ,h2,h1 forms a (DB)
DOUBLE BOTTOM then we make entries on long position buys to clear upper area(3400,3439).

GOLD Will Move Lower! Sell!
Here is our detailed technical review for GOLD.
Time Frame: 9h
Current Trend: Bearish
Sentiment: Overbought (based on 7-period RSI)
Forecast: Bearish
The market is testing a major horizontal structure 3,337.68.
Taking into consideration the structure & trend analysis, I believe that the market will reach 3,280.02 level soon.
P.S
The term oversold refers to a condition where an asset has traded lower in price and has the potential for a price bounce.
Overbought refers to market scenarios where the instrument is traded considerably higher than its fair value. Overvaluation is caused by market sentiments when there is positive news.
Disclosure: I am part of Trade Nation's Influencer program and receive a monthly fee for using their TradingView charts in my analysis.
Like and subscribe and comment my ideas if you enjoy them!

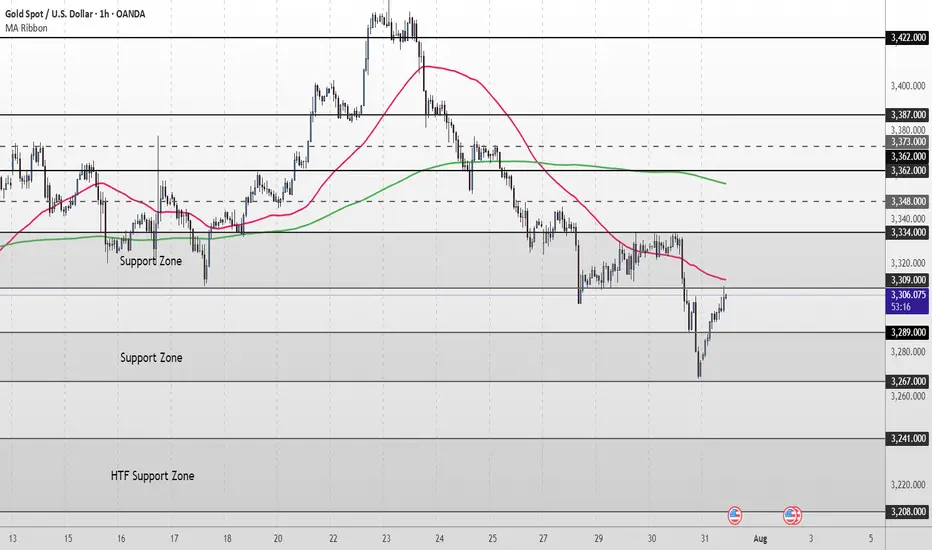
XAU/USD Intraday Plan | Support & Resistance to WatchGold staged a minor recovery overnight after bouncing from the 3,267 Support Zone, and is now trading around 3,305. Price remains below both the 50MA and 200MA, which continue to slope downward—confirming short-term bearish structure.
This current move is still corrective unless bulls manage to reclaim the 3,309–3,334 resistance zone. A clean break and hold above 3,334 would be the first sign of strength, opening up potential retests of 3,348 and 3,362.
Until then, any rallies into the 3,309–3,334 zone should be viewed with caution. If the bounce loses steam, watch for a retest of 3,289 - 3,267. A break below that would expose the 3,241 and 3,208 levels, with the HTF Support Zone (3,241–3,208) acting as a broader downside cushion.
📌 Key Levels to Watch
Resistance:
‣ 3,309
‣ 3,334
‣ 3,348
‣ 3,362
Support:
‣ 3,289
‣ 3,267
‣ 3,241
‣ 3,208
🔍 Fundamental Focus – Thursday, July 31
Big day for data.
🟥 Core PCE, Employment Cost Index, and Unemployment Claims — all critical for Fed outlook and could move gold sharply.
⚠️ Volatility expected around 2:30pm. Stay nimble and manage risk carefully.
GOLD (XAUUSD) Short IdeaGold is in consolidation right now. Possible break below and fall until 3285.
Good Luck!

gold has reach daily supportMomentum is still bearish however selling low is not advisable.
so there are certain point of interest that we want to look for as gold currently is at the support level. a strong one

Gold (XAUUSD) Breaks Trendline – Potential Downside Ahead?Gold (XAU/USD) has officially broken below a long-term ascending trendline on the 4H chart, indicating a potential shift in market structure. The recent breakout from a bear flag pattern confirms bearish momentum, and price is now approaching a key horizontal support zone around $3,249 and $3,242.
🔹 Trendline support (now resistance) broken
🔹 Bear flag breakdown – strong bearish candle
🔹 Eyes on support levels: $3,249, $3,165, and possibly lower
🔹 Watch for a potential retest of the broken trendline for short opportunities
A clean break and close below $3,249 could open the door for further downside in the coming sessions. Trade cautiously and manage your risk!

XAUUSD BUY AND SELL LEVELSGold (XAUUSD) is currently showing key movement potential as it reacts to major levels. We are watching closely for price action near important support and resistance zones to identify the next trade setup.
📌 Stay alert for possible retracements or breakouts. Both buying and selling opportunities may arise depending on market reaction.
Trade with confirmation and always manage risk wisely.

Gold--sellWell, gold is having an interesting moment. It is currently correcting in a downtrend and is holding steady. I don't feel any strength in its trend. How far will it correct to the specified area?


GOLD: Bearish Continuation & Short Trade
GOLD
- Classic bearish pattern
- Our team expects retracement
SUGGESTED TRADE:
Swing Trade
Sell GOLD
Entry - 3331.7
Stop - 3334.0
Take - 3327.0
Our Risk - 1%
Start protection of your profits from lower levels
Disclosure: I am part of Trade Nation's Influencer program and receive a monthly fee for using their TradingView charts in my analysis.
❤️ Please, support our work with like & comment! ❤️

Gold Market Builds Momentum Toward 3358 Supply ZoneGold market continues to build momentum gradually, with price action targeting supply mitigation at 3358.
The duration of this stance depends on whether price can clear this zone decisively; failure may lead to short-term consolidation before the next stance.comment ,boost idea and follow for more informed decisions on gold market

Gold recently experienced a typical "suppression and release"Capital dynamics and sentiment modeling, found that the gold market has recently experienced a typical "suppression and release" type of reaction. After a period of sustained pressure on the emotional background, the dominant force of the short side began to weaken, and both long and short sentiment tends to be balanced, and the logic of gold as a safe-haven asset has been re-explored and recognized.
This type of trend is often non-explosive, but through the emotional layers of repair and structural slow reversal of the gradual unfolding. The current signal strength has reached the bearish threshold set by the system, with a certain operational feasibility.
It is recommended that traders try to follow up with a low percentage of positions, but still need to retain enough position space to cope with the possible continuation of fluctuations. The whole layout is mainly defensive and offensive, and it is appropriate to seek progress in a stable manner.

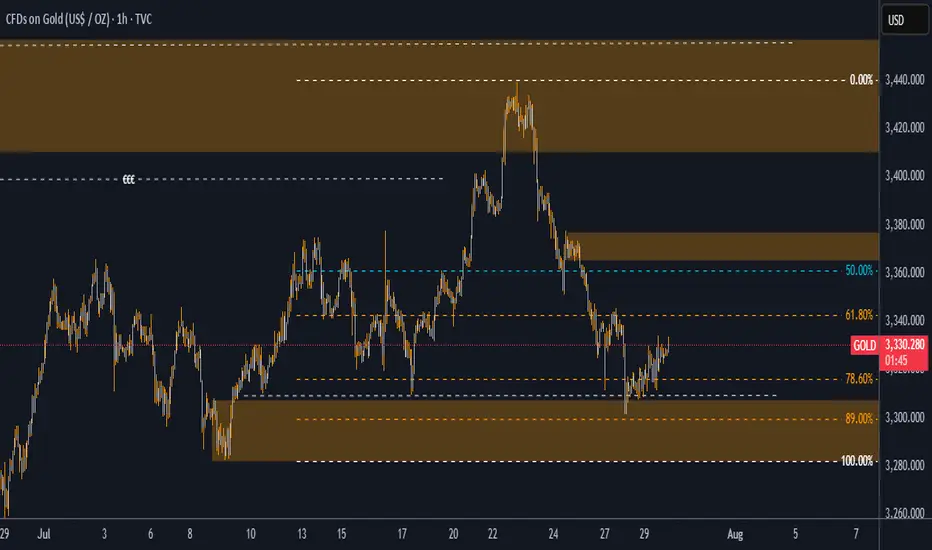
Gold (XAU/USD) – Technical UpdateDate: July 30, 2025
✅ Market Reaction Confirms the Forecast
In our previous analysis, we highlighted the $3,308–$3,315 region as a high-probability demand zone, reinforced by a deep retracement into the 89% Fibonacci level. We also pointed to a liquidity grab beneath $3,308 and projected a potential bullish reversal toward $3,345 and $3,398.
Today, price action has validated this view with precision.
✅ Price swept liquidity below $3,308 as expected, triggering a sharp rejection from our zone.
✅ A clear bounce followed, pushing price upward and confirming that large buyers stepped in—exactly where we anticipated.
✅ The structure is now shifting bullish, with price currently trading above $3,331, heading confidently toward our first target at $3,345.
📊 Why This Matters
This reaction was not random—it followed the logic laid out in the prior analysis:
-The demand zone was respected.
-The discounted pricing at 89% retracement offered maximum risk-reward.
-The internal imbalance between $3,345–$3,398 continues to act as a magnet, just as we outlined.
This is a textbook move where price hunted stops, tapped into demand, and began its upward drive—exactly as described in advance.
🎯 Targets Remain Valid
Target 1: $3,345 → Currently in progress. Price is gravitating toward this level, which also aligns with the 50% Fib retracement and minor supply.
Target 2: $3,398 → The final destination of this bullish move, completing the fill of the inefficiency left behind by the last drop.
🧠 Final Word
This is a strong confirmation of the original idea. The technical story has unfolded step by step as predicted, proving the reliability of the analysis. For traders following along, this not only reinforces confidence in the setup—but also showcases the power of disciplined, structure-based trading.
🔥 The move is unfolding exactly as projected. Patience, precision, and planning are now paying off.
consider like and follow so you don't miss any next analysis or update of the chart
you can ask me in the comment section
Please check how to trade later.Since the release of the trading strategy, I have been able to accurately predict market trends. I am also grateful to so many brothers for following me. My premium privileges are about to expire. I will put the subsequent trading content in the group. If any brothers are interested, they can find me through 🌐. As for how to deal with the future market, I have stated the extraordinary situation and will patiently wait for the rebound of gold. At the same time, I will pay attention to the impact of the Sino-US trade talks.
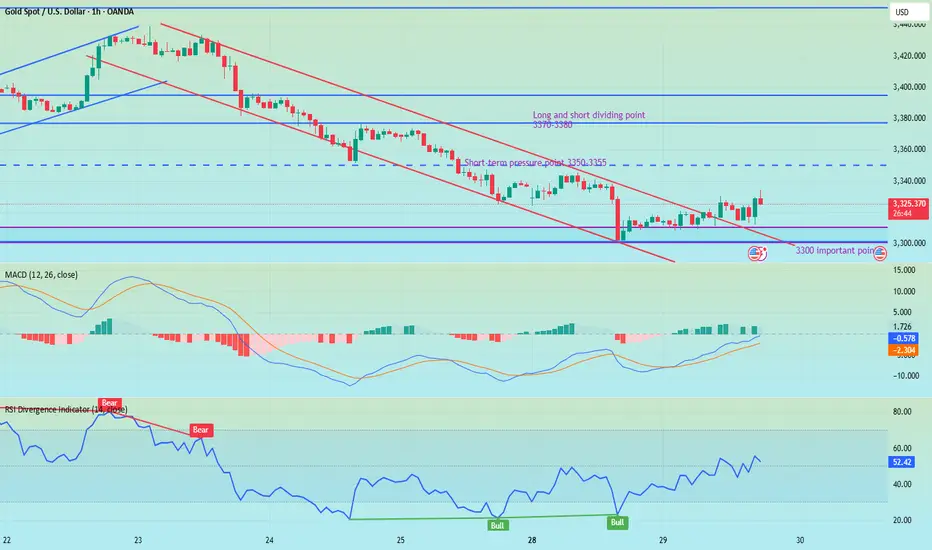
European session under pressure 3321 continue to shortI reminded everyone last night that if gold holds the 3300 mark, it will consolidate in the 3300-3345 range in the short term. The current gold price basically fluctuates narrowly between 3320-3310. Judging from the daily chart, the short-term upper pressure is at 3330. Only if the daily line stands firmly above 3330, there is a possibility of a rebound upward in the short term. Judging from the hourly chart, gold is still in a downward trend, and the hourly line is blocked near 3321. In the short term, if it cannot break through 3320-3330, gold will continue to fall. You can consider shorting, with the target at 3310-3300. If the European session is still volatile, maintain high shorts and low longs to participate in the cycle.
My premium privileges are about to expire, and subsequent trading strategies and analysis will be published in the group.

Analysis on the 10 Elite PairsYou can follow us for more Analysis(Images and Videos) with Precise definition of the Financial Market.ENJOY!!!

XAUUSD ShortElite Analysis
Noticed price came to structural liquidity
Obtain confirmations to short
Executed from 3m OB
Targeting Lower liquidity pools, main target London low
Gold Analysis and Trading Strategy | July 29✅ Fundamental Analysis
🔹 U.S. Dollar Index Surges Strongly: On Monday, the U.S. Dollar Index jumped over 1%, closing at 98.6, marking a new short-term high. This rally was primarily driven by the U.S.-EU trade agreement, which reduced tariffs to 15%, easing concerns of a trade war escalation. As a result, risk assets gained appeal, while gold's safe-haven demand was suppressed.
🔹 U.S.-China Talks Resume with Limited Expectations: The U.S. and China resumed trade negotiations in Stockholm, aiming to extend the 90-day tariff truce. However, the U.S. side made it clear that "no major breakthroughs are expected," leaving room for uncertainty, which provides some support for gold.
🔹 Geopolitical Risks Remain Elevated: President Trump has set a 10–12 day deadline regarding the Russia-Ukraine issue, warning of stronger measures if no progress is made. Meanwhile, tensions in the Middle East continue. Any escalation in conflicts could trigger renewed safe-haven buying in gold.
✅ Technical Analysis
🔸 Gold closed lower again on Monday, marking the fourth consecutive daily loss. The price rebounded to the 3345 level during the day but encountered strong resistance. During the European session, gold broke down swiftly, reaching a low of around 3301, showing a typical one-sided sell-off with strong bearish momentum.
🔸 On the 4-hour chart, gold broke below the key support level at 3320 and continued trading below the MA system. If the price fails to reclaim the 3330–3340 zone, the outlook remains bearish. However, if the European or U.S. session can push the price firmly above 3330, a potential bottom formation could be underway.
🔴 Resistance Levels: 3330 / 3345–3350
🟢 Support Levels: 3300 / 3285–3280
✅ Trading Strategy Reference:
🔻 Short Position Strategy:
🔰Consider entering short positions in batches if gold rebounds to the 3340-3345 area. Target: 3320-3310;If support breaks, the move may extend to 3300.
🔺 Long Position Strategy:
🔰Consider entering long positions in batches if gold pulls back to the 3300-3305 area. Target: 3325-3335;If resistance breaks, the move may extend to 3345.
🔥Trading Reminder: Trading strategies are time-sensitive, and market conditions can change rapidly. Please adjust your trading plan based on real-time market conditions. If you have any questions or need one-on-one guidance, feel free to contact me🤝
