Gold is set for a major crash!Are you ready for bearish trend of Gold?
After touching upper line of channel, Gold is ready for starting bearish trend.
GOLD trade ideas

Gold Spot (XAU/USD) Analysis – 30-Minute TimeframeGold Spot (XAU/USD) Analysis – 30-Minute Timeframe
At present, the price is fluctuating within a range between a key support zone and a key resistance zone. The overall market structure has taken on a ranging pattern, and traders are waiting for a breakout from either side.
🔹 Bullish Scenario: A breakout and consolidation above the current resistance could lead to a move toward higher resistance levels and eventually the main supply zone.
🔹 Bearish Scenario: A breakout and consolidation below the mid-range support could trigger a decline toward lower support levels and even a retest of recent lows.
Given the current situation, the price reaction to these zones will likely determine the next market direction.

GOLD: Move Down Expected! Short!
My dear friends,
Today we will analyse GOLD together☺️
The price is near a wide key level
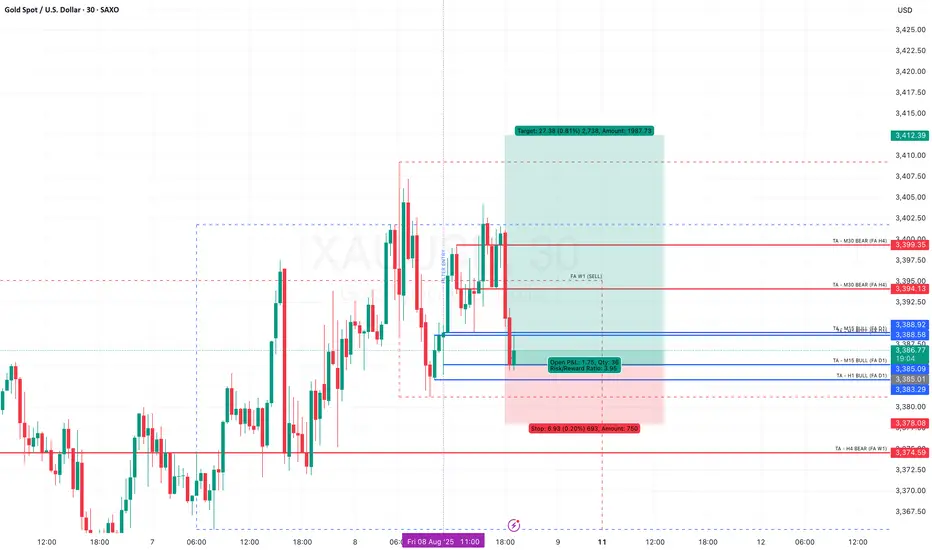
and the pair is approaching a significant decision level of 3,392.87 Therefore, a strong bearish reaction here could determine the next move down.We will watch for a confirmation candle, and then target the next key level of 3,383.49.Recommend Stop-loss is beyond the current level.
❤️Sending you lots of Love and Hugs❤️

XAUUSD POSSIBLE DROP IN PRICEGold is reacting at the 3400 psychological level. I anticipate a drop in price from that level coupled with the recent tariff that trump imposed on gold bar. A sell opportunity is envisaged from the current market price

BULL RUN EXPECTED TO CONTINUEBased on the current trend, bull run is expected continue to at the current support level.
XAUUSD Gold Trading Strategy August 8, 2025XAUUSD Gold Trading Strategy August 8, 2025:
Gold prices have approached the 340x area and have fallen sharply to the 338x support area at the beginning of today's trading session.
Basic news: President Trump announced to double tariffs on Indian goods to 50% in response to continued oil imports from Russia. Reports show that Trump may meet with Russian President Vladimir Putin as early as next week.
Technical analysis: Gold prices are currently in an uptrend channel, but the trading range is showing signs of narrowing. The possibility that the price will correct at this 340x area is very high; if the gold price creates a double peak pattern in the H1 frame, the price range of 3375 - 3380 will confirm the pattern and create a strong downward force for the gold price. If gold forms a double top pattern here, this correction could take gold to the 3350 or even 3330 area.
Important price zones today: 3375 - 3380, 3405 - 3410 and 3420 - 3425.
Today's trading trend: SELL.
Recommended orders:
Plan 1: SELL XAUUSD zone 3407 - 3409
SL 3412
TP 3404 - 3394 - 3374 - 3354.
Plan 2: SELL XAUUSD zone 3423 - 3425
SL 3428
TP 3420 - 3410 - 3390 - 3370.
Plan 3: BUY XAUUSD zone 3375 - 3377
SL 3372
TP 3380 - 3390 - 3400.
Wish you a safe, successful and profitable trading weekend.🌟🌟🌟🌟🌟

Gold is aiming at 3,440.00.Gold is aiming at 3,440.00.
Gold’s upward trend is poised to continue, driven by potential Federal Reserve rate cuts, ongoing central bank purchases, and increased ETF investments. Markets are betting on a 93% chance of a rate cut at the Fed’s next meeting. Central banks added 166 tons to global gold reserves in Q2, according to the World Gold Council, while gold-backed ETFs experienced robust inflows during the same period.
XAUUSD has been trading bullish during August 7 trading session. Уven the geopolitical relief did not prevent gold from continuing its upward path. On August 7 the price has successfully retested the 3,380.00 support and is currently heading towards the level of 3,440.00.

XAUUSD GOLD BUYS Gold hit all take profits and now will be taking more trades into the correct direction for the rest of the trend , keep the trading simple and straightforward

GOLD | Consolidation Gold is moving between a range and most probably will give a upside breakout.Once a breakout is given the then the next target is its last top.

"Gold Rejected at Resistance – Eyes Set on $3,350 Support"This 45-minute chart of Gold Spot (XAU/USD) highlights a possible bearish reversal pattern. After testing and rejecting resistance around the $3,400 level twice, price action shows signs of weakening bullish momentum. The chart suggests a corrective move is likely, targeting the support zone around $3,350, which aligns with the previous breakout level and horizontal support. Traders should watch for confirmation signals near the resistance before entering short positions. Keep an eye on volume and candlestick patterns to validate the move.🔍 Overview
Current Price: $3,380.32
Timeframe: 45-minute chart
Instrument: Gold Spot (XAU/USD)
Trend: Sideways to bearish bias near resistance
Key Zones:
Resistance: ~$3,400
Support (Target): ~$3,350
Major Support: ~$3,295–$3,300 (prior consolidation low)
---
🧱 Chart Structure & Key Observations
1. Double Top Formation
Price has tested the $3,400 zone twice and failed to break higher.
This creates a potential double top – a bearish reversal pattern.
2. Price Rejection
Long upper wicks near the top suggest strong selling pressure.
The recent move downward signals a shift in sentiment.
3. Bearish Impulse & Projection
The forecasted arrow shows a corrective move toward $3,350.
This level coincides with previous breakout structure and acts as a logical support retest.

Gold (XAU/USD) Technical Analysis:Gold is currently consolidating after a temporary bullish move and is testing a key support zone near $3,370.
🔻 Bearish Scenario:
If the price breaks below $3,370 and holds, this could lead to further downside towards $3,358, followed by a potential retest of the major support area at $3,310.
🔺 Bullish Scenario:
If the price bounces and breaks above the $3,385 resistance with strong momentum, we may see a continuation toward $3,397, and possibly $3,410.
⚠️ Disclaimer:
This analysis is not financial advice. It is recommended to monitor the markets and carefully analyze the data before making any investment decisions.

The powerful perspective that can change your attitude to losseWant to know a secret? You can actually change how you react to losing trades—just by thinking differently. Cool, huh?
🫣 Here’s a hard truth that every trader needs to accept: every trade is a potential loss.
Losses are an inevitable part of the game.
No matter how good your setup is, no matter how much you’ve prepared—there will always be trades that don’t work out.
Trading is already emotionally challenging as it is. But if you get stuck obsessing over one single trade, it becomes so much more emotionally exhausting. You start evaluate yourself after every outcome. And that’s not a sustainable way to trade.
Let’s be honest: the result of one trade doesn’t say much about your actual trading performance.
It’s only over time—after a series of trades—that you can honestly evaluate how you’re doing.
If we want to reduce some of the emotional storms that come with trading, we need a different strategy. A more compassionate one. One that gives us the space to breathe, recover and grow.
So how do we do that? By practicing a shift in perspective.
A shift that’s actually rooted in neuroscience. It’s about broadening your perspective.
👉 Broadening your perspective means reminding yourself:
"This is just one of many trades I’ll take in my trading journey."
That’s it. Simple. No complicated strategy. Just a small shift in thinking that helps you regulate your emotions.
Whether you’ve just taken a loss or feel doubt creeping in before entering a trade—say it to yourself (out loud if you want!): “This is only one of many trades I will experience.”
And here comes the science part:
🧠 When you broaden your perspective like this, the brain responds. It decreases arousal in the amygdala—your brain’s “panic button.”
At the same time, it activates the prefrontal cortex—the part of your brain responsible for rational thinking, impulse control and analysis.
Put simply: you become more emotionally balanced—and more able to view the market objectively.
🤔 Why is that important?
Because when your amygdala calms down, the risk of emotionally driven mistakes decreases.
The fear becomes less intense.
And in trading terms: you’ll be better at cutting losers faster and holding on to winners longer.
🪄 Will this shift magically erase all tough emotions? No. The emotions will still be there—just not as loud.
And isn’t it more motivating to remind yourself that you are not defined by a single trade?
You’re defined by your overall journey. Your effort. Your long-term consistency.
💡Pro Tip:
Next time you feel hesitation—even with a solid setup, or after closing a losing trade
👉 Try this reminder:
“This is only one of many trades I will execute during my career.”
Let it soften the inner storm.
Happy, compassionate trading! 💙
/ Tina the Trading Psychologist

XAUUSD | 1H Reversal Setup | Bullish CHoCH Play – Aug 6, 2025*
---
### 🔹 Market Bias:
* **4H**: Transitional – Potential shift from bearish to bullish
* **1H**: Bullish CHoCH confirmed
* **Context**: Strong low formed after liquidity sweep of 4/5 internal lows
---
### 🧠 Narrative (SMC):
Following the BOS to the downside, price swept **multiple internal liquidity points** (noted as LQCs) and created a **strong reaction from demand**, forming a **valid strong low**.
We’ve now seen an **internal CHoCH**, and price has returned to the **refined OB zone**, where a **Buy Limit** is set.
We’re looking for price to continue pushing up as early signs of reversal structure form.
---
### 📌 Entry Setup:
* **Buy Limit**: \$3,370.13
* **Stop Loss**: Below structure / OB zone (e.g. \$3,359.63)
* **TP1**: \$3,390.44 (1H inefficiency fill)
* **TP2**: \$3,390.44+ (extended targets: next supply)
* **RR**: Approx 2.3–2.6R
### ✅ Confluences:
* ✅ 1H Bullish CHoCH confirmed
* ✅ OB + imbalance + EQ zone entry
* ✅ 4/5 LQ sweeps with strong bullish reaction = strong low
* ✅ Trendline liquidity above
* ✅ 4H forming bullish rejection candle
---
### ⚠️ Invalidation:
* Break and close below \$3,359.63 + return without bullish rejection
* Signs of strong bearish engulfing on lower timeframes

4-dollar sign pattern - Long term gold bull marketUnbeatable 4-dollar sign bull pattern. Gold breaks 50-month moving average. Last time was a 10-year bull market. This time, 10 years more.

XAU
Gold (XAU/USD) – Bullish Breakout and Key Resistance Zones Ahead
Gold has recently broken out of a descending channel on the 4H timeframe, indicating a potential shift in market structure. The breakout was strong and clean, suggesting momentum is building up for further upside.
Price is now approaching a series of key resistance zones, which I’ve marked as potential short-term targets:
3387.025
3406.948 – 3409.846
3421.203
As long as price holds above the breakout zone and maintains support around 3318–3330, the bullish scenario remains intact. A rejection from the 3271 demand zone also supports this move.
I'll be watching price action closely near each resistance for signs of continuation or reversal. This idea is based purely on technical analysis and market structure.

ATH - Not in my watch for nowAs mentioned in my last post, Gold won't be pushing to break ATH unless there's an unusual catalyst that attracts it. Range bound trading is still the play, especially as we're coming into August. Save your ammunition for the Fall season, reduce your position and trade conservatively to build your equity safely. The USD has some room leg room to push higher in the short term that should hinder the yellow metal to go full bore.

XAUUSD: Market Analysis and Strategy for July 31stGold Technical Analysis:
Daily chart resistance: 3351, support: 3250
4-hour chart resistance: 3335, support: 3270
1-hour chart resistance: 3315, support: 3290.
Gold was trading sideways between 3320 and 3333 yesterday before the New York market. During the US trading session, the release of US ADP employment figures and PCE price data was bearish for gold, causing it to plummet below Monday's low of 3301. The Federal Reserve held interest rates steady, and Powell's hawkish speech sent gold plummeting to around $3268.
Affected by the news, gold prices fell rapidly yesterday, reaching a low near the lower Bollinger band on the daily chart. It rebounded in the Asian session today, reaching a high near 3315. Selling is recommended in the sideways range between 3310 and 3320. The US PCE data will be released in the New York market, so avoid the news release period.
BUY: near 3290
SELL: near 3270

XAU/USD 08 August 2025 Intraday AnalysisH4 analysis:
-> Swing: Bullish.
-> Internal: Bullish.
You will note that price has targeted weak internal high on three separate occasions which has now formed a triple top, this is a bearish reversal pattern and proving this zone is a strong supply level. This is in-line with HTF bearish pullback phase.
Remainder of analysis and bias remains the same as analysis dated 23 April 2025.
Price has now printed a bearish CHoCH according to my analysis yesterday.
Price is now trading within an established internal range.
Intraday Expectation:
Price to trade down to either discount of internal 50% EQ, or H4 demand zone before targeting weak internal high priced at 3,500.200.
Note:
The Federal Reserve’s sustained dovish stance, coupled with ongoing geopolitical uncertainties, is likely to prolong heightened volatility in the gold market. Given this elevated risk environment, traders should exercise caution and recalibrate risk management strategies to navigate potential price fluctuations effectively.
Additionally, gold pricing remains sensitive to broader macroeconomic developments, including policy decisions under President Trump. Shifts in geopolitical strategy and economic directives could further amplify uncertainty, contributing to market repricing dynamics.
H4 Chart:
M15 Analysis:
-> Swing: Bullish.
-> Internal: Bullish.
H4 Timeframe - Price has failed to target weak internal high, therefore, it would not be unrealistic if price printed a bearish iBOS.
The remainder of my analysis shall remain the same as analysis dated 13 June 2025, apart from target price.
As per my analysis dated 22 May 2025 whereby I mentioned price can be seen to be reacting at discount of 50% EQ on H4 timeframe, therefore, it is a viable alternative that price could potentially print a bullish iBOS on M15 timeframe despite internal structure being bearish.
Price has printed a bullish iBOS followed by a bearish CHoCH, which indicates, but does not confirm, bearish pullback phase initiation. I will however continue to monitor, with respect to depth of pullback.
Intraday Expectation:
Price to continue bearish, react at either M15 supply zone, or discount of 50% internal EQ before targeting weak internal high priced at 3,451.375.
Note:
Gold remains highly volatile amid the Federal Reserve's continued dovish stance, persistent and escalating geopolitical uncertainties. Traders should implement robust risk management strategies and remain vigilant, as price swings may become more pronounced in this elevated volatility environment.
Additionally, President Trump’s recent tariff announcements are expected to further amplify market turbulence, potentially triggering sharp price fluctuations and whipsaws.
M15 Chart:

GOLD RISING AGAIN1. MA20 on weekly held the price again
2. Gold is making Higher Lows in a row
3. 100 days of sideway movement
Now its time for $4000 in my opinion

xauusd buybuy xauusd
XAUUSD
idea order block active with high volume here
and it back to test it
OANDA:XAUUSD

XAU / USD Weekly ChartHello traders. News was good for the US dollar this morning. Powell did nothing, as expected, and gold is testing the lower boundries of the weekly candle body from last week. So now the question is, do we push down more, or does gold move up to take out all the leveraged shorts that are in profit? I marked the area to watch. Buys and sells with break and close out of the zone. Let's see how the daily and 4 hour candles play out. Shout out to Big G. Be well and trade the trend.

