XAUUSDPrice action trading is a methodology where traders make decisions based on the interpretation of actual price movements on a chart, rather than relying primarily on lagging indicators. It involves observing and analyzing candlestick patterns, trend lines, support and resistance levels, and volume to identify potential trading opportunities and manage risk. The focus is on understanding the story the market is telling through its price behavior.
GOLD trade ideas

XAUUSD - Scalping ideaPrice is stuck in a range between 3348.90 and 3324.87.
📌 Looking for a clean breakout to take action:
Buy above 3348.90 → Targeting 3354.09
Sell below 3324.87 → Targeting 3319.15
Not interested in any trades inside the range only jumping in once we break out and close outside either level. Waiting for confirmation to avoid getting chopped up.
Let’s see where it goes. 📉📈
No rush, just reacting.

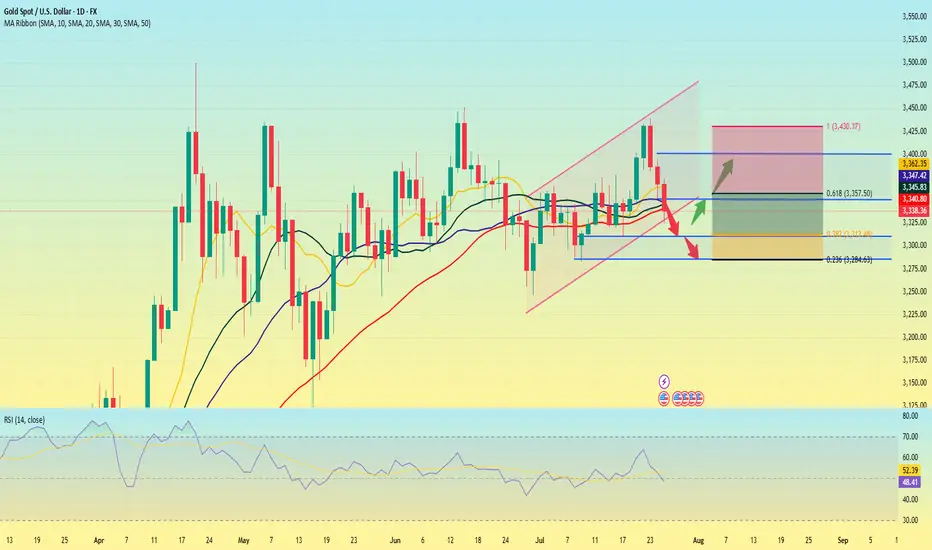
Daily Analysis- XAUUSD (Monday, 28th July 2025)Bias: Bullish
USD News(Red Folder):
-None
Notes:
- Price gap down and filled up the gap
- Looking for price to tap 0.618 fib level
- Potential BUY if there's
confirmation on lower timeframe
- Pivot point: 3300
Disclaimer:
This analysis is from a personal point of view, always conduct on your own research before making any trading decisions as the analysis do not guarantee complete accuracy.

KEMANA GOLD KEDEPAN NYA ?📊 Technical Analysis – XAUUSD (July 28, 2025)
Elliott Wave Structure – Triangle (ABCDE):
The chart clearly shows a contracting triangle pattern (ABCDE), which commonly appears during corrective waves (usually Wave 4 or Wave B in a larger degree).
Currently, price seems to have just completed Wave E, and it's showing early signs of a bounce from the triangle's lower support.
If this wave count is valid, we could expect a bullish breakout soon, continuing the previous trend (most likely upward if this is part of Wave (5)).
🧭 Key Support and Resistance Levels:
Triangle Support (Wave E area):
Around $3,325 – $3,336 (price is currently testing this zone)
Potential Bullish Targets (if breakout occurs):
🎯 $3,374
🎯 $3,414
🎯 $3,498 – $3,500 (major resistance zone / Wave 5 target)
🧠 Fundamental Outlook Supporting Gold (Forward-Looking)
✅ Bullish Drivers:
Fed Rate Cut Expectations (Late 2025):
Slowing inflation → Rate cuts expected → Positive for gold.
Weaker US Dollar:
A weaker dollar makes gold cheaper for international buyers → Bullish.
Global Geopolitical Tensions:
Rising uncertainty supports gold as a safe haven asset.
⚠️ Bearish Risks:
Strong US economic data (e.g., NFP beats or rising inflation) could lead to the Fed staying hawkish → Negative for gold.
If price breaks below triangle support ($3,325), the triangle structure would be invalidated and a larger correction could unfold.
📝 Summary & Trading Strategy:
Direction Entry Area Stop Loss TP 1 TP 2 TP 3
✅ Buy (preferred) $3,330 – $3,336 Below $3,310 $3,374 $3,414 $3,498–$3,500
❌ Sell (if breakdown) Below $3,320 Above $3,340 $3,265 $3,245 $3,118

XAUUSD about to trade downwardsToo many tries on the higher high created by Gold that have failed , now the price has broken a treblndline from months back signalling a bearish move down to 3000 with few breaks to lead it there if the dollar doent slip, which the decline might take up to November according to how I see the pattern formations

Gold – Range Break Incoming?Gold is still locked in a broad range, but recent price action suggests a possible breakdown. A break below the double bottom opens the door for a move toward the range midpoint.

Gold Weekly Summary and Forecast 7/27/2025My last week's weekly post is still valid at this moment.
I was expecting heavy drop for gold last week. However, the market doesn't follow my instruction. Rather we have to react to whatever it provides. Gold rose at the first few days and gave a false break. It quickly dropped back down below 3365 and closed the week with a red candle.
This false break signals a strong momentum towards downside. I am still expecting price to touch at least 3255 this month or even 3180.
Next week my main strategy is selling. Let's see what the market will give us next week.

Gold is weak. Will it explode next week?Gold prices failed to stabilize above $3,400 after a bullish breakout this week. The technical outlook highlights the recent indecision of gold bulls.
In the first two trading days of this week, spot gold prices rose by 2.4%, but the cumulative decline in the last three trading days of this week reached nearly 3%. The sharp fluctuations this week were due to the positive progress in Trump's trade negotiations, and the rebound in market risk appetite, which hit the safe-haven demand for gold.
Looking at next week, the economic calendar will provide several high-impact data releases. The Federal Reserve will announce its monetary policy decision after the policy meeting on July 29-30; the US Bureau of Labor Statistics will release the July employment report; and some important news such as the US-China trade negotiations may trigger the next major move for gold.
From a technical perspective, the current market short-term technical outlook highlights the hesitation of gold buyers. The daily chart shows that the RSI is still slightly below 50, and gold prices have difficulty staying away from the 20-day and 50-day MAs after breaking through these two levels earlier this week.
On the upside, 3450 constitutes the first resistance for gold prices. If it breaks through this resistance, gold prices will most likely hit the 3400 integer mark again.
On the downside, if gold prices remain below 3340, technical sellers may still be interested. In this case, 3310 can serve as the first support level, followed by the second support level near 3285.
A new week is about to begin, and I wish all traders good luck.
Report - 25 jully, 2025U.S.–EU Tariff Negotiations Stabilizing Markets
Reports confirm the U.S. and EU are nearing a deal for 15% reciprocal tariffs—lower than the initially threatened 30% by President Trump. This easing of tensions led to moderate equity gains in both blocs, with the Stoxx 600 reaching a 6-week high before closing +0.2%. Pharmaceutical and auto stocks outperformed (Volkswagen +2.3%, Bayer +2.3%).
Forecast: If the 15% deal is finalized by the August 1 deadline, it would remove a key overhang on equities and boost cyclical sectors reliant on transatlantic trade. A failure, however, risks escalation, triggering retaliatory tariffs by the EU on $93bn of U.S. goods, dragging risk assets sharply lower.
DXY Outlook: Tariff de-escalation boosts safe-haven flows and investor optimism, supporting USD strength.
S&P 500: Short-term relief rally expected if the 15% tariff framework is signed. However, margin compression risks remain from lingering supply chain disruptions.
Tesla vs Trump: Policy Shock Rattles EV Sector
Elon Musk warned that Trump's anti-EV stance and trade war posture will sharply erode Tesla’s regulatory credit revenue and remove the $7,500 EV tax credit. Tesla's stock has cratered 37% since December, with a sharp 8% drop yesterday. Adjusted Q2 net income was down 22%, revenue -12%.
Risk Forecast: Loss of EV subsidies + political fallout between Musk and Trump could drag Tesla further and dampen broader EV sector growth.
XAUUSD: Rising political uncertainty and risks to the U.S. tech sector may drive safe-haven flows into gold.
Dow Jones: Tesla's underperformance and anti-EV policies could limit industrial sector gains.
ECB Holds Rates Amid Trade Risk Fog
The European Central Bank paused its easing cycle, holding the benchmark rate at 2%. Lagarde emphasized a "wait-and-watch" stance, signaling uncertainty due to unresolved trade talks and tariff volatility.
Market Implication: Eurozone government bond yields rose (10Y Bund at 2.70%), paring rate-cut bets. The euro softened to $1.1760.
EURUSD: Lack of further ECB accommodation and weaker consumer confidence amid trade frictions.
Fed Independence in Jeopardy? Market Confidence Wobbles
Pimco warned that White House pressure on Fed Chair Powell—including potential firing and scrutiny over $2.5bn HQ renovations—could destabilize markets. Trump continues pushing for aggressive 1% rates, diverging from current 4.25–4.5% levels.
Fiscal/Political Implication: Undermining Fed autonomy risks flight from U.S. bonds, undermining monetary policy credibility and capital inflows.
USDJPY: Yen may gain if markets lose faith in U.S. institutional integrity, despite rate differentials.
DXY: Temporary support from yields, but structural downside if Fed credibility erodes.
Deutsche Bank and BNP: Diverging Strengths in Volatile Landscape
Deutsche Bank posted its strongest Q2 in 18 years, driven by litigation charge reversals and stable investment banking performance. BNP Paribas also reported solid FICC trading (+27%), though equity trading lagged due to weak derivatives demand.
Equity Implication: Strong capital returns and stable European banking profitability support DAX resilience amid trade noise.
DAX: Boosted by banking and auto outperformance.
China–EU Trade Strains Escalate
Von der Leyen directly confronted Xi Jinping over trade imbalances and support for Russia. EU exports to China are down 6% YoY while Chinese imports to the EU are up 7%. Xi defended Beijing’s stance, warning against "decoupling" rhetoric.
Geostrategic Implication: EU may escalate anti-dumping and export control measures. Markets may see renewed volatility in European industrials and luxury sectors reliant on China.
XAUUSD: Rebalancing of power and heightened East–West tensions favor gold.
Oil Oversupply Warning from TotalEnergies
Total warned of an oil glut due to OPEC+ production increases and weakening global demand. Q2 profits fell 30% YoY. Brent now likely to stay within $60–70 range barring major geopolitical flare-ups.
Crude Oil: Short- to medium-term downside risk with soft demand and oversupply fears.
Energy Stocks: Dividend maintenance remains but debt levels and margin pressures may weigh.
AI Spending Surges – Alphabet and SK Hynix
Alphabet posted a 19% Q2 profit jump as AI integration boosts search volumes. Google’s cloud revenues rose 32%. Capex raised to $85bn. SK Hynix also posted record revenues from high-bandwidth memory chip sales, extending its lead over Samsung.
S&P 500: AI-driven earnings upside bolsters tech sector. Expect multiple expansion in mega-cap AI-exposed names.
XAUUSD : Robust AI investment supports risk appetite but inflationary fears could lift gold marginally.

XAUUSD Update July 2025 - PLAN B - Bulls RejectionAfter Hard fall from 3439 ( 3450 rejection ), Gold will retest 3310 support.
If bounce from here, it will move upside and retest 3373 resistance.
If any hard rejection from 3373 resistance area, its a sign that price will move to make a lower low.
Becarefull in this accumulation zone.
Bearish movement still hiding before it break 3120 support.
Have a blessing day !

XAUUSDXAU/USD represents the exchange rate between one troy ounce of gold (XAU) and the US dollar (USD). It shows how much in US dollars is required to purchase one ounce of gold. This pair is widely traded across forex and commodities markets and is considered a key indicator of global economic stability and investor sentiment.
Historically, gold was pegged to the US dollar under the Bretton Woods Agreement from 1944 to 1971. During this period, one ounce of gold was fixed at $35, and the US government guaranteed the convertibility of dollars into gold. In 1971, President Richard Nixon ended the gold standard, allowing gold to trade freely on global markets. This led to significant volatility in the price of gold, which began to reflect real-time market forces such as supply, demand, inflation, and geopolitical events.
In the decades that followed, gold experienced several major price movements. In 1980, gold surged to around $850 per ounce due to high inflation and geopolitical instability. It then declined and remained relatively low through the 1990s, reaching a low near $270 in 2000. Starting in the mid-2000s, gold began a strong upward trend driven by concerns about inflation, financial crises, and central bank policies, culminating in a peak near $1,920 in 2011 during the Eurozone crisis and Federal Reserve monetary easing.
In 2020, gold hit a new all-time high around $2,070 during the global uncertainty of the COVID-19 pandemic. Since then, it has continued to be influenced by economic data, interest rate decisions, inflation trends, and geopolitical developments. In 2024 and 2025, gold has remained strong, supported by central bank buying and expectations of future rate cuts. As of August 2025, the current price of gold has reached $3,363 per ounce, reflecting heightened demand and ongoing macroeconomic uncertainty.
XAU/USD is influenced by many factors, including the strength of the US dollar, inflation expectations, geopolitical risks, and investor demand for safe haven assets. When the dollar weakens or global uncertainty increases, gold typically gains value. Traders and investors often use gold to hedge against economic instability, inflation, or currency devaluation.
Today, gold remains one of the most important assets in global markets, and XAU/USD continues to be a major pair for both short-term traders and long-term investors.

GOLD Correction Ahead!
HI,Traders !
#GOLD is growing strongly
And the pair looks locally
Overbought so after it
Hits the horizontal resistance
Area around 3374.56 we will
Be expecting a local bearish
Correction and a move down !
Comment and subscribe to help us grow !

GOLD Short From Resistance! Sell!
Hello, Traders!
GOLD surged up sharply
On Friday and is already
Retesting the horizontal
Resistance of 3377$
From where we will be
Expecting a local pullback
On Monday as Gold
Is locally overbought
Sell!
Comment and subscribe to help us grow!
Check out other forecasts below too!
Disclosure: I am part of Trade Nation's Influencer program and receive a monthly fee for using their TradingView charts in my analysis.

gold on third pattern breakout#XAUUSD have multiple test the third pattern, now price forming needs to breakout the 3308 before any further movement.
Buy entry 3301.4, TP 3308-3323.
Below 3291 holds a very strong bearish continuation, if breakout price will fall till 3269

XAUUSD Gold Trading Strategy August 1, 2025
Yesterday's trading session, gold prices recovered to the 3315 area and then continued to decrease to the 3281 area. Currently, gold prices are fluctuating quite unpredictably due to the impact of tariff news and investor confidence.
Basic news: The Federal Reserve FED continues to maintain the federal funds benchmark interest rate in the range of 4.25% - 4.50%, in line with policy since 2025. Chairman Powell did not give any signal about the next interest rate cut on September 16 - 17.
Technical analysis: After falling sharply to the 3269 area, gold prices are showing signs of recovery. In the current downtrend channel, there has been a higher bottom than the bottom at H1. We can see that if the bullish pattern at H1 is confirmed, combined with the reversal candlestick appearing at H4, the possibility of gold bouncing back to reach the resistance area of 3330, even 3350 is completely possible. In the weekend trading session, we will wait at the support zones to trade.
Important price zones today: 3280 - 3285 and 3269 - 3274.
Today's trading trend: BUY.
Recommended orders:
Plan 1: BUY XAUUSD zone 3283 - 3285
SL 3280
TP 3288 - 3300 - 3310 - 3330.
Plan 2: BUY XAUSD zone 3269 - 3271
SL 3266
TP 3274 - 3284 - 3300 - 3320.
Wish you a safe, favorable and profitable trading day.🥰🥰🥰🥰🥰

XAU/USD 01 August 2025 Intraday AnalysisH4 Analysis:
-> Swing: Bullish.
-> Internal: Bullish.
You will note that price has targeted weak internal high on three separate occasions which has now formed a triple top, this is a bearish reversal pattern and proving this zone is a strong supply level. This is in-line with HTF bearish pullback phase.
Remainder of analysis and bias remains the same as analysis dated 23 April 2025.
Price has now printed a bearish CHoCH according to my analysis yesterday.
Price is now trading within an established internal range.
Intraday Expectation:
Price to trade down to either discount of internal 50% EQ, or H4 demand zone before targeting weak internal high priced at 3,500.200.
Note:
The Federal Reserve’s sustained dovish stance, coupled with ongoing geopolitical uncertainties, is likely to prolong heightened volatility in the gold market. Given this elevated risk environment, traders should exercise caution and recalibrate risk management strategies to navigate potential price fluctuations effectively.
Additionally, gold pricing remains sensitive to broader macroeconomic developments, including policy decisions under President Trump. Shifts in geopolitical strategy and economic directives could further amplify uncertainty, contributing to market repricing dynamics.
H4 Chart:
M15 Analysis:
-> Swing: Bullish.
-> Internal: Bullish.
H4 Timeframe - Price has failed to target weak internal high, therefore, it would not be unrealistic if price printed a bearish iBOS.
The remainder of my analysis shall remain the same as analysis dated 13 June 2025, apart from target price.
As per my analysis dated 22 May 2025 whereby I mentioned price can be seen to be reacting at discount of 50% EQ on H4 timeframe, therefore, it is a viable alternative that price could potentially print a bullish iBOS on M15 timeframe despite internal structure being bearish.
Price has printed a bullish iBOS followed by a bearish CHoCH, which indicates, but does not confirm, bearish pullback phase initiation. I will however continue to monitor, with respect to depth of pullback.
Intraday Expectation:
Price to continue bearish, react at either M15 supply zone, or discount of 50% internal EQ before targeting weak internal high priced at 3,451.375.
Note:
Gold remains highly volatile amid the Federal Reserve's continued dovish stance, persistent and escalating geopolitical uncertainties. Traders should implement robust risk management strategies and remain vigilant, as price swings may become more pronounced in this elevated volatility environment.
Additionally, President Trump’s recent tariff announcements are expected to further amplify market turbulence, potentially triggering sharp price fluctuations and whipsaws.
M15 Chart:

Technical Analysis of Gold Chart (XAU/USD) – 4-Hour TimeframeTechnical Analysis of Gold Chart (XAU/USD) – 4-Hour Timeframe
Following the heavy selling pressure seen in recent days, the price of gold has now reached a zone that has repeatedly shown reactions in the past. This green-colored support area can currently play a decisive role in the market’s next move.
Price Movement Outlook:
Scenario 1 – Bullish Correction Move:
If buyers manage to take control of the market in this zone, it is expected that gold will gradually pass through intermediate resistance levels and first enter the medium-term resistance area. If momentum is maintained, the price could then move toward higher highs. This move can be interpreted as a technical correction against the recent bearish wave and may attract short-term traders until reaching strong supply zones.
Scenario 2 – Continuation of the Downtrend:
Conversely, a confirmed break of this support with high volume and strong bearish candles could lead to a further decline in price toward previous lows. In this case, the blue-colored area at the lowest part of the chart would serve as the next demand zone.
Key Point:
The market is currently in a decision-making phase. Confirmation of reactions at this support area is extremely important in determining the market’s future direction. Therefore, entering the market prematurely without waiting for confirmation of price behavior could involve high risk.
Interest rates unchanged, sticking to my bearish idea.Look at my other posts and you''ll understand as to why, I was telling everyone to sell. There was a small sellers trap, we pushed up, at that moment I already had closed my positions. Now we go down to the other key levels. I'm done till the end of August. Will still post my setups, but won't take any trades. Stay safe and keep your funds safe. Hella Love!


Gold intraday downside
Gold intraday: down trend, short position below 3335 with target 3296 and 3278. Long position 3274-3280.

XAU/USD 29 July 2025 Intraday AnalysisH4 Analysis:
-> Swing: Bullish.
-> Internal: Bullish.
You will note that price has targeted weak internal high on three separate occasions which has now formed a triple top, this is a bearish reversal pattern and proving this zone is a strong supply level. This is in-line with HTF bearish pullback phase.
Remainder of analysis and bias remains the same as analysis dated 23 April 2025.
Price has now printed a bearish CHoCH according to my analysis yesterday.
Price is now trading within an established internal range.
Intraday Expectation:
Price to trade down to either discount of internal 50% EQ, or H4 demand zone before targeting weak internal high priced at 3,500.200.
Note:
The Federal Reserve’s sustained dovish stance, coupled with ongoing geopolitical uncertainties, is likely to prolong heightened volatility in the gold market. Given this elevated risk environment, traders should exercise caution and recalibrate risk management strategies to navigate potential price fluctuations effectively.
Additionally, gold pricing remains sensitive to broader macroeconomic developments, including policy decisions under President Trump. Shifts in geopolitical strategy and economic directives could further amplify uncertainty, contributing to market repricing dynamics.
H4 Chart:
M15 Analysis:
-> Swing: Bullish.
-> Internal: Bullish.
H4 Timeframe - Price has failed to target weak internal high, therefore, it would not be unrealistic if price printed a bearish iBOS.
The remainder of my analysis shall remain the same as analysis dated 13 June 2025, apart from target price.
As per my analysis dated 22 May 2025 whereby I mentioned price can be seen to be reacting at discount of 50% EQ on H4 timeframe, therefore, it is a viable alternative that price could potentially print a bullish iBOS on M15 timeframe despite internal structure being bearish.
Price has printed a bullish iBOS followed by a bearish CHoCH, which indicates, but does not confirm, bearish pullback phase initiation. I will however continue to monitor, with respect to depth of pullback.
Intraday Expectation:
Price to continue bearish, react at either M15 supply zone, or discount of 50% internal EQ before targeting weak internal high priced at 3,451.375.
Note:
Gold remains highly volatile amid the Federal Reserve's continued dovish stance, persistent and escalating geopolitical uncertainties. Traders should implement robust risk management strategies and remain vigilant, as price swings may become more pronounced in this elevated volatility environment.
Additionally, President Trump’s recent tariff announcements are expected to further amplify market turbulence, potentially triggering sharp price fluctuations and whipsaws.
M15 Chart:


BOS into Downtrend I think price is going down to the higher level support to sweep liquidity and go back to continue into the uptrend
