XAUUSD: July 30th Market Analysis and StrategyGold Technical Analysis:
Daily Chart Resistance: 3351, Support: 3300
4-Hour Chart Resistance: 3340, Support: 3310
1-Hour Chart Resistance: 3334, Support: 3315.
Trading risk will increase today. We will focus on the Federal Reserve's interest rate decision and the ADP employment data, which are expected to increase market liquidity. If trading, please avoid news releases.
On the daily chart: Bollinger Bands are moving horizontally, with gold prices trading above the lower band. The MACD indicator has formed a downward death cross, indicating a release of bearish momentum. The RSI indicator has fallen back into the overbought range of 50-40, indicating a clear bottoming out and rebound in gold prices.
On the 4-Hour Chart: Bollinger Bands are narrowing, with gold prices trading near the middle band. The MACD indicator is beginning to turn upward, and the RSI is showing an oversold rebound. Gold prices are poised for an upward rebound! The NY market is focusing on the $3351 resistance level above and the $3308 support level below.
SELL: 3351near
BUY: 3315near
GOLD trade ideas

Schabacker's Gold Trap Inside the Trap: Schabacker Congestion, VWAP Warfare & The Silent Distribution on XAU/USD
1. The Congestion Area – Schabacker Style
🔍 What We Saw:
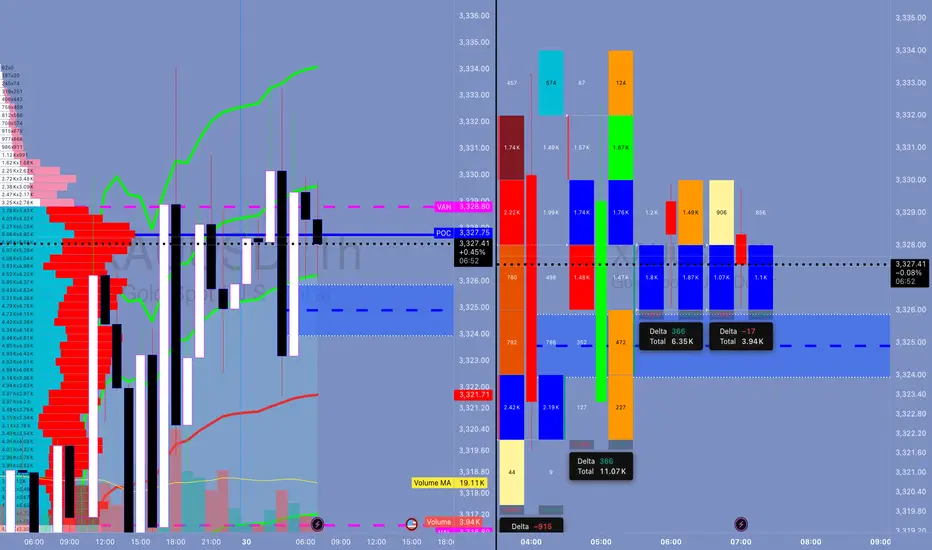
Price action rotated in a tight range: 3,324.5 - 3,329.5.
This is not random. This is Schabacker’s classic Congestion Zone:
Duration: 12+ hours
Width: ~5 points
Volume: tapering near edges
Failed breakouts on both sides = classic neutral wedge compression.
🎯 Schabacker Teaching Applied:
"Congestion areas are places of rest and preparation — they are the breeding grounds of significant breakouts or breakdowns."
From his bible “Technical Analysis and Stock Market Profits”:
Congestion after a trend → likely a continuation (but confirm via breakout volume).
Multiple failed breakouts = deceptive strength/weakness → traps.
Range becomes psychological equilibrium → breakout from this zone is explosive.
📘 Lesson:
Watch for breakout confirmation only AFTER price escapes the congestion and retests the range (confirm with volume and delta). If volume weakens and price returns inside = fakeout, fade that sh*t.
🔥 How Schabacker Explains July 29 Price Action
"This was a classic congestion scenario with symmetrical compression, rejecting value high and value low over and over — a balanced market ripe for an imbalanced expansion."
Price coiled with lower highs + higher lows inside the value zone = triangle-like congestion.
Breakout attempts both sides failed = energy stored.
Delta flipped negative toward the close + volume dried = distribution inside the congestion.
✅ Congestion was not random chop. It was the Smart Money disguising their exit before slamming price.
⚔️ ENHANCED STRATEGIC OUTLOOK FOR TODAY (JULY 30, 2025)
🎯 Bias: Short bias unless proven wrong by breakout + acceptance above 3,329.50
Schabacker’s congestion broken to the downside = high probability short trigger.
First target = edge of congestion zone @ 3,316.80 (previous VAL).
Second target (extension) = swing low anchor near 3,310.
📘 Volatility Note:
After tight range like this (Schabacker Box), volatility expansion is imminent. Don’t get caught trading inside — trade the break and retest.
💣 HYPOTHETICAL TRADE PLAN: SCHABACKER STRATEGY IN PLAY
Order Type: 🔻 Sell Stop Below Congestion Break
Entry: 3,322.00
Stop Loss: 3,330.00 (above congestion top + failed breakout zone)
Take Profit 1: 3,316.80 (edge of range, VAL)
Take Profit 2: 3,310.00 (target from congestion width projection)
Confidence: 78%
🧠 Justification:
Factor Explanation
VWAP Flatlined = balanced market
FVRP Price camped near POC = equilibrium
Footprint Absorption at highs, silent selling = distribution confirmed
Delta Early buyer strength flipped = trap
Schabacker Congestion Classic box breakout setup = timing the expansion
🧠 EDUCATIONAL SUMMARY — WHAT YOU JUST LEARNED
✅ Schabacker’s Congestion Area Tactics
Congestion after a move Leads to continuation (trend resumes after pause)
Multiple failed breakouts Traps traders = setup for fakeout fade
Volume dries inside box = Explosive breakout likely
Use congestion width To project breakout targets
You don't fade chop — you exploit it after the breakout.
Don't waste your bullets inside the box. Wait for the beast to break loose — then you unload.
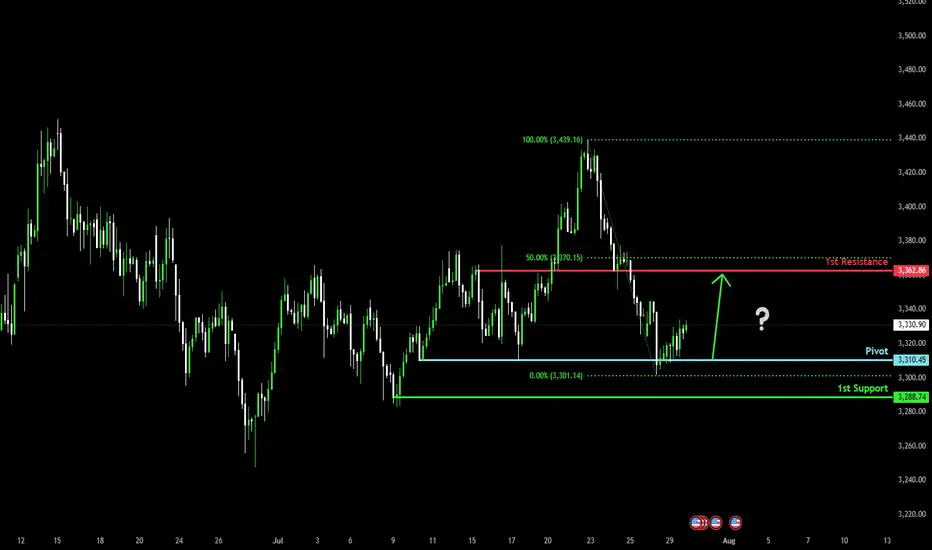
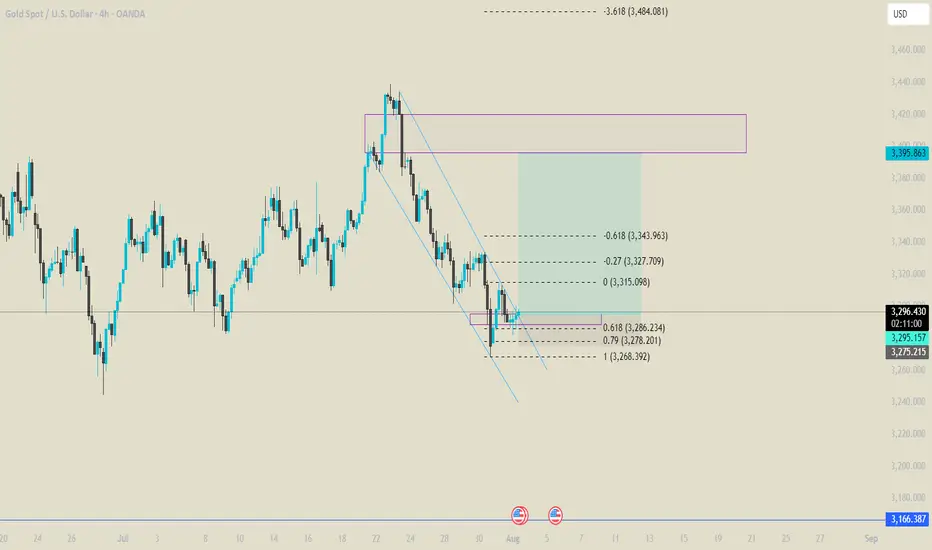
Bullish bounce off?The Gold (XAU/USD) has bounced off the pivot, which acts as a multi-swing low support and could rise to the 1st resistance, which is slightly below the 50% Fibonacci retracement.
Pivot: 3,310.45
1st Support: 3,288.74
1st Resistance: 3,362.86
Risk Warning:
Trading Forex and CFDs carries a high level of risk to your capital and you should only trade with money you can afford to lose. Trading Forex and CFDs may not be suitable for all investors, so please ensure that you fully understand the risks involved and seek independent advice if necessary.
Disclaimer:
The above opinions given constitute general market commentary, and do not constitute the opinion or advice of IC Markets or any form of personal or investment advice.
Any opinions, news, research, analyses, prices, other information, or links to third-party sites contained on this website are provided on an "as-is" basis, are intended only to be informative, is not an advice nor a recommendation, nor research, or a record of our trading prices, or an offer of, or solicitation for a transaction in any financial instrument and thus should not be treated as such. The information provided does not involve any specific investment objectives, financial situation and needs of any specific person who may receive it. Please be aware, that past performance is not a reliable indicator of future performance and/or results. Past Performance or Forward-looking scenarios based upon the reasonable beliefs of the third-party provider are not a guarantee of future performance. Actual results may differ materially from those anticipated in forward-looking or past performance statements. IC Markets makes no representation or warranty and assumes no liability as to the accuracy or completeness of the information provided, nor any loss arising from any investment based on a recommendation, forecast or any information supplied by any third-party.
XAUUSD idea 29/07/25We are waiting for our asset to reach our action zone, and based on the reaction, we’ll decide on our next moves.ALWAYS WAIT FOR A CONFIRMATION TO SEE IF THE PRICE VALIDATES THE ZONE.and you what is your vision of the EURUSD its interests me! i wait you in the commentary

GOLD Slips as Dollar Gains on Trade Deal – Bearish Below 3349
Gold Pares Gains as USD Strengthens on Trade Deal Ahead of Fed
Gold gave up early gains, pressured by a stronger U.S. dollar after the announcement of the US–EU trade agreement.
Meanwhile, attention shifts to upcoming U.S.–China negotiations later today, as both sides aim to extend the current trade truce and avoid new tariffs.
Investors are also closely watching the Federal Reserve’s policy decision on Wednesday, seeking signals on future interest rate moves.
TECHNICAL OUTLOOK:
Gold maintains a bearish trend while trading below 3349, with potential downside toward 3320.
A 1H candle close below 3320 – 3312 would confirm extended bearish pressure targeting 3285, driven in part by ongoing geopolitical risks.
⚠️ To shift back to a bullish structure, the price must stabilize above 3349.
Key Levels:
• Support: 3320 – 3285 – 3256
• Resistance: 3365 – 3375

GOLD → Retest of trend support. Consolidation...GOLD is consolidating below the previously broken trend support. On Sunday, Trump announced a trade deal with the EU, which is putting pressure on the market along with the rising dollar...
Gold rebounded from support at $3310 after a week-long low, interrupting a three-day decline amid profit-taking. However, the overall downtrend remains intact as markets brace for a busy week with the release of US GDP data and the Fed's decision. Optimism surrounding US-China trade talks and the US-EU framework agreement is reducing demand for safe-haven assets. Additional pressure on gold is coming from easing geopolitical tensions: Thailand and Cambodia have agreed to ceasefire talks. The metal's recovery may be short-lived.
Technically, we have global and local bullish trends, against which gold is testing support, but as we can see, buyers are trying to hold back the decline due to uncertainty over interest rates. There is a chance that we will see active action by the Fed, behind which lies a rate cut, this week...
Resistance levels: 3345, 3375
Support levels: 3320, 3287
At the moment, I do not see a proper reaction to the support breakout. The price is consolidating after confirming the key trigger at 3345. Thus, if the price starts to return to 3345, test and consolidate above the level, we will have a chance for growth. I do not rule out a liquidity grab from 3325 (false breakout) before the rise.
BUT! The structure will be broken if the price breaks 3325 - 3320 and begins to consolidate below this zone. In this case, gold may fall to 3287
Best regards, R. Linda!

XAUUSD: Market Analysis and Strategy for July 29Gold Technical Analysis:
Daily chart resistance: 3345, support: 3285
4-hour chart resistance: 3340, support: 3300
1-hour chart resistance: 3330, support: 3308.
After last week's sharp decline, gold continued its decline yesterday, breaking below its opening low and continuing its downward trend, reaching a low near 3300. In the short term, selling pressure is strong, but the rebound is weak, with a rebound high of 3330.
In terms of intraday trading, yesterday's low of 3301 was followed by a rebound. Focus on the resistance range of 3330-3338. Selling is recommended if the price is trading sideways between 3330-3338, with a defense of 3340. If it falls below 3300, the next target will be 3285.
Sell: 3338
Buy: 3302
Sell: 3300

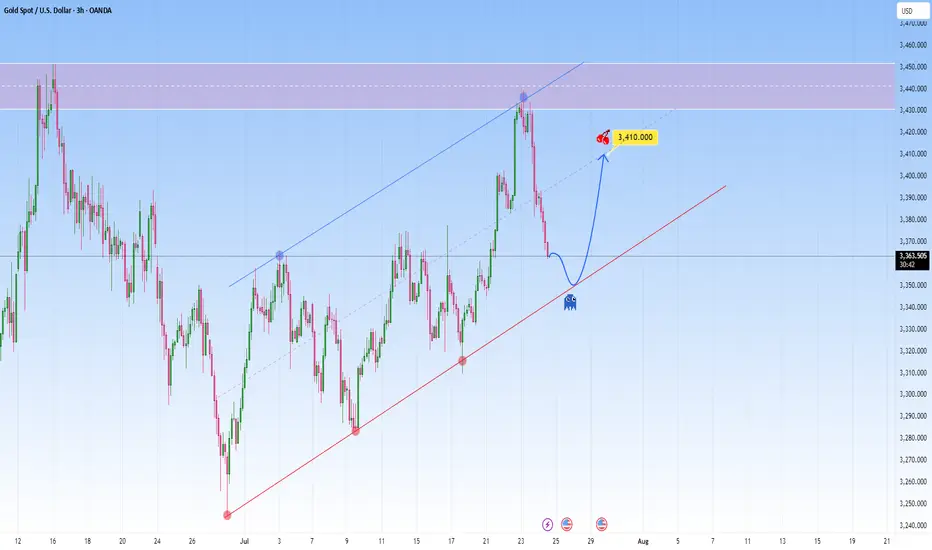
GOLD Reawakened: Corrects firmly but conditions remain bullishFrom a technical perspective Gold is climbing in a parallel channel, clearly bullish with a rhythm that’s hard to ignore. Price just bounced off the resistance with force, a classic overextension flush.
And the market is now approaching the lower boundary of this projected channel. This confluence of technical support is likely to attract renewed buying interest.
I expect it to bounce back toward 3,410, somewhere around the middle of the channel. The move up may not be determined right away. It could be consolitaing, fake dips first, or sudden acceleration.
Report - 29 jully, 2025Summary
Initial optimism following the historic US–EU trade agreement has swiftly eroded as France and Germany openly criticized the deal, warning it undermines EU sovereignty and economic stability. The euro fell sharply, carmakers led equity declines, and political fractures within the bloc widened. While the deal averted a full-blown trade war, concerns over inflation, competitiveness, and regulatory submission have shifted sentiment. The perception of European capitulation under pressure from Trump has reignited transatlantic tensions and injected fresh volatility into global markets.
This retreat in EU support underscores the precarious nature of transatlantic cooperation under Trump’s economic nationalism. Meanwhile, signs of tech decoupling, tariff expansion beyond the EU, and deferred retaliation signal a fractured global trade order. European fiscal policy, particularly Germany’s defense-driven deficit expansion, is now under heightened scrutiny amid market volatility and FX pressure.
Market Reactions
Equity markets across the EU opened higher on tariff relief expectations but reversed course as Germany’s Chancellor Merz and France’s Prime Minister Bayrou denounced the deal. The DAX fell 1.1%, CAC 40 slipped 0.4%, and eurozone auto stocks plunged 1.8%. The euro lost over 1% against the dollar in its second-largest daily drop this year, reflecting concern over structural imbalance and political subordination.
In contrast, semiconductor stocks surged, with ASML and BE Semiconductor rising over 4% as the tech sector escaped tariffs. Wall Street remained relatively stable, buoyed by optimism around defense, energy, and tech sectors gaining from the deal. The dollar index (DXY) rose 0.9%, reflecting both euro weakness and expectations that inflationary tariffs could keep Fed rates elevated.
Fiscal and Political Implications
The backlash from Berlin and Paris lays bare deep fractures within the EU regarding its posture toward Washington. Chancellor Merz’s warning of "considerable damage" and Bayrou’s reference to EU “submission” cast doubt on Ursula von der Leyen’s negotiation strategy. The deal’s imposition of a 15% baseline tariff—triple the pre-deal weighted average—exposes Europe to substantial cost increases without achieving reciprocal liberalization.
Internally, the European Commission is accused of caving to U.S. pressure while undermining its own credibility. Documents and diplomatic leaks suggest that more aggressive retaliatory planning was watered down due to fears of a broader security rupture, particularly concerning NATO and U.S. arms support to Ukraine. This reinforces the EU’s strategic dependency, limiting its ability to resist U.S. economic coercion.
Germany’s effort to shield its auto industry via offset schemes largely failed, while Brussels’ “trade bazooka” was shelved in favor of “strategic patience.” This perceived capitulation may embolden further unilateral action from the U.S., especially as Trump eyes tariffs on pharmaceuticals and rest-of-world imports up to 20%.
Strategic Forecasts
Europe's short-term economic outlook has darkened. The tariff burden—especially on high-margin exporters like German autos—raises inflation risks while lowering competitiveness. Political backlash could destabilize Commission leadership and provoke calls for more aggressive economic sovereignty.
Expect further euro weakness, sectoral underperformance in autos and industrials, and possibly downgrades to GDP forecasts across the eurozone. On the U.S. side, Trump’s success with transatlantic leverage may embolden him to expand tariff threats to Asia and Latin America. The Fed will likely face a more inflationary policy environment, with fiscal and protectionist stimulus prolonging higher rate expectations.
Simultaneously, China's relief from U.S. tech export freezes—designed to secure a Xi-Trump summit—adds complexity to the strategic tech rivalry. The suspension of chip export controls could spur near-term capital inflows to Chinese AI firms while igniting concern in U.S. defense circles.
Risks and Opportunities
Risks
Breakdown in EU cohesion and trust in Commission leadership
Expansion of U.S. tariffs to rest of world (ROW), escalating global trade friction
Retaliation by China if U.S. chip diplomacy reverses
Drag on European industrial profits and inflation-driven ECB recalibration
Fed rate path upwardly skewed due to structural tariff-driven inflation
Opportunities
U.S. defense and energy sectors benefit from guaranteed EU purchases
Semiconductors remain shielded, with valuation support in ASML, TSMC, Nvidia
Dollar strength provides tactical trades in EURUSD, GBPUSD
Select EM exporters (e.g. Brazil) benefit from re-diversified trade flows
AI hardware and chip infrastructure (Samsung–Tesla deal) gains strategic momentum
Key Asset Impact – Outlook
XAUUSD (Gold):
Gold holding firm around $3,340. With fresh political discord and rising protectionist inflation, gold remains a hedge. If Fed signals rate hold, expect a push to $3,400.
Bias: Bullish
S&P 500:
Resilient, driven by defense, energy, and AI. But prolonged strong dollar and tariff-induced input cost pressures are risk factors.
Bias: Moderately Bullish
Dow Jones:
Benefiting from defense and dividend-heavy mix, but under pressure from industrial drag.
Bias: Neutral to Bullish
DXY (US Dollar Index):
Strengthening on euro weakness and policy divergence. However, long-term Fed autonomy concerns and political volatility could reverse trend.
Bias: Bullish short-term, Neutral longer-term
USDJPY:
Little movement today. BoJ still cautious, yen capped unless Fed shifts dovish or global risk-off resumes.
Bias: Range-bound
EURUSD:
Second-largest single-day drop YTD. Political backlash and export headwinds limit upside.
Bias: Bearish
Crude Oil (WTI):
Flat to slightly higher, supported by EU commitment to U.S. energy, but demand data remains soft.
Bias: Neutral
Stoxx Autos:
Heavy selloff (-1.8%) despite tariff reduction, reflecting margin pressure.
Bias: Bearish
ASML / BE Semiconductor:
Relief rally on tariff exclusion. Long-term tailwinds from open AI infrastructure and Samsung–Tesla chip deal.
Bias: Bullish

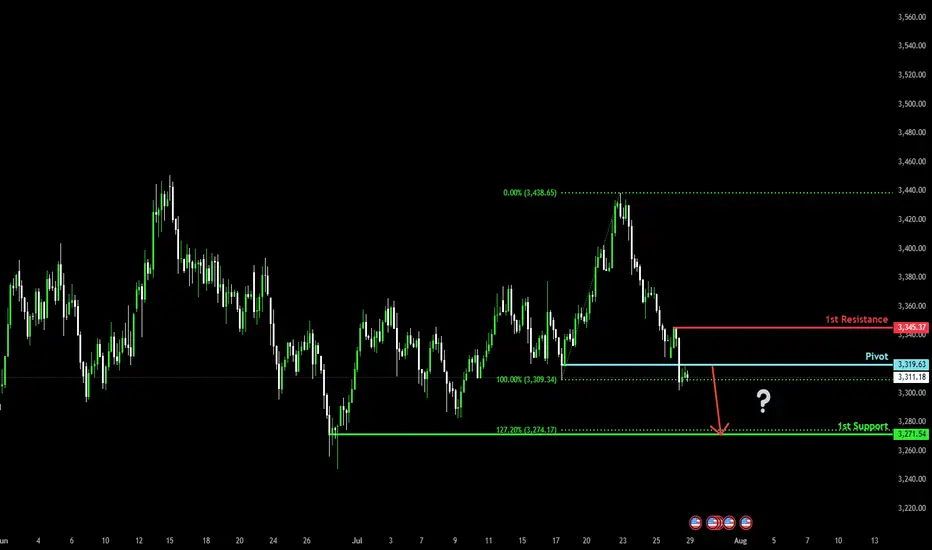
Bearish drop for the Gold?The price is reacting off the pivot and could drop to the 1st support, which is a swing low support that aligns with the 127.2% Fibonacci extension.
Pivot: 3,319.63
1st Support: 3,271.54
1st Resistance: 3,345.37
Risk Warning:
Trading Forex and CFDs carries a high level of risk to your capital and you should only trade with money you can afford to lose. Trading Forex and CFDs may not be suitable for all investors, so please ensure that you fully understand the risks involved and seek independent advice if necessary.
Disclaimer:
The above opinions given constitute general market commentary, and do not constitute the opinion or advice of IC Markets or any form of personal or investment advice.
Any opinions, news, research, analyses, prices, other information, or links to third-party sites contained on this website are provided on an "as-is" basis, are intended only to be informative, is not an advice nor a recommendation, nor research, or a record of our trading prices, or an offer of, or solicitation for a transaction in any financial instrument and thus should not be treated as such. The information provided does not involve any specific investment objectives, financial situation and needs of any specific person who may receive it. Please be aware, that past performance is not a reliable indicator of future performance and/or results. Past Performance or Forward-looking scenarios based upon the reasonable beliefs of the third-party provider are not a guarantee of future performance. Actual results may differ materially from those anticipated in forward-looking or past performance statements. IC Markets makes no representation or warranty and assumes no liability as to the accuracy or completeness of the information provided, nor any loss arising from any investment based on a recommendation, forecast or any information supplied by any third-party.
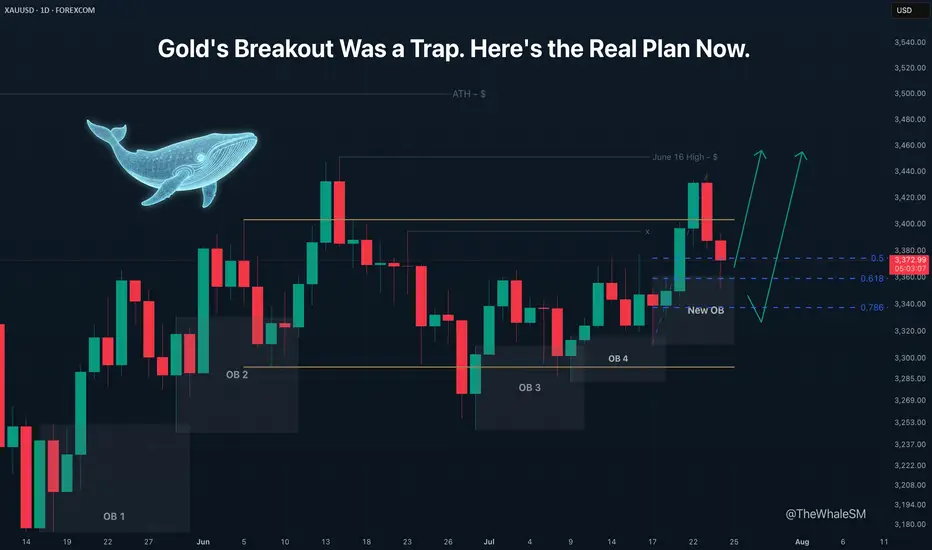
Gold's Breakout Was a Trap. Here's the Real Plan Now.Gold has made its next move, and it was quite sharp. I was expecting a smoother correction with a return to the manipulation zone, but Gold followed a different scenario, which I described at the end of my last gold analysis:
Gold has practically confirmed its breakout from the global range it has been in since the beginning of June. The only thing that could prevent this is a complete engulfing of the bullish daily candle that broke the upper boundary of the range by a bearish candle, but I consider this an unlikely scenario.
The closed red daily candle, which completely engulfed the preceding bullish one, showed that the move was, in fact, an internal liquidity sweep . The price has not yet managed to break out of the range. Therefore, when I wrote "Gold has practically confirmed its breakout from the global range" , the daily candle had not yet closed, and the price had not secured its position above the range's upper boundary.
Essentially, it's not important how the price arrives at a Point of Interest (POI) . What matters is what we have now: the price has mitigated a manipulation in the form of a new daily order block that was formed inside the range.
Although the middle of a range is a highly unpredictable area for price movement, and I almost never consider it for entries, in this case, there is a strong exception that allows us to consider longs from this order block. The reason for this exception is the bullish order flow on the daily structure, which I have mentioned several times, and the ascending daily structure within the range. This structure allows us to identify the start of the last impulse and draw Fibonacci retracement levels, which will serve as an additional condition for our potential long setup. We can now see that the price has reached the 61.8% Fib level and has shown a reversal reaction to it. To see more precisely if there is a potential entry point, let's switch to the 4H timeframe.
On the 4H chart, we see that the 61.8% level has held, and we can look for entry confirmation on a lower timeframe. The 4H timeframe also shows that the liquidity sweep created a supply zone , which will act as resistance on the path of the next attempt to break out of the range. Due to this zone, considering a long from the current position is not optimal because the risk-to-reward ratio is too small. Furthermore, the price could reject from this supply zone and continue its correction to the next level, the 78.6% Fib level . To find an entry with a more acceptable R:R, let's move to the lower timeframes.
Two Potential Long Scenarios
SCENARIO 1: Entry from the 15M Demand Zone or 15M OB
The 15M timeframe shows a break of the 15M structure and the formation of manipulations in the form of a demand zone and a 15M order block within it.
► Setup Condition: I will consider a long position upon the mitigation of one of these manipulation zones and a clear reversal reaction from it. If the price continues to move up from the current levels, I will not enter due to the large stop loss required and the suboptimal R:R to the nearest resistance.
► Invalidation: A break below these support zones on the lower timeframe will invalidate this scenario.
SCENARIO 2: Entry from the 78.6% Fib Level
This scenario becomes active if the first one fails.
► Setup Condition: If the price breaks the 15M supports, I will watch for its interaction with the 78.6% Fib level . For a potential entry, this level must hold, show a reversal reaction, and be followed by confirmation on a lower timeframe.
► Invalidation: A decisive close below the 78.6% Fib level.
~~~~~~~~~~~~~~~~~~~~~~~~~~~~~~~~~~~~~~~~~~~~~~~~~~~~~~~~~~~~~~~~~
The principles and conditions for forming the manipulation zones I show in this trade idea are detailed in my educational publication, which was chosen by TradingView for the "Editor's Picks" category and received a huge amount of positive feedback from this wonderful, advanced TV community. To better understand the logic I've used here and the general principles of price movement in most markets from the perspective of institutional capital, I highly recommend checking out this guide if you haven't already. 👇
P.S. This is not a prediction of the exact price direction. It is a description of high-probability setups that become valid only if specific conditions are met when the price reaches the marked POI. If the conditions are not met, the setups are invalid. No setup has a 100% success rate, so if you decide to use this trade idea, always use a stop-loss and proper risk management. Trade smart.
~~~~~~~~~~~~~~~~~~~~~~~~~~~~~~~~~~~~~~~~~~~~~~~~~~~~~~~~~~~~~~~~~
If you found this analysis helpful, support it with a Boost! 🚀
Have a question or your own view on this idea? Share it in the comments. 💬
► Follow me on TradingView to get real-time updates on THIS idea (entry, targets & live trade management) and not to miss my next detailed breakdown.
~~~~~~~~~~~~~~~~~~~~~~~~~~~~~~~~~~~~~~~~~~~~~~~~~~~~~~~~~~~~~~~~~
XAUUSD Long Setup – 1HGold (XAUUSD) has shown strong bullish rejection from the lower volatility band after a sharp selloff. The appearance of a Heikin Ashi reversal candle, suggests a short-term reversal is forming. Price has reclaimed key structure and is now targeting a reversion back to the mean, supported by Fibonacci retracement levels.
Entry: 3293.55
Target Zone: 3308.91 → 3333.76 (Fib 38.2% – 100%)
Stop Loss: 3253.35
Confluences:
✅ Bullish engulfing + Heikin Ashi trend shift
✅ Oversold bounce from lower channel extremity
✅ Fib retracement aligns with key structural resistance zones
✅ Custom signal confirmation (green dot)
✅ Clean R:R toward upper band and previous POI
Short-term counter-trend long targeting liquidity grab and mean reversion toward the 3308–3333 zone. Risk tightly managed with SL below local swing low.

**"Gold Price Rebounding from Support:Potential Move Toward 3436This chart shows the **price movement of Gold (XAU/USD)** on a **daily timeframe**.
### Key Points:
* **Support Zone** : Around **\$3,266**, this is the area where price has bounced up multiple times, meaning buyers step in here.
* **Resistance Line**: Around **\$3,436**, this is the level where price has been rejected before, meaning sellers are strong here.
* **Current Price**: Around **\$3,293**.
### What the Chart Suggests:
* Price is near the **support** zone again.
* If the support holds, the green arrow shows a possible move **upward**.
* Price may first move up slightly, pull back, and then try to **break above resistance** at \$3,436.
Gold is in a sideways range. It's near a strong support level and might go up from here toward the resistance level, as shown by the green line.

Gold Recovery Setup = Divergence + Support ClusterGold ( OANDA:XAUUSD ) fell to the lower line of the ascending channel and the Support zone($3,350-$3,326) , as I expected in my previous idea .
Gold is currently near a set of Supports .
Supports:
Support zone: $3,350-$3,326
Monthly Pivot Point: $3,333
Potential Reversal Zone(PRZ): $3,339-$3,329
Lower line of the ascending Channel
50_EMA(Daily)
Support lines
In terms of Elliott Wave theory , Gold appears to be completing a bearish wave 5 .
Also, we can see the Regular Divergence(RD+) between Consecutive Valleys .
I expect Gold to rise to at least $3,359 .
Second target: $3,367
Note: Stop Loss (SL) = $3,319
Do you think Gold can break the Support cluster by the end of trading hours?
Gold Analyze (XAUUSD), 1-hour time frame.
Be sure to follow the updated ideas.
Do not forget to put a Stop loss for your positions (For every position you want to open).
Please follow your strategy; this is just my idea, and I will gladly see your ideas in this post.
Please do not forget the ✅ ' like ' ✅ button 🙏😊 & Share it with your friends; thanks, and Trade safe.

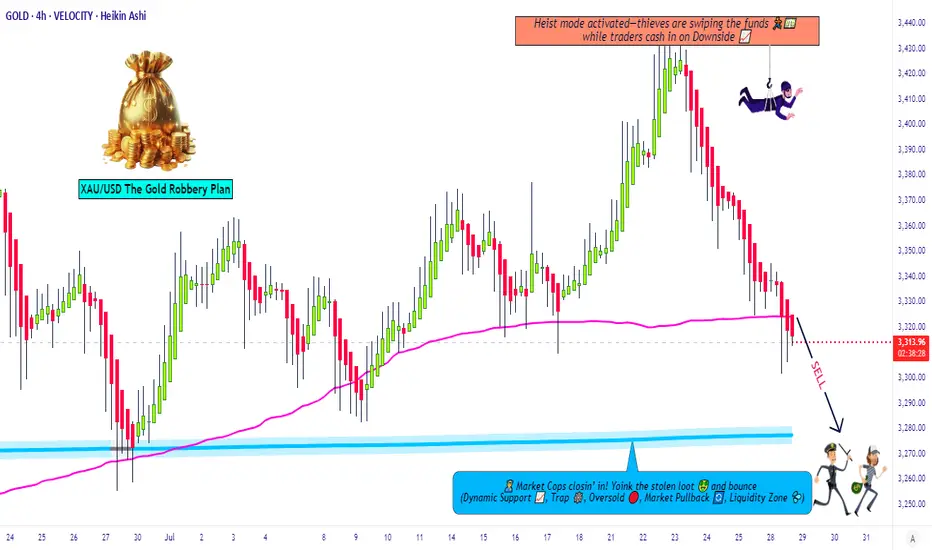
Gold Robbery Blueprint: Smart Bears on the Move Now!💣 XAU/USD GOLD HEIST PLAN: Robbery Begins at Resistance Zone! 🔐💰
🌟Hi! Hola! Ola! Bonjour! Hallo! Marhaba!🌟
Dear Money Makers & Market Robbers, 🕵️♂️💸🚀
Welcome to another strategic strike by Thief Trading Style™—where smart analysis meets bold execution. We're targeting XAU/USD (Gold) in this scalping/day-trade opportunity, primed with fundamentals, technicals, and pure robbery logic.
🔍 THE GAME PLAN
We're looking at a neutral zone turning bearish, and here’s how the robbery unfolds:
🔑 ENTRY POINTS
🎯 “Vault wide open” signal!
Initiate short orders at current price zones or set layered SELL LIMITS near swing highs on 15M/30M charts. We're running a DCA-style pullback entry for max loot.
🕵️♀️ Entry isn't about one shot—it's about precision raids.
🛑 STOP LOSS: THE ALARM SYSTEM
Set SL just above the nearest swing high (4H timeframe preferred).
Use candle wick tips as your defense line (Example: 3350.00).
Adjust SL based on risk appetite and number of orders stacked.
🎯 TARGET: THE GETAWAY PLAN
💸 First Vault: 3280.00
💨 Or escape earlier if price action signals reversal. Protect your gains. Professional thieves don't get greedy.
📊 WHY WE’RE ROBBING HERE
This level is a high-risk barricade zone—police aka "market makers" are strong here.
We spotted consolidation, oversold signals, trend reversal setups, and a bullish trap disguised as support. A perfect time to strike. 🧠🔍
📰 FUNDAMENTAL & SENTIMENTAL CHECKPOINTS
🔎 Stay updated with:
Global news drivers
Macro & Intermarket analysis
COT reports & future trend targets
👉 Check the 🔗🔗🔗
⚠️ TRADING ALERT - STAY SAFE DURING NEWS BOMBS!
Avoid entries during major economic data releases.
Use trailing SL to protect running profits.
Monitor volatility spikes & price anomalies.
💖 JOIN THE CREW, BOOST THE HEIST!
If this plan adds value to your trades, hit that Boost Button 💥
Support the Robberhood and help grow the gang of smart money snipers 🕶️💼💣
Every boost = more ammo for next mission. Let's rob the market—not each other. 🚀🤑
📌 Remember: Market is fluid. Stay sharp, adapt quick, and trade like a shadow.
Catch you soon in the next grand heist 🎭💼
#XAUUSD #GoldTrade #ScalpingStrategy #DayTrading #ThiefTrader #RobTheMarket #BoostForMore #NoChaseNoCase
Gold : Holding Ground Below 3345 Amid USD SurgeGold : Holding Ground Below 3345 Amid USD Surge
Gold's upward potential from Friday appears limited by the 3345 level—a narrow but firm resistance zone. As long as price fails to break above it, this zone has a high importance.
If gold holds below 3345, the probability of further downside increases significantly.
Meanwhile, the recent US–EU agreement has strengthened the USD. While this isn’t expected to severely impact gold, short-term fluctuations can’t be ruled out.
If price stabilizes in the red zone, it may consolidate ahead of the upcoming FOMC meeting. In such cases, volatility could erupt based on news-driven catalysts—so be prepared for unexpected moves.
You may find more details in the chart!
Thank you and Good Luck!
PS: Please support with a like or comment if you find this analysis useful for your trading day

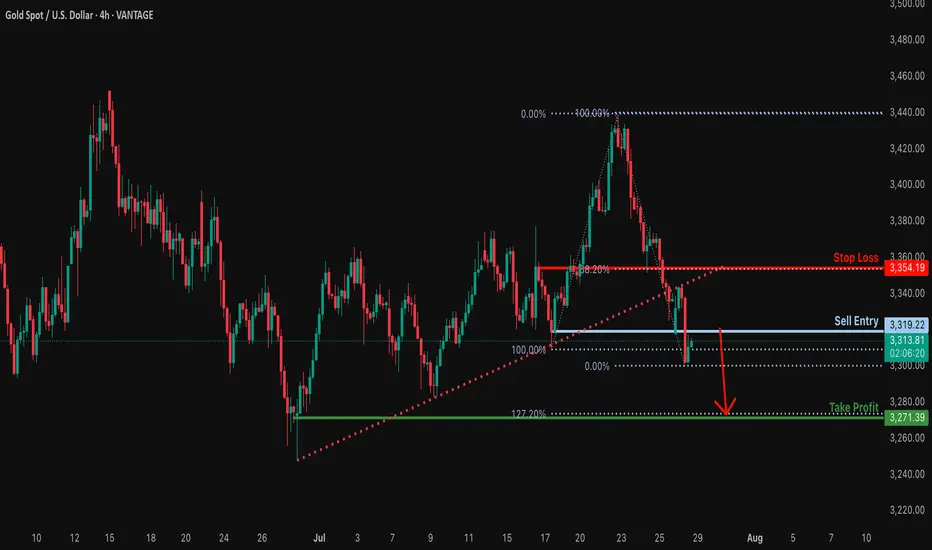
Bearish reversal?XAU/USD is rising towards the resistance level, which serves as a pullback resistance and could drop from this level to our take-profit target.
Entry: 3,319.22
Why we like it:
There is a pullback resistance.
Stop loss: 3,354.19
Why we like it:
There is a pullback resistance that aligns with the 38.2% Fibonacci retracement.
Take profit: 3,271.39
Why we like it:
There is a swing low support that lines up with the 127.2% Fibonacci extension.
Enjoying your TradingView experience? Review us!
Please be advised that the information presented on TradingView is provided to Vantage (‘Vantage Global Limited’, ‘we’) by a third-party provider (‘Everest Fortune Group’). Please be reminded that you are solely responsible for the trading decisions on your account. There is a very high degree of risk involved in trading. Any information and/or content is intended entirely for research, educational and informational purposes only and does not constitute investment or consultation advice or investment strategy. The information is not tailored to the investment needs of any specific person and therefore does not involve a consideration of any of the investment objectives, financial situation or needs of any viewer that may receive it. Kindly also note that past performance is not a reliable indicator of future results. Actual results may differ materially from those anticipated in forward-looking or past performance statements. We assume no liability as to the accuracy or completeness of any of the information and/or content provided herein and the Company cannot be held responsible for any omission, mistake nor for any loss or damage including without limitation to any loss of profit which may arise from reliance on any information supplied by Everest Fortune Group.
Xauusd bullish setupGold (XAU/USD) is approaching a key support zone around 3,285.82. The chart suggests a potential bullish reversal from this level, targeting resistances at 3,376.35 and 3,431.08. Price action may form a double bottom before moving upward.

Gold long from 3295I think this might be the bottom .
Next week gold will be sitting at 3400$ level.
Gold at a Crossroads: $100 Drop Ahead or New All-Time High?Gold is now sitting at a critical decision zone near the $3300 level — a key bank-level area. If we see a daily candle close below this level, I anticipate a minimum drop of 1,000 pips, with the first major support around the $3220–$3200 range. The $3200 level is extremely significant, and I’ll discuss its importance more in future updates if necessary.
On the flip side, if buyers step in and we get a daily close above $3300, I still believe it’s too early to jump into longs. The selling pressure remains quite obvious, and we’ve already seen multiple failed attempts to push beyond this level toward the $3500 all-time high. That tells me the orders at this level might be exhausted.
Personally, I’ll only consider a long position if we get at least a clean 4-hour candle close above $3350.
It’s going to be an exciting week ahead with high-impact data releases including ADP, Core PCE, the Federal Funds Rate — and most importantly, Friday’s NFP.
📌 Stay tuned for updates throughout the week!
Disclaimer: This is not financial advice. Just my personal opinion!!!

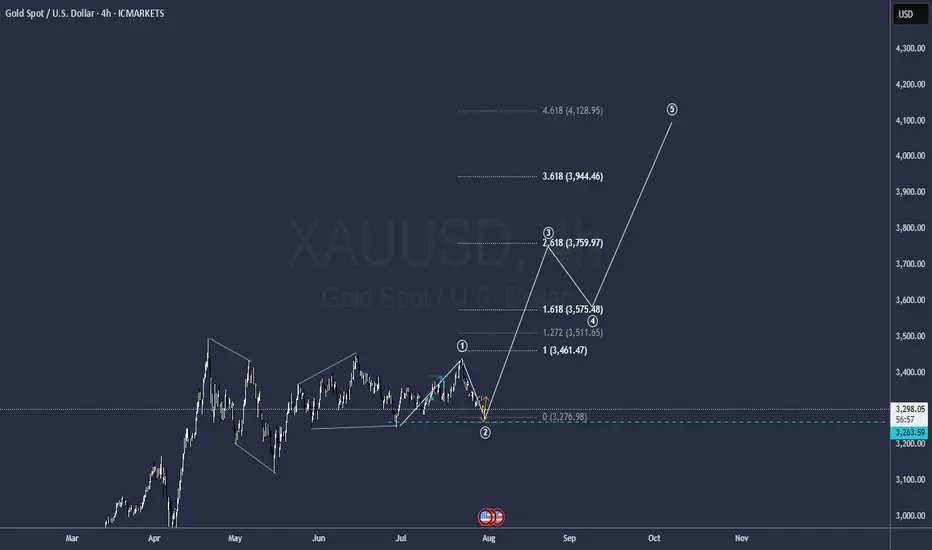
GOLD to all time highsIt is ready
a bitch wave one correction seems to be over so get ready to hit 4.000
GG
BULLISH REVERSALAfter struggling between the 2 key levels, XAUUSD showed a change of character indicating a reversal. Target is 500 pips.
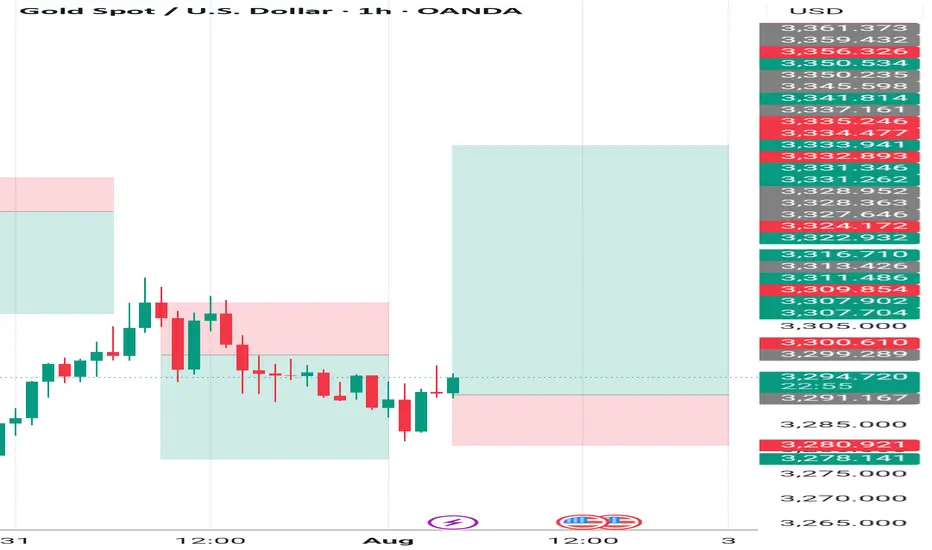
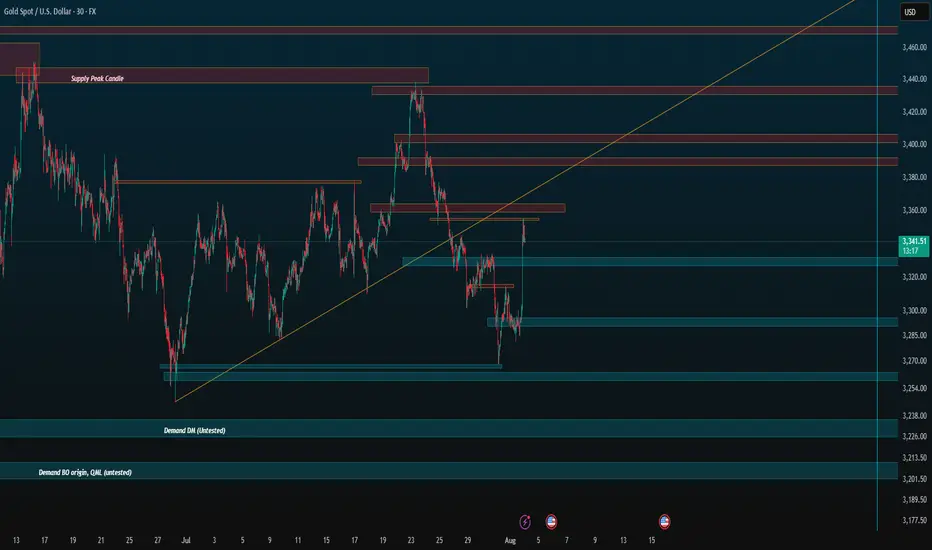
Zones for the rest of August (if no ATH)Just simple zones, ignore. I want to compare to the end of the month later.
Keep trading simple. These are the zones I made after drawing from 4H all the way to 5 minute candle for precision. I already have my own speculation but feel free to use it for your own.
Goodbye, trade safe.