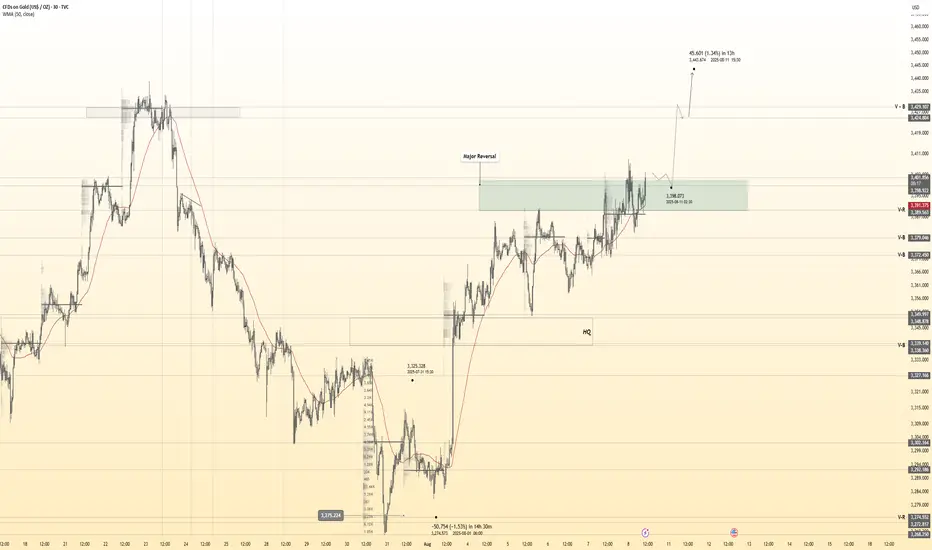
XAUUSD_1H_SellGold Analysis Short and Medium Timeframe Elliott Wave Analysis Style The gold market has completed five upward waves and is currently at the end of the upward wave. Given the formation of the corner market pattern, it could enter a reversal and decline towards $3,333.
GOLD trade ideas

GOLD (XAUUSD): Move Up Ahead?!
Friday's fundamentals made Gold very bullish during the New York session.
The price formed a high momentum bullish candle on a daily,
breaking a minor daily resistance area.
It gives us a confirmed Change of Character CHoCH and indicates
a highly probable bullish continuation next week.
I think that the price will reach 3400 level.
❤️Please, support my work with like, thank you!❤️
I am part of Trade Nation's Influencer program and receive a monthly fee for using their TradingView charts in my analysis.

Gold takes off on growing Fed rate cut expectations!Hey everyone, Alex here!
Gold is making quite an impressive climb this weekend – jumping from around 3,380 USD to 3,410 USD, a solid 300-pip move. As I’m writing this, XAUUSD is pulling back slightly, but overall, it’s still holding at elevated levels.
The main reason behind today’s price surge is the growing geopolitical and trade tensions, which are boosting safe-haven demand. Specifically, President Trump has officially imposed new tariffs on imports from several countries, adding fuel to the fire.
At the same time, U.S. jobless claims have jumped to the highest level in a month, strengthening market expectations that the Fed will need to cut interest rates.
Right now, the market is pricing in a 91% chance of a 0.25% rate cut next month. And that’s why I believe gold will continue its upward trajectory, even though the pace has slowed down a bit as prices remain elevated.
So what do you think?
Will gold keep pushing higher, or is this just a short-term pop?
💬 Drop your thoughts in the comments – I’d love to hear your take!

Gold Continues to Rise, Breaking ResistanceWeak US jobs data has increased expectations that the Fed will cut interest rates, weakening the USD and bond yields, making gold an attractive safe-haven asset. Gold has reached 3,371 USD, with US gold futures at 3,425 USD. Gold is currently facing resistance at 3,450 USD, and if broken, it could continue towards 3,500 USD.
The XAUUSD chart is moving within a clear uptrend channel with higher highs and higher lows. Gold has surpassed key support levels, including the Fair Value Gap (FVG), indicating strong buying momentum. The market is now testing the 3,450 USD resistance. If broken, the next target will be 3,500 USD.
Strategy:
Buy: If price breaks above 3,450 USD, aim for 3,500 USD.
Stop Loss: Place below 3,320 USD to manage risk.

GOLD Breakout Done , Long Setup Valid To Get 150 Pips !Here is My 15 Mins Gold Chart , and here is my opinion , we finally above 3384.00 and we have a 30 Mins Candle closure above it And Perfect Breakout , so we have a good confirmation now to can buy it and we can targeting 100 to 150 pips .
Reasons To Enter :
1- New Support Created .
2- Bullish Price Action .
3- Bigger T.F Giving Good Bullish P.A .
4- Clean Breakout .

THE KOG REPORT - NFPTHE KOG REPORT – NFP
This is our view for NFP, please do your own research and analysis to make an informed decision on the markets. It is not recommended you try to trade the event if you have less than 6 months trading experience and have a trusted risk strategy in place. The markets are extremely volatile, and these events can cause aggressive swings in price.
Following on from the FOMC KOG Report which worked quite well, we’ll stick with the same chart and for today suggest caution. It’s the first day of the month and the last day of the weekly candle. The close here for gold is important and will give us further clues to the next few months.
We’ve shared the red boxes and the red box targets are below. There is a key level above 3306-10 which will need to be breached to correct the move back up to the 3330-34 region for the weekly close. However, we now have an undercut low which is potential if there is more aggressive downside to come and that level is sitting around the 3240-50 region which for us may represent an opportunity for a swing low. We’re a bit low and stretched here to short and as we’ve already hit our target for the day so we’ll wait for the extreme levels and if hit and our indicators line up, we may take some scalps. Otherwise, as usual on these events, the ideal trade will come next week.
RED BOXES:
Break above 3290 for 3295, 3306, 3310 and 3320 in extension of the move
Break below 3275 for 3267, 3260, 3255 and 3250 in extension of the move
Please do support us by hitting the like button, leaving a comment, and giving us a follow. We’ve been doing this for a long time now providing traders with in-depth free analysis on Gold, so your likes and comments are very much appreciated.
As always, trade safe.
KOG

GOLD (XAUUSD): Technical Analysis Ahead of Trump
One of the important news for today is Trump speech during
the late New York session.
Here is my brief technical outlook for Gold ahead of that.
As we discussed on the yesterday's live stream, the price
is now coiling on a recently broken rising trend line that serves
as a vertical resistance now.
A bullish breakout of that and a daily candle close above
will provide a strong bullish confirmation and push the prices to 3430.
Alternatively, very bearish news today may trigger a retracement
to an underlined horizontal support.
Let's see how the market is going to react tonight.
❤️Please, support my work with like, thank you!❤️
I am part of Trade Nation's Influencer program and receive a monthly fee for using their TradingView charts in my analysis.

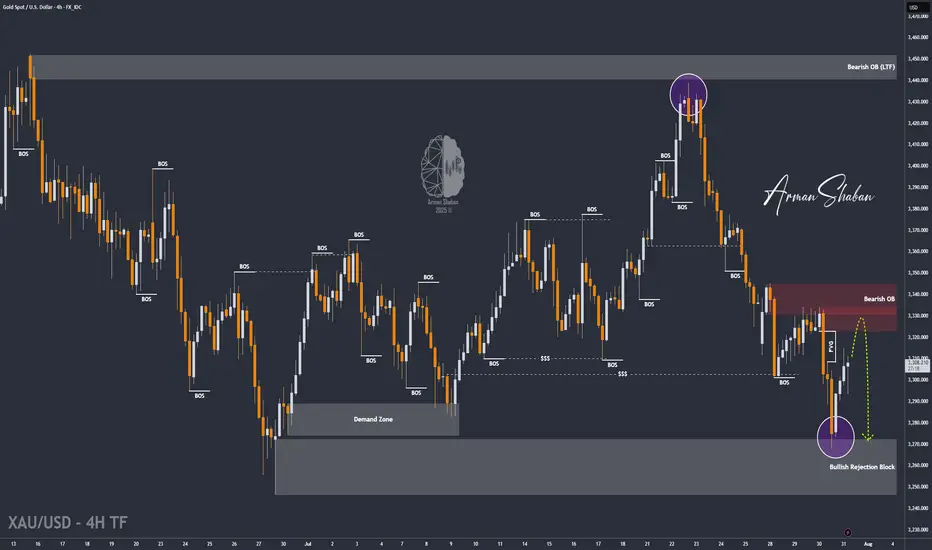
XAU/USD | Next Key Zone: Watch for Rejection at $3334! (READ)By analyzing the gold chart on the 4-hour timeframe, we can see that, just as expected, the price dropped from $3310 to $3288 in the first leg, where it hit a demand zone and bounced up to $3305, delivering a 170-pip rally. The main bearish move from $3333 to $3288 yielded 450 pips, bringing the total return on this analysis to over 620 pips!
In the second phase, gold dropped sharply again to $3268, and once more found demand, currently trading around $3307. If the price holds above $3294, we could expect further upside toward the $3322–$3334 zone. Once gold reaches this area, a strong bearish rejection is likely, with a potential return of 250 to 400 pips.
All key supply and demand levels are marked on the chart — make sure to monitor them closely and study the chart in detail. Hope you’ve made the most of this powerful analysis!
Please support me with your likes and comments to motivate me to share more analysis with you and share your opinion about the possible trend of this chart with me !
Best Regards , Arman Shaban
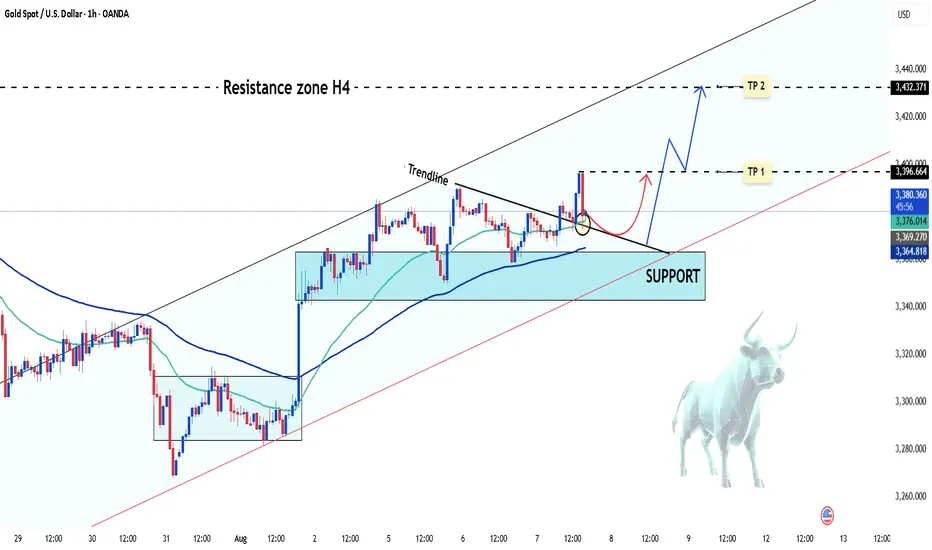
XAU/USD Short-Term Buy Opportunity ? XAU/USD has recently formed a bullish pattern, currently trading around 3,380 USD and showing an increase of more than 10 USD for the day.
From a technical analysis perspective, the price is following an upward trendline and showing signs of momentum accumulation. The area around 3,350 USD provides strong support, which could establish a solid base for further upward movement.
Key Levels:
Resistance (Target 1): 3,396 USD
Resistance (Target 2): 3,432 USD
To consider a short-term buy, it’s important to monitor price action around the support levels and wait for confirmation t
Good luck!
Gold 30Min Engaged ( Bullish Entry Detected )Time Frame: 30-Minute Warfare
Entry Protocol: Only after volume-verified breakout
🩸Bullish Movement From now price - 3401
➗ Hanzo Protocol: Volume-Tiered Entry Authority
➕ Zone Activated: Dynamic market pressure detected.
The level isn’t just price — it’s a memory of where they moved size.
Volume is rising beneath the surface — not noise, but preparation.
🔥 Tactical Note:
We wait for the energy signature — when volume betrays intention.
The trap gets set. The weak follow. We execute.
Latest Gold Price Update TodayHey everyone! Let’s take a closer look at what’s happening with gold today.
Over the past week, the global gold market experienced dramatic swings. Prices tumbled following cautious remarks from Federal Reserve Chair Jerome Powell, only to rebound sharply after disappointing U.S. employment data.
On Wednesday, the Fed held interest rates steady, and Powell stated, “We haven’t made any decisions for September.” Though brief, that statement hinted that a rate cut isn’t guaranteed — dashing investor hopes and sending gold to its lowest level in four weeks.
But by Friday, the narrative flipped. A weaker-than-expected jobs report triggered a powerful rally. Within just two minutes of the data release, gold surged by $30, closing the week at $3,361 — a gain of over 2% in a single day.
These moves highlight just how sensitive gold is to Fed signals. A slight shift in tone or a single data point can spark major volatility.
From a technical perspective, falling U.S. Treasury yields have allowed XAU/USD to regain bullish momentum, as the market reassesses Fed rate expectations after the weak NFP print. If gold successfully breaks out of its current channel after a short-term pullback, the next target could be $3,400 — or even higher.
Do you agree with this outlook? Share your thoughts in the comments.
Good luck and happy trading!
GOLD (XAUUSD): Detailed Support & Resistance Analysis
Here is my fresh support & resistance analysis for Gold.
Vertical Structures
Vertical Resistance 1: Rising trend line
Horizontal Structures
Support 1: 3327 - 3344 area
Support 2: 3246 - 3275 area
Resistance 1: 3431 - 3451 area
The price is currently coiling on a trend line.
Your next bullish confirmation will be its breakout.
❤️Please, support my work with like, thank you!❤️
I am part of Trade Nation's Influencer program and receive a monthly fee for using their TradingView charts in my analysis.

GOLD Struggles Near 3400 ResistanceGOLD Struggles Near 3400 Resistance
Gold is facing strong resistance around 3400, and the price is hesitating to take clear direction.
Although it looks like gold wants to move higher, selling pressure is holding it back. The price action is forming a wedge pattern, which typically signals a potential drop.
If this pattern plays out, gold could fall.
In my view, this bearish setup will only be invalidated by major market manipulation, because from a broader perspective, there’s no fresh technical or fundamental reason for gold to push higher despite that the bigger trend is bullish.
The real risk isn’t just technical or macro—it’s that gold remains one of the most manipulated assets in the market.
If the price breaks below the resistance zone shown on the chart, the chances of a deeper drop will increase.
Targets: 3350, 3330, and 3294
I'm still more focused on a bearish movement.
You may find more details in the chart!
Thank you and Good Luck!
PS: Please support with a like or comment if you find this analysis useful for your trading day

Gold Surges on Weak NFP Hello everyone, what’s your take on XAUUSD?
Gold prices soared at the end of the last session and are now trading around $3,380. This sharp rise followed a weaker-than-expected U.S. Non-Farm Payrolls (NFP) report, which shifted market sentiment toward expectations that the Fed may delay interest rate cuts. As a result, the U.S. dollar weakened and demand for gold as a safe haven surged.
Technically, gold appears to be forming a cup and handle pattern, with the first resistance target at $3,400, followed by $3,435.
What do you think? Could this rally continue? Let us know in the comments!

GOLD (XAUUSD): Bullish Price Action after BreakoutFollowing a breakout of a significant horizontal resistance, 📈Gold retested this level and formed an ascending triangle on the 4-hour chart.
A bullish breakout above its neckline serves as a crucial intraday confirmation of strength of the buyers, suggesting a potential rise to at least 3430 support level.

GOLD → The market is waiting for NFP. What could happen?FX:XAUUSD is bouncing off resistance at 3310, confirming the upper limit of the new trading range. The dollar continues to rally, but the market as a whole is stagnating ahead of upcoming news—NFP is coming up!
Gold is consolidating at monthly lows around $3268, awaiting key US labor market data (NFP). Trump's new tariffs (10% globally, 35% for Canada, 39% for Switzerland) have boosted demand for the dollar, putting pressure on gold. Markets are waiting for NFP: forecast +110K jobs, unemployment 4.2%. Weak data (<100K) → gold may rise to $3400. Strong (>150K) → the dollar will strengthen, gold will continue to fall. The probability of a Fed rate cut in September is <50%.
Based on yesterday's data, I would cautiously suggest that NFP will be in the range of 125K–145K, slightly above the consensus (110K). This will play into Trump's hands (I think you understand what I mean...).
Resistance levels: 3300, 3310, 3320
Support levels: 3287, 3268, 3255
The news has a negative nuance — unpredictability. Be careful.
Technically, based on the data we have at the moment, I would assume that the market may test resistance at 3300-3310 before a possible pullback to the specified support. BUT! Unpredictable data could turn the game around, and in that case, if the dollar falls, gold could start to rise.
Best regards, R. Linda!

XAUUSD Continuation fallowing PullbackGold is currently retesting the support zone and showing signs of potential upside movement. The market is reacting to expectations of Fed policy easing, which is supporting gold prices. Upcoming ISM PMI data is a key catalyst — stronger-than-expected figures could cause volatility.
Gold declined from the 3374 level, showing a false breakout to the downside.
Key support is forming around 3360 — if broken, a bearish trend may resume at 3342nIf the 1H candle closes above 3370, this could indicate renewed bullish momentum.
Resistance to watch: 3400 and 3420.
You May find more details in the chart.
Ps; Support with like and comments for better analysis.

XAU/USD | Gold at Make-or-Break $3400! BUY or SHORT ? (READ)By analyzing the gold chart on the 4-hour timeframe, we can see that, as expected from the previous analysis, the price began to rise and gained over 250 pips, reaching the $3409 supply zone. Upon hitting this key level, gold faced selling pressure and dropped more than 290 pips down to $3380. When it returned to this important level, strong buying stepped in again, and it is now trading around $3391.
The total return from this analysis so far has been over 540 pips. If gold manages to hold above $3400, the next upside targets will be $3409, $3416, and $3419. Keep an eye on the $3419–$3434 zone for potential reactions. Show some strong support for this analysis, friends, and stay tuned for direct trade setups based on it!
THE Previous Analysis :
Best Regards , Arman Shaban

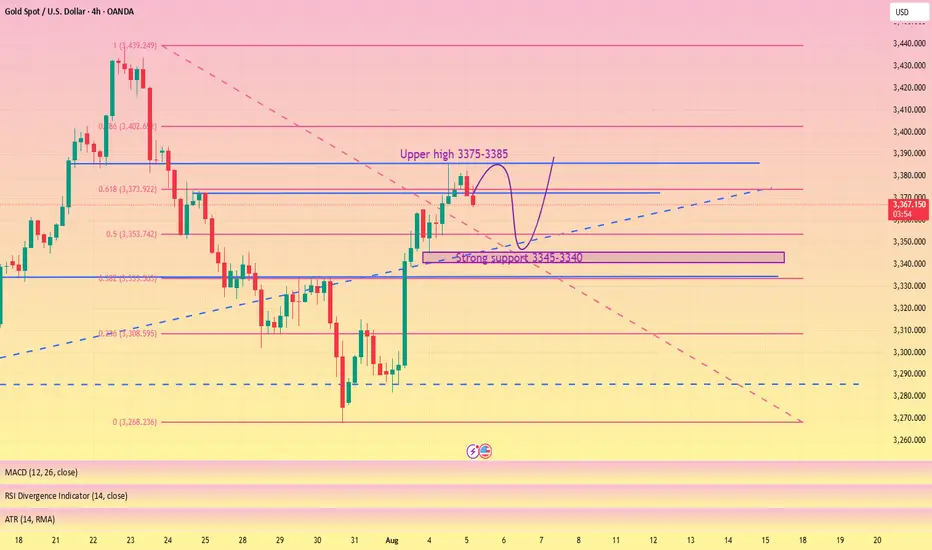
Wait for a pullback and then test the previous high#XAUUSD
The gold market closed positively on the daily chart, with strong support near 3345-3340 below. The market trend is still dominated by bulls,🐂 but the daily moving average support is too far from the high point. It is not ruled out that it may retreat to the moving average support near 3345-3340,📊 and then rise again.🚀
From the monthly chart, 🌙although the monthly chart closed positive, the market is generally converging at a high level. Upper resistance remains, and a breakout is unlikely without breaking through this resistance level (no further discussion will be given).📉
Judging from the weekly chart, the Bollinger Bands have shrunk, and the MACD indicator has formed a death cross with large volume, indicating weak fluctuations at the weekly level.😩
Judging from the daily chart, 📊the current technical indicators are tending to the zero axis, and the rapid upward correction of the smart indicator indicates that the price fluctuation tends to rebound. The current focus is on yesterday's high around 3385. It is expected to break through 3430. The lower support Bollinger band middle track and moving average tend to stick together around 3346-3340.🌈
Judging from the hourly chart and 4H chart, 📊the overall rhythm tends to fluctuate and fall. The short-term pressure from above is around 3375-3385, and a break above will definitely lead to an increase.📈
On the whole, pay attention to yesterday's NY starting point near 3365-3360, and the strong support below is 3346-3340. The hourly and 4H charts tend to fluctuate and fall, so for short-term trading we need to short on rallies. 📉
Intraday trading suggestions are as follows:
1. Consider going long currently around 3365-3360📈, targeting 3374-3380🎯. If it breaks through, look for 3400.
2. Go long if it retraces below 3355-3340, targeting 3375-3385. Wait for further adjustments.🐂
3. If the price first reaches the resistance level of 3375-3385 and holds, consider going short with a small position and anticipate a pullback towards 3365-3355.🐻
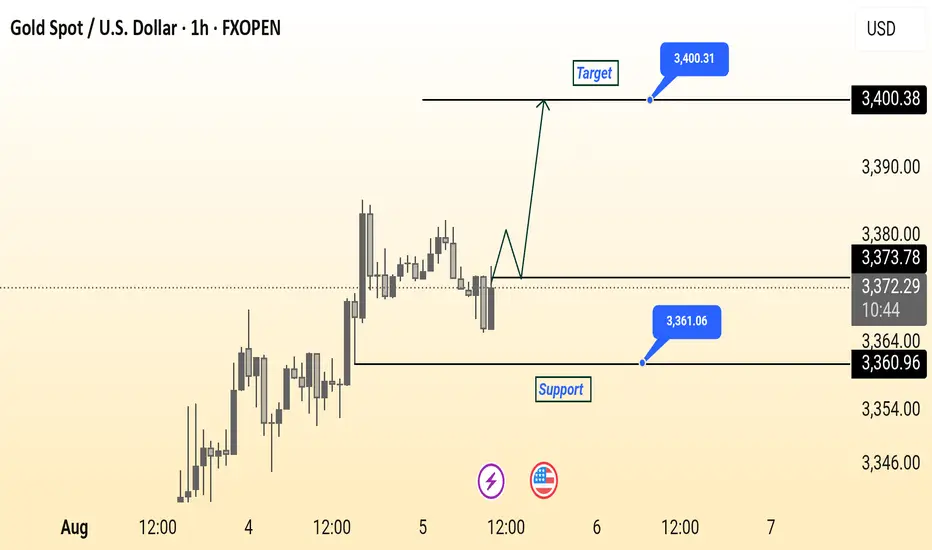
Gold Spot (XAU/USD) 1-Hour Chart Analysis – Potential Upside TowThis 1-hour chart for Gold Spot (XAU/USD) from FXOPEN shows a key support level at $3,360.96 and a potential target at $3,400.31. The current price is hovering around $3,372.04, just below the minor resistance of $3,373.78. A bullish breakout from this zone could initiate a move toward the target, as illustrated by the projected upward path. The support zone marked in blue suggests a strong buying interest that could act as a rebound area if prices dip. Watch for price action confirmation near support for potential long entries.
XAUUSD: Triangle Completion Hints at Breakout PotentialOn the 1H timeframe, gold (XAUUSD) is moving within a narrow ascending channel and has recently formed a clear contracting triangle correction pattern (ABCDE). This structure suggests the market is consolidating before a potential breakout to the upside.
Detailed Analysis:
- Elliott Wave Structure:
Price action appears to have completed an ABCDE triangle, a common ending pattern before a breakout wave begins.
The conclusion of wave E implies a possible impulsive move is about to start in the direction of the prior trend – in this case, bullish.
- Trendline & Channel:
Price continues to respect a well-defined ascending channel formed since August 1st, indicating a sustained bullish structure.
The current price (3,398 USD) is nearing the upper boundary of this channel. A successful breakout could push price toward the 3,410–3,415 resistance area.
- Fibonacci Retracement:
The previous correction found solid support around the 0.618 Fibonacci level (~3,360 USD), which serves as a key buy zone if price retraces.
This area is ideal for a buy-the-dip opportunity in case of a pullback.
- EMA & RSI Indicators:
Price remains above the 50-period EMA, supporting the bullish bias.
RSI is trending above 50 and not yet in overbought territory, suggesting momentum still favors the bulls.
Key Support and Resistance Levels:
3,415 – 3,420: Major Resistance -Previous swing high, profit-taking zone
3,400 – 3,405: Minor Resistance - Channel top, potential breakout trigger
3,360 – 3,365: Key Support - Fib 0.618 zone, watch for bullish reaction
3,330
Deep Support
Strong demand zone from H4 chart
Suggested Trading Strategies:
- Strategy 1 – Breakout Buy:
Entry: On confirmed breakout above 3,405 with strong volume.
SL: Below 3,390
TP1: 3,415 | TP2: 3,420+
- Strategy 2 – Buy the Dip:
Entry: On pullback to 3,360–3,365 support zone.
SL: Below 3,350
TP: Return to 3,405–3,415 zone
- Risk Note: Price is currently near resistance – avoid chasing at the top of the channel. Only enter after breakout confirmation or wait for a retest of support for better R:R setups.
Conclusion:
Gold is showing strong potential for a bullish breakout following the completion of a classic triangle correction pattern. Focus on price action around the 3,400 level for intraday trading opportunities.

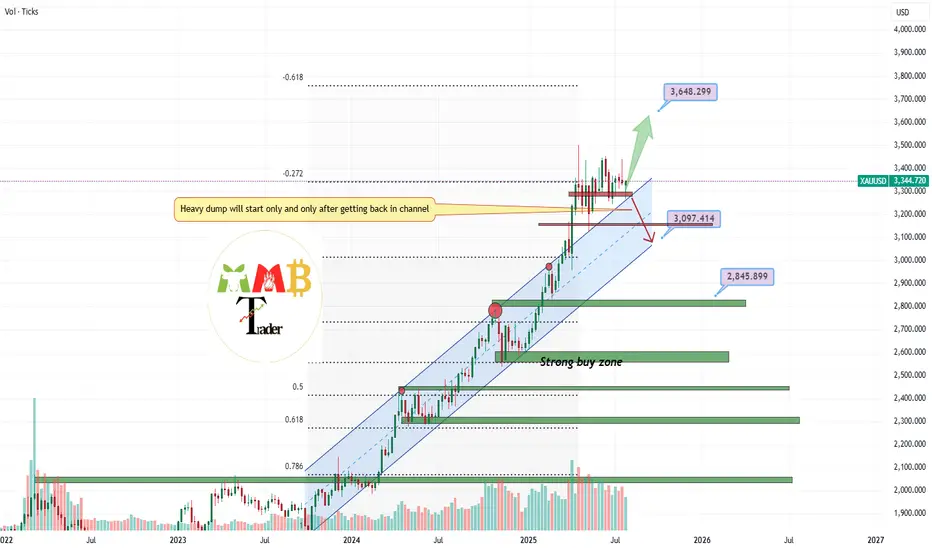
GOLD channel breakout retest complete more pump ahead As we can see the blue channel resistance is gone and also now it turn to strong and valid support and retest is also complete and gold is now targeting 3600$ easy.
DISCLAIMER: ((trade based on your own decision))
<<press like👍 if you enjoy💚
Gold (XAUUSD) – Waiting for Buy Opportunity Near Range SupportWe're currently inside a range and approaching its lower boundary.
There was a chance to go long a bit lower, but there’s still time — the highlighted zone looks like a solid area to consider longs.
We’re patiently waiting for price to enter the zone and give us a valid buy signal.
No rush. Let the market come to us
