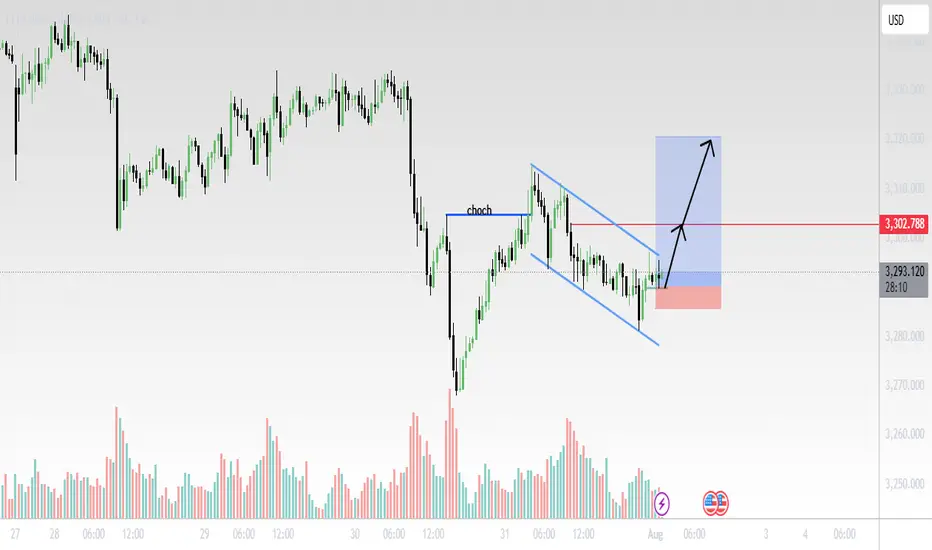
Gold (XAU/USD) 30-Min Chart Analysis – August 1, 2025Structure Summary:
CHoCH (Change of Character) confirmed after price broke the previous lower high, signaling a potential trend reversal.
Price has since formed a bullish falling wedge (blue trendlines), a classic continuation pattern after CHoCH.
Volume spikes during reversal attempts suggest accumulation.
Trade Setup:
Entry: Breakout above wedge resistance.
Stop Loss: Below recent swing low near 3280 area (red zone).
Target: Around 3315–3320 zone (blue box), aligned with previous demand-turned-supply area.
📌 Outlook:
Bullish breakout expected if momentum sustains.
Watch for confirmation candle with volume above the wedge.
Clean R:R setup with tight SL and wide TP potential.
📊 Technical Bias: Bullish
❗Risk Management: Adjust position size based on lot exposure and account size.
GOLD trade ideas
Non-farm payrolls are coming. Will it trigger the market?On Thursday, the US dollar index briefly rallied after the Federal Reserve's favorite inflation indicator unexpectedly rebounded, crossing the 100 mark for the first time in two months. This marked the sixth consecutive trading day of gains and the first monthly gain since 2025.
Spot gold rebounded as risk aversion lingered amid uncertainty surrounding Trump's tariff deadline, reaching a high of around $3,315, but its intraday gains narrowed after the release of the PCE data.
The dollar has already firmly established itself above the 100 mark on the daily chart, so the next target is likely to be between 101.5 and 102.0. Currently, support levels on the daily chart are visible at 99.5 and 99.0.
The gold market is currently consolidating in the 3315-3275 range. However, if the dollar rises again, Quaid believes gold prices could fall below 3275.
On the daily chart, if it falls below 3275, the price would likely be around 3250. If 3250 falls below, the market could test 3200. However, the possibility of a consolidation between 3315 and 3275 remains undisputed.
Before the release of the non-farm payroll data, scalping within this consolidation range is advisable. However, the risk is relatively high, so please take profits in time.

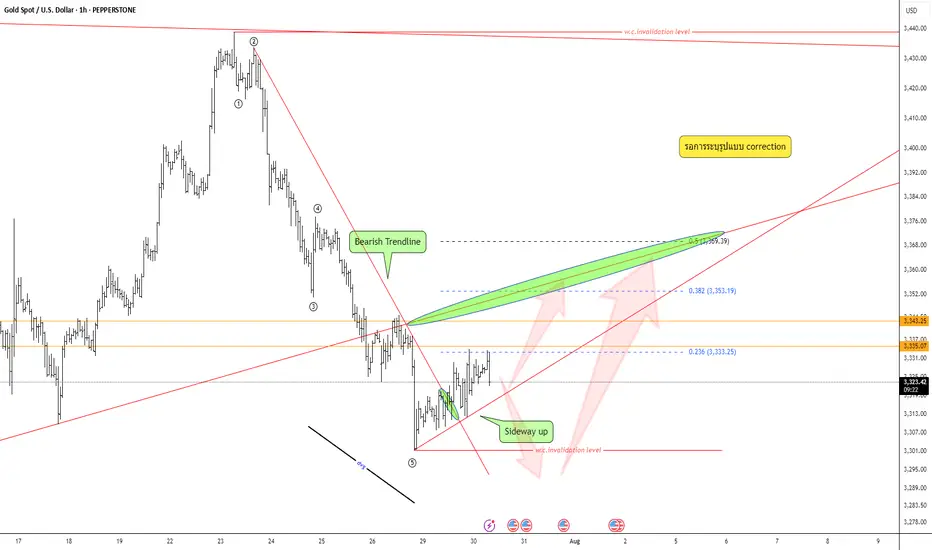
Keep an eye on the correction pattern —Quick Take:
- Strong bearish move, but wave structure still unclear — not a confirmed impulse.
- Bear trendline has broken; market now leaning toward sideways-up.
- Divergence is visible.
Plan:
Wait for correction pattern → confirm with your system → execute only with full data and strict risk management.
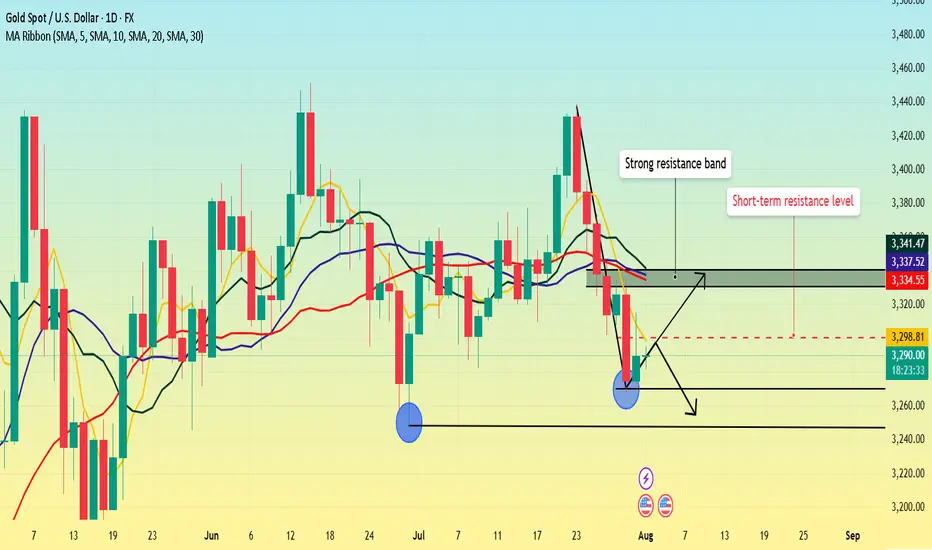
Non-farm payrolls are coming. What's the gold trend?Gold fell sharply on Wednesday, but Thursday's market didn't continue the downward trend as some investors expected. Instead, it showed a trend of rising and then falling.
From the daily perspective, we first need to focus on the resistance level near 3300 where the 5-day moving average is located. This position is not only a short-term technical resistance, but also reflects the market's psychological expectations to a certain extent. If prices can successfully break through this level and stabilize above it, it will indicate that bullish momentum is strengthening, potentially boosting market sentiment. At this point, the next resistance area to watch is the 3330-3340 range. This area converges the 10-day, 20-day and 30-day moving averages, forming a strong resistance band.
As for the support below, the primary focus is Wednesday's low of 3268. However, if this level is lost and the price continues to fall, the next support area will be around 3245, which is the previous low.
Trading strategy:
Short around 3300, stop loss at 3310, profit range 3280-3260.

XAUUSD – Downtrend Confirmed, Bears in ControlOn the H4 timeframe, gold has completely broken its short-term uptrend structure and formed a series of lower highs and lower lows. Every bounce is rejected at the strong resistance zone of 3,326 – 3,333 USD, confirming the clear downtrend.
Although the recently released Core PCE index was lower than expected, this is not enough to drive a recovery as other data, such as the Employment Cost Index and statements from the Fed, still show persistent inflationary pressure. Therefore, the monetary policy remains hawkish, causing money to flow out of gold.
Currently, the price is approaching the critical support zone of 3,247. If this level is broken, the scenario of further declines to 3,192 is entirely possible.


Gold Intraday Trading Plan 8/1/2025Although yesterday's retracement is a bit too deep, I am still bearish in gold in medium term as long as 3333 resistance is not broken. Therefore, I will still look for selling opportunities today.
Currently daily is in green bar while smaller timeframe shows bearish signs. If there is a double top formed near 3300, I will sell toward my weekly target at 3255.
Gold (XAUUSD) Buy Setup – 30m Gold (XAUUSD) Buy Setup – 30m Chart
I am in a buy from 3307. Price is holding the support zone 3326–3334.
Looking for a bounce towards 3338 and 3375.
Stop loss below 3290.

GOLD BUYGold maintains its daily gains around $3,300
After retreating markedly on Wednesday, Gold rebounds moderately and remains positive at about $3,300 per troy ounce on Thursday. The precious metal’s rebound comes in response to the daily retracement in US yields across the curve and the so far irresolute price action in the Greenback
The US Federal Reserve kept its benchmark interest rate unchanged for the fifth consecutive meeting, in a range of 4.25% to 4.5%, despite intense pressure from US President Donald Trump and his allies to lower borrowing costs. The decision, however, met opposition from Fed Governors Michelle Bowman and Christopher Waller. This was the first time since 1993 that two governors had dissented on a rate decision.
In the accompanying monetary policy statement, the committee had a more optimistic view and noted that the economy continued to expand at a solid pace. Adding to this, Fed Chair Jerome Powell said during the post-meeting press conference that the central bank had made no decisions about whether to cut rates in September. This comes on top of the upbeat US macro data, and lifted the US Dollar to a two-month high.
Automatic Data Processing reported that private payrolls in the US rose by 104,000 jobs in July, following a revised 23,000 fall recorded in the previous month. Adding to this, the Advance US Gross Domestic Product (GDP) report published by the US Commerce Department showed that the economy expanded at a 3.0% annualized pace during the second quarter after contracting by 0.5% in the previous quarter
SUPPORT 3,346
SUPPORT 3,328
SUPPORT 3,309
RESISTANCE 3,283
RESISTANCE 3,273

GOLD SHORT10 year bullrun is followed by a shorter term bearmarket. Gold is starting to lose its strength, which is a clear sign of weakness and the beginning of a bearish reversal.

XAUUSD: BUYThere are some good trading opportunities in the market. That's when to buy. Gold prices haven't fallen further since falling back to 3390. There's no further negative news. Therefore, there won't be a significant short-term decline. Our focus will be on tomorrow's non-farm payroll data update. This is a crucial factor that can cause gold prices to rise or fall significantly in the short term.
I'll update you with real-time buy and sell opportunities. This is based on research from the Swing Trading Center. It's highly authoritative. Don't miss out! Remember to stay tuned.
XAUUSD: BUY 3292-3282 TP 3320. SL 3265

GOLD - WAVE 5 BULLISH TO $3,734 (UPDATE)Quick & simple ‘Elliott Wave Theory’ analysis for our Gold ALTERNATIVE SCENARIO.
⭕️Complex 5 Sub-Wave Correction.
⭕️Buyers Remain Above $3,245.
⭕️Pending LQ at $3,500.

XAUUSD-4HXAU/USD – 4H Technical Analysis
Gold (XAU/USD) is currently testing the upper boundary of a descending channel on the 4-hour chart. The overall trend remains bearish, and this resistance zone may act as a potential reversal point.
If price fails to break above the channel resistance, a downward move toward the lower boundary is likely.
🔹 Trend: Bearish
🔹 Entry Zone: Near channel resistance
🎯 Target: 3250
🛑 Stop-Loss: 3221
Traders should watch closely for bearish price action signals at the top of the channel. A confirmed rejection could offer a shorting opportunity.

Repeated pattern?We have to wait and see whether gold is going to repeat the same pattern or if this time it manages to rise from that level.

Gold is faking a bullish trapWe are gonna go down to the 3294 level before we see a bounce up. The 3294 level is gonna show up as a strong support to push trough the 3345 area.

GoldGold Giving pulllback and then again go sell this time target is 3247..if this level breaks and any close below h4 it will further downside

XAUUSD 4H AnalysisGold is currently in a clear downtrend after failing to hold above the mid-channel. Price is retracing into a potential short zone with confluence from the moving average bands.
Fibonacci Retracement: Price is reacting near the 38.2% level (3,318).
Downside Fibonacci Targets:
1️⃣ 3,249.36 (38.2%)
2️⃣ 3,228.11 (61.8%)
3️⃣ 3,193.73 (100%)
As long as the price stays below the red resistance zone, the bearish momentum is likely to continue toward the lower Fibonacci targets. A break above 3,339 would invalidate the short setup.

Xauusd sell ideas Let's see how this goes on news release am expecting a retest of that zone as well entry

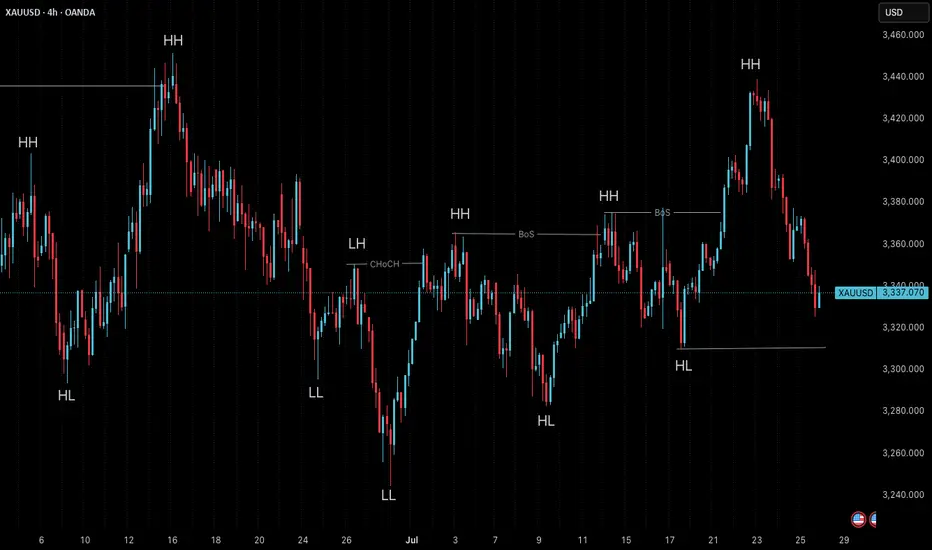
Market Structure is Not Strategy — It’s Your Starting Point“The chart doesn’t hide anything. But your mind does.”
Before any indicator, setup, or signal… comes structure.
🔍 What is Market Structure?
At its core, market structure is the sequence of higher highs (HH) and higher lows (HL) in an uptrend, or lower lows (LL) and lower highs (LH) in a downtrend.
It is the skeleton of price .
Everything else — entries, zones, signals — is just clothing.
If you can’t see the skeleton, you’re reacting to noise.
🎯 Why It Matters:
It’s not a signal. It’s context .
It tells you whether you’re trading with the market or against it .
It defines where your patience begins — not where your entry is.
Market structure helps you let go of the urge to chase. It brings order to the chaos.
🧩 Key Components to Track:
Break of Structure (BoS): Confirms trend continuation
Change of Character (ChoCH): Signals a potential reversal
Swing Points: Define the intent behind price moves
Liquidity Sweeps: Often mask real structure beneath short-term traps
🛑 Common Mistake:
Most traders jump straight to the setup without asking the most important question:
“Where am I in the structure?”
They try to buy a pullback — in a downtrend.
They try to fade a move — right before continuation.
They chase candles — instead of waiting for alignment.
That’s not strategy. That’s stress.
🛠 Tip to Practice:
Use this simple framework to build clarity:
Start from the H4 chart — this gives you the broader directional bias
Drop to M15 — here’s where structure begins to form tradeable setups
Finally zoom into M1 — this is where confirmation happens before entry
Ask yourself:
Where did the last BoS or ChoCH happen on each timeframe?
Is M15 aligning with H4 intent — or contradicting it?
Did you enter after M1 confirmation , or based on impulse?
You don’t need to predict price. You need to align with it.
🪞 Final Thought:
Structure isn’t strategy.
It’s the mirror that shows what’s real before your bias speaks.
When you master structure, you stop forcing trades — and start flowing with them.
💬 Want more like this?
If this post resonated with you — drop a comment below.
Let me know what you'd like to dive deeper into — price action, gold setups, market structure, or the psychology behind your trades.
I’ll build future tutorials based on what matters to you.
📘 Shared by @ChartIsMirror
Gold (XAU/USD) Analysis:Following yesterday's Fed statements regarding the economic impact of tariffs and the decision to keep interest rates unchanged, gold prices dropped to $3,268, before rebounding today to retest the $3,310 zone. The short-term trend remains bearish.
1️⃣ A break and hold below $3,300 may push the price toward $3,280, and potentially $3,260.
🔻 A confirmed break below $3,260 could lead to a deeper decline toward a strong support zone near $3,245.
2️⃣ On the other hand, if bullish momentum appears and the price breaks above $3,310, it may open the path to $3,330 — a key level that could trigger a bearish rejection.
📈 However, if the price holds above $3,330, the next target would be $3,350.
⚠️ Disclaimer:
This analysis is not financial advice. It is recommended to monitor the markets and carefully analyze the data before making any investment decisions.

GOLD Will Move Lower! Sell!
Here is our detailed technical review for GOLD.
Time Frame: 9h
Current Trend: Bearish
Sentiment: Overbought (based on 7-period RSI)
Forecast: Bearish
The market is testing a major horizontal structure 3,337.68.
Taking into consideration the structure & trend analysis, I believe that the market will reach 3,280.02 level soon.
P.S
The term oversold refers to a condition where an asset has traded lower in price and has the potential for a price bounce.
Overbought refers to market scenarios where the instrument is traded considerably higher than its fair value. Overvaluation is caused by market sentiments when there is positive news.
Disclosure: I am part of Trade Nation's Influencer program and receive a monthly fee for using their TradingView charts in my analysis.
Like and subscribe and comment my ideas if you enjoy them!

GOLD USDHI GUYS.
here we have daily path.
i expect pullback, retest to form double top h4, h2, h1 at number 3,
then we sell to clear numer 3 downwards.
currently its a buy . details on h4 chart
