BUY GOLD XAUUSD @ a critical demand zone . Bulls accumulating to start the moon journey. target 3400-3450 , stoploss 3290
GOLD trade ideas

Gold: ADP, Fed & Key Resistance Gold has been range-bound today—let’s focus on the impact of the ADP data and Fed rate decision ⚠️.
Key resistance lies around 3345-3350 📍: a breakout could fuel further upside 📈, while a rejection may trigger an oscillating pullback 📉
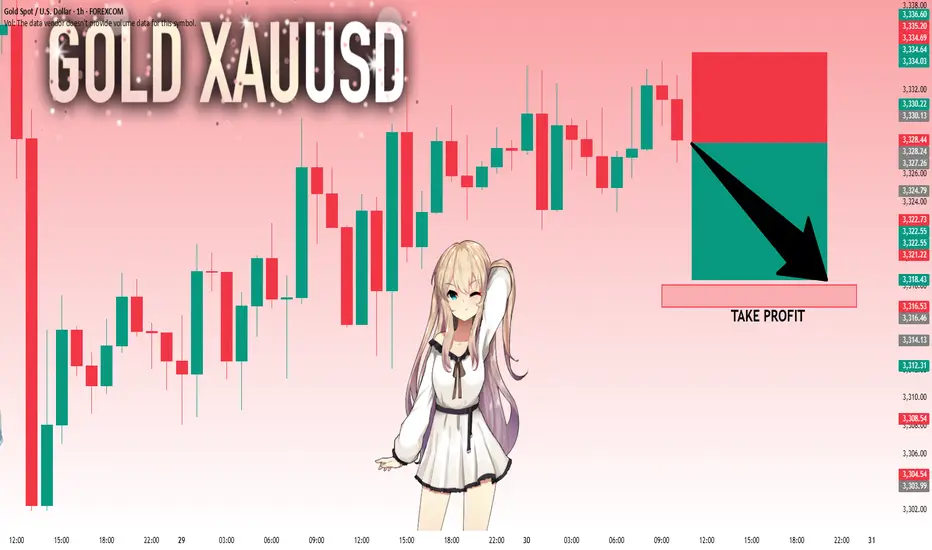
⚡️⚡️⚡️ XAUUSD ⚡️⚡️⚡️
🚀 Buy@ 3325
🚀 TP 3333 - 3339 -3344
Daily updates bring you precise trading signals 📊 When you hit a snag in trading, these signals stand as your trustworthy compass 🧭 Don’t hesitate to take a look—sincerely hoping they’ll be a huge help to you 🌟 👇

XAUUSD ideaWe are waiting for our asset to reach our action zone, and based on the reaction, we’ll decide on our next moves.ALWAYS WAIT FOR A CONFIRMATION TO SEE IF THE PRICE VALIDATES THE ZONE.and you what is your vision of the EURUSD its interests me! i wait you in the commentary

Buying GoldBought gold from here. Support is 3,280 based on Timeframe. Targeting the highs of 3,452
Tight stoploss @ 3,298
Put-Call Ratio is bullish.
COT Data on gold for the past 2 weeks continued to be bullish.

XAU / USD 4 Hour ChartHello traders. We have news thins morning, we have Trump and Powell this afternoon. I am not trading the news, but I did mark the area we need to break out of. I can see this going either way. I will check back later. Be well and trade the trend. Beware the volatility and trade safely today. Big G gets a shout out.

Gold Down After Taping 1H OB. This is my view. Not Advice. I,m Bearish Side. Because Also Have PDH Where resting Alot Liquidity, After Sweep gold tap on and down.

XAUUSD BUY AND SELL LEVELSGold (XAUUSD) is currently showing key movement potential as it reacts to major levels. We are watching closely for price action near important support and resistance zones to identify the next trade setup.
📌 Stay alert for possible retracements or breakouts. Both buying and selling opportunities may arise depending on market reaction.
Trade with confirmation and always manage risk wisely.


GOLD: Next Move Is Down! Short!
My dear friends,
Today we will analyse GOLD together☺️
The market is at an inflection zone and price has now reached an area around 3,328.24 where previous reversals or breakouts have occurred.And a price reaction that we are seeing on multiple timeframes here could signal the next move down so we can enter on confirmation, and target the next key level of 3,318.05..Stop-loss is recommended beyond the inflection zone.
❤️Sending you lots of Love and Hugs❤️
Gold--sellWell, gold is having an interesting moment. It is currently correcting in a downtrend and is holding steady. I don't feel any strength in its trend. How far will it correct to the specified area?

GOLD (XAUUSD) Analysis : Major Break + Bullish Setup + Target🟩 Today’s GOLD Analysis based on Volume Behavior, Smart Money Traps & Market Structure (MMC)
🔍 Chart Breakdown and MMC Concepts Explained:
1. Preceding Downtrend – Smart Money Trap Initiated
The chart begins with an extended downtrend, marking significant bearish pressure. However, deeper into the move, we notice price entering a Volume Absorption (VA) Zone — a key MMC signal where institutional orders quietly absorb aggressive retail selling.
This Volume Absorption Zone is highlighted on the left of the chart.
Smart money quietly positions longs here while inducing panic-selling from retail traders.
Wicks and indecision candles show early signs of sell exhaustion.
2. QFL Breakdown & Liquidity Sweep
The breakdown from the QFL (Quick Flip Level) is another hallmark of MMC behavior. The market intentionally breaks previous lows to trigger stop-loss clusters — known as a liquidity sweep or stop-hunt.
Price aggressively drops to a well-marked demand zone.
Massive bullish reaction from this zone confirms that smart money has completed accumulation.
The QFL move is not a true breakout, but a trap, designed to mislead retail into chasing shorts.
3. Demand Zone Reaction – Shift in Momentum
Price finds support at the demand zone (highlighted in green) and starts forming higher lows. This transition from lower lows to higher lows is a structural confirmation of market reversal.
Buyers have regained control.
Large bullish candles and wick rejections at key levels signal institutional entry.
4. SR Interchange Zone – Key MMC Confirmation
One of the most important zones on this chart is the SR Interchange area.
This level was previously resistance and is now acting as support — a concept known as support-resistance flip.
MMC teaches us that this is where smart money re-tests the breakout zone to trap late sellers and confirm the trend.
This zone is reinforced by:
Previous rejections
Retest with wicks
Alignment with ascending trendline support
5. Minor & Major Resistance Levels
Currently, price is attempting to break above a minor resistance at ~$3,330–3,332.
If it breaks, the next major target lies at the ~$3,340–3,345 level, marked on the chart.
This zone is crucial for short-term targets and may act as a profit-taking zone for early bulls.
Once this major resistance is cleared, the trendline projection suggests a continuation toward higher highs.
📐 Trendline Analysis
An ascending trendline is supporting price action. Each bounce off this line has led to higher lows — a clear sign of bullish intent.
Trendline + SR Interchange = Confluence zone
Traders should watch for bullish engulfing candles or strong wick rejections at this trendline area for re-entry or add-ons.
🧠 MMC Strategy Interpretation (Mirror Market Concepts)
This chart perfectly follows the MMC logic:
Trap retail sellers during the downtrend.
Absorb their volume at a key zone (Volume Absorp).
Sweep liquidity below QFL level.
Reverse structure with a shift to higher highs and higher lows.
Interchange SR zone to test buyers' strength.
Continue trend post-confirmation with breakout above resistance.
This is the classic "trap-to-trend" sequence smart money uses repeatedly in gold and other volatile markets.
✅ Trade Setup Summary:
Bias: Strongly Bullish (based on market structure shift)
Entry #1: Pullback into SR Interchange (ideal if price rejects 3,326–3,328)
Entry #2: Break and retest of Minor Resistance (3,332–3,334)
Targets:
TP1: 3,340 (Major Resistance)
TP2: 3,345–3,350 (Projection based on breakout path)
Invalidation: Clean break below trendline and demand zone (~3,318)
🧭 Final Words for Traders:
Gold is currently positioned at a critical junction where structure, volume, and institutional behavior all align. If you're following MMC strategies, this is a textbook scenario:
Trap ✅
Absorption ✅
Structure Shift ✅
Trendline Support ✅
SR Interchange ✅
Now, we wait for confirmation and execute with discipline.

Gold Market Builds Momentum Toward 3358 Supply ZoneGold market continues to build momentum gradually, with price action targeting supply mitigation at 3358.
The duration of this stance depends on whether price can clear this zone decisively; failure may lead to short-term consolidation before the next stance.comment ,boost idea and follow for more informed decisions on gold market

It still looks like a Triangle on goldHi traders,
Last week gold made an impulsive wave up but after that it dropped very hard.
If gold is still in a Triangle we could see a correction up and one more move down for wave E. But if price closes below (orange) wave C then the pattern is changed.
Let's see what price does and react.
Trade idea: Wait for the pattern to finish. Then wait for an impulsive move up and a small correction down on a lower timeframe and a change in orderflow to bullish to trade longs.
NOTE: The next three weeks I'm on holiday so I will not post any outlooks publicly.
If you want to learn more about trading FVG's & liquidity sweeps with wave analysis, please make sure to follow me.
This shared post is only my point of view on what could be the next move in this pair based on my technical analysis.
Don't be emotional, just trade your plan!
Eduwave

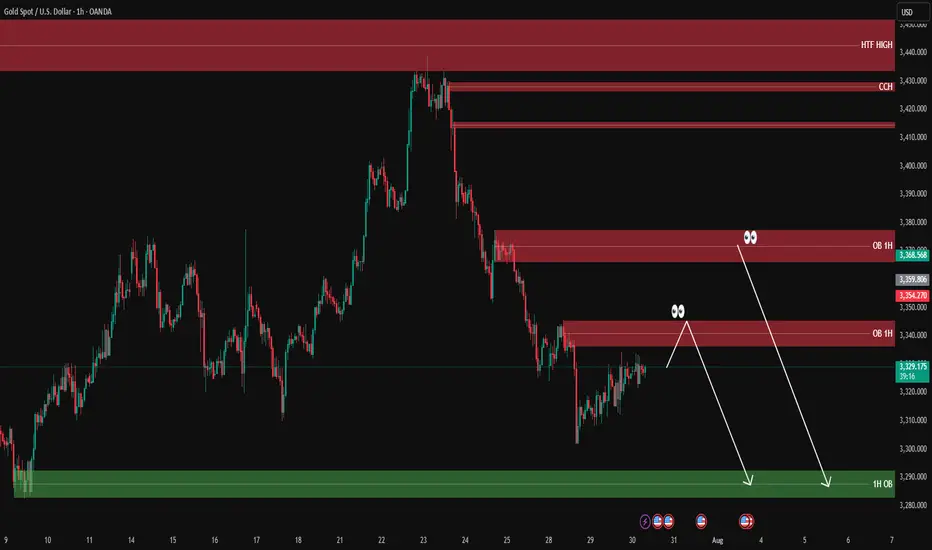
XAUUSD analysis - 1H FVG and OB setupsOn the 1H timeframe, price is currently approaching two key supply zones (OB 1H):
🔴 First OB zone: around 3354 – 3360
🔴 Second OB zone: around 3368 – 3370
We're watching these zones for potential short setups, only with confirmation on the lower timeframes (5M or 3M).
If price reacts to one of these OBs, we expect a move down toward the green 1H demand zone around 3280 – 3290, where a long setup may later form.
📌 Key scenarios:
1️⃣ Price hits the first OB → confirmation → short
2️⃣ Price moves to the second OB → confirmation → short
3️⃣ Target for both setups = green OB around 3280
4️⃣ No entry without confirmation from LTF
❗️ Do NOT enter without lower timeframe confirmation.
Gold is fallingGold is in the neutral zone, and based on the candlesticks on higher time frames, trend line breakouts, etc., I see that it is correcting to the specified zone by the end of the week.

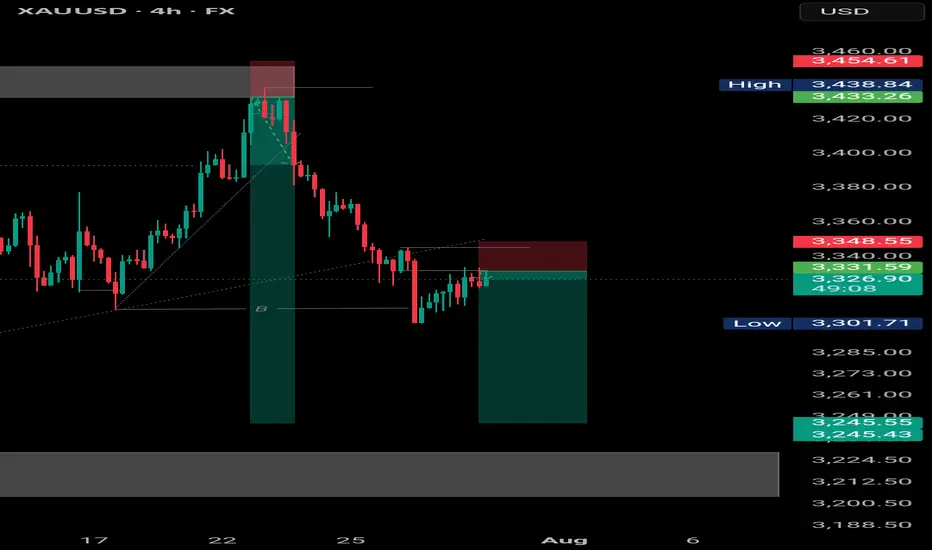
XAUUSD 4H | Clean break & retest | Bearish "XAUUSD 4H | Clean break & retest ✅ Bears stepping in at supply zone, targeting next demand area below. 🏹
Entry: 3331 | SL: 3348 | TP: 3246"