DeGRAM | GOLD around the lower boundary of the channel📊 Technical Analysis
● XAUUSD bounced off the rising channel base at 3,280 and reclaimed the mid-range of the 3,294–3,435 consolidation zone, carving out a higher low pattern.
● The price is compressing into the descending resistance, with a break above 3,400 confirming upside extension toward 3,435 and 3,500.
💡 Fundamental Analysis
● Gold demand stays firm as investors hedge against US fiscal concerns after Fitch’s downgrade, while real yields ease on softer employment revisions.
✨ Summary
Buy above 3,310; break >3,400 targets 3,435 → 3,500. Setup invalid below 3,280.
-------------------
Share your opinion in the comments and support the idea with a like. Thanks for your support!
GOLD trade ideas

Gold Rejected at 3315 – But Bulls Might Not Be Done Yet📌 What happened yesterday?
During the Asian session, Gold printed a fresh local low at 3268, continuing the downtrend that already dropped over 1700 pips in just one week. However, that move quickly reversed, and we saw a natural corrective bounce.
📈 Resistance holds firm
The correction took price back up into the 3310 zone, which acted as confluence resistance. After two taps into that area, price failed to sustain above 3300, indicating sellers are still active there.
❓ Is the upside correction over?
I don't think so. The recent drop has been choppy, lacking the strong momentum of previous legs. This type of price action often signals that we are still within a correction, not in a clean continuation.
📊 What am I watching?
I’m actively monitoring for:
• Exhaustion signs on the downside
• Upside reversal signals
My plan is to open long trades only when I see confirmation, aiming for a move back toward the 3330 zone, which could act as resistance.
Disclosure: I am part of TradeNation's Influencer program and receive a monthly fee for using their TradingView charts in my analyses and educational articles.

GOLD ROUTE MAP UPDATEHey Everyone,
Great finish to the week with our chart idea playing out as analysed.
We complete dour Bullish target 3370 followed with cross and lock confirmation opening 3392 also completed this week. We now also have a cross and lock above 3392 opening 3416.
We will keep the above in mind when taking buys from dips. Our updated levels and weighted levels will allow us to track the movement down and then catch bounces up.
BULLISH TARGET
3370 - DONE
EMA5 CROSS AND LOCK ABOVE 3370 WILL OPEN THE FOLLOWING BULLISH TARGETS
3392 - DONE
EMA5 CROSS AND LOCK ABOVE 3392 WILL OPEN THE FOLLOWING BULLISH TARGET
3416
We will now come back Sunday with a full multi timeframe analysis to prepare for next week’s setups, including updated views on the higher timeframes, EMA alignments, and structure expectations going forward.
Thanks again for all your likes, comments, and follows.
Wishing you all a fantastic weekend!!
Mr Gold
GoldViewFX

THE KOG REPORT - UpdateEnd of week update from us here at KOG:
KOG’s bias for the week:
Bullish above 3340 with targets above 3370✅, 3373✅, 3379✅ and above that 3384✅
Bearish on break of 3340 with targets below 3330, 3320 and below that 3310
RED BOXES:
Break above 3365 for 3372✅, 3375✅, 3379✅, 3384✅ and 3390✅ in extension of the move
Break below 3350 for 3346, 3340, 3335 and 3330 in extension of the move
All bullish above targets completed, no breaks below so we need not worry about the bearish below targets.
Not a bad week at all, even with the ranging and choppy price action. As you can see the red boxes shared for free have worked well and held price giving opportunities up and down following the path and the red box targets. Yesterday we also hit the final target we wanted for the week so no complaints.
Today, we haven't done much apart from a few long trades but now, due to it being late session we would like to see how the market closes and prepare for next week.
Support here stands at the 3375 level with resistance sitting at 3410 which is a possibility if we continue to hold. Is it worth taking however, we don't think so.
LEARN AND GENERATE YOUR OWN SIGNALS. You don't need any of us to guide you.
Please support us and the free channel by hitting the like/boost 🚀 button 🙏 on our Tradingview ideas
As always, trade safe.
KOG

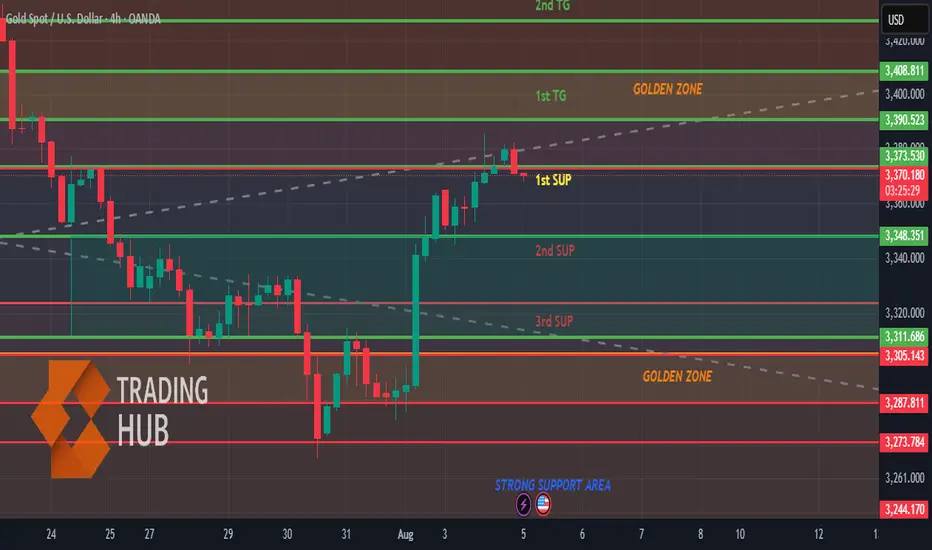
Gold (XAU/USD) - Bullish Breakout Opportunity Above Golden ZoneGold (XAU/USD) has recently shown strong bullish momentum, moving upward from a "Strong Support Area" and a lower "Golden Zone." The price is currently consolidating just below a significant resistance area, the 1st TG (Target), which is also labeled as a "Golden Zone." This presents a potential high-probability setup.
My analysis suggests that the current consolidation is a period of accumulation before the next leg of the uptrend. The key to a successful trade here will be a confirmed breakout above the 1st TG. This would indicate that buyers have absorbed the selling pressure at this resistance and are ready to push the price higher.
Bullish Scenario: The primary scenario I'm watching is a breakout above the 1st TG and its corresponding "Golden Zone" resistance. A clear 4-hour candle closing above this area would be a strong bullish signal.
Bearish Scenario: A failure to break the resistance, followed by a sharp move back down below the current consolidation level (1st SUP), would invalidate the bullish thesis and suggest a potential deeper retracement.
Trading Plan:
Long Entry: Enter a long position on a confirmed breakout and close above the 1st TG (Golden Zone) resistance level.
Profit Target 1: The 2nd TG level, which sits at the top of the chart.
Stop Loss: A stop loss should be placed below the 1st SUP level to protect against a false breakout or a reversal.
XAUUSD – the calm before the next breakout?Hello traders, what’s your take on the current trend in OANDA:XAUUSD ?
Looking back over the past 12 months, gold has delivered a truly impressive performance. From around $2,380 in August 2024, the precious metal surged to an all-time high of $3,432 by April this year — a gain of more than $1,000 in less than a year. But what’s more telling than the rise itself is how the market behaved afterward: instead of crashing, gold has maintained a high consolidation range, suggesting the uptrend is still very much alive.
This powerful rally didn’t happen in isolation. In a world marked by uncertainty, gold has once again asserted its role as a safe-haven asset. Inflation remains persistent across major economies, geopolitical tensions continue to stretch from Eastern Europe to the Middle East and Asia, and de-dollarization efforts by countries like China and Russia are reshaping global capital flows. None of these events alone could shake the markets, but together, they have laid the groundwork for gold’s sustained relevance.
From a technical standpoint, the long-term bullish structure remains intact. Following its peak at $3,432, gold has entered a modest correction phase — one that may well be a healthy consolidation before the next directional move.
Interestingly, while many investors remain cautious, the chart paints a different story: a market that isn’t afraid, but simply catching its breath. The real question is no longer “Can gold hold above $3,400?” but rather “Is the market gearing up for a fresh breakout — or a deeper correction?”
We may not be able to predict the future, but we can observe how price reacts at key levels. And sometimes, it’s in these seemingly quiet phases that the biggest turning points begin to form.
What do you think — is gold preparing for another leg up?
Drop your thoughts in the comments below! 👇

GOLD (XAUUSD): Bearish Continuation Ahead?!
Gold retested a recently broken significant liquidity cluster.
I see a clear sign of strength of the sellers after its test
with multiple intraday confirmation.
I think that the price will retrace to day to 3276 level.
❤️Please, support my work with like, thank you!❤️
I am part of Trade Nation's Influencer program and receive a monthly fee for using their TradingView charts in my analysis.

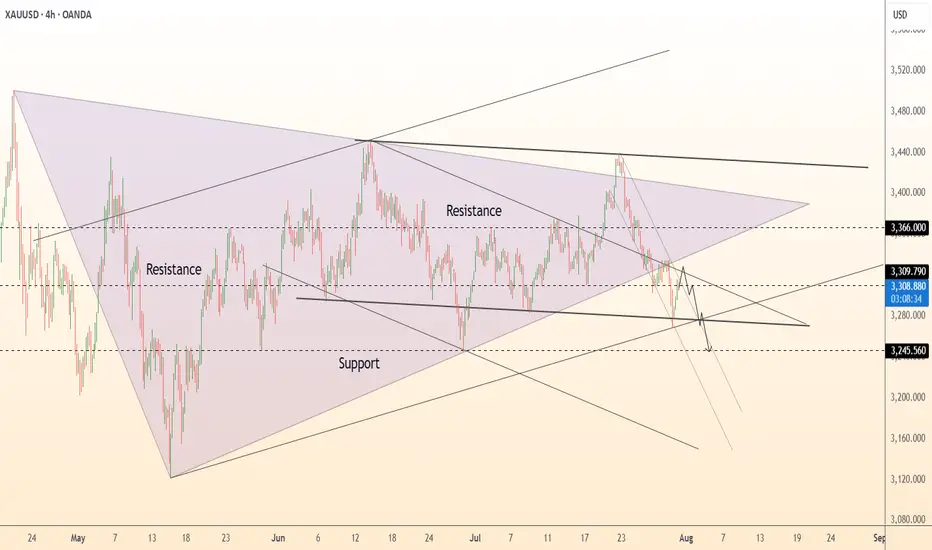
DeGRAM | GOLD fixed below the triangle📊 Technical Analysis
● XAUUSD is forming a bearish descending wedge within a broader symmetrical triangle, facing rejection at 3,310 near prior support-turned-resistance.
● Repeated failure to hold above trendlines and continued lower highs favor a drop toward the 3,246.56 level, with possible overshoot if support breaks.
💡 Fundamental Analysis
● Rising real yields and hawkish Fed tone continue to pressure gold; ISM Manufacturing Prices and NFP loom as next volatility catalysts.
● Reduced ETF inflows and strong dollar on resilient US macro data weigh on demand for non-yielding assets.
✨ Summary
Short bias below 3,310. Breakdown eyes 3,246 → 3,200 zone. Resistance holds while trendline caps recovery.
-------------------
Share your opinion in the comments and support the idea with a like. Thanks for your support!
GOLD (XAUUSD): Very Bullish SetupGold experienced strong bullish momentum on Friday, breaking above a minor daily resistance with a confirmed Change of Character (CHoCH), suggesting a potential continuation of bullish trend.
Retesting the broken structure, the price formed a rising triangle on an hourly timeframe, with a breakout of its neckline serving as a strong intraday bullish signal.
I anticipate that the bullish trend will persist, targeting 3400.

XAUUSD 4H AnalysisXauusd breaks the downward trendline and changes its direction toward important resistence levels 3369-3374. This zone is very important based on ichimoku, so we expect good reaction. after the reaction, the chart will be updated.
important support level is 3317.

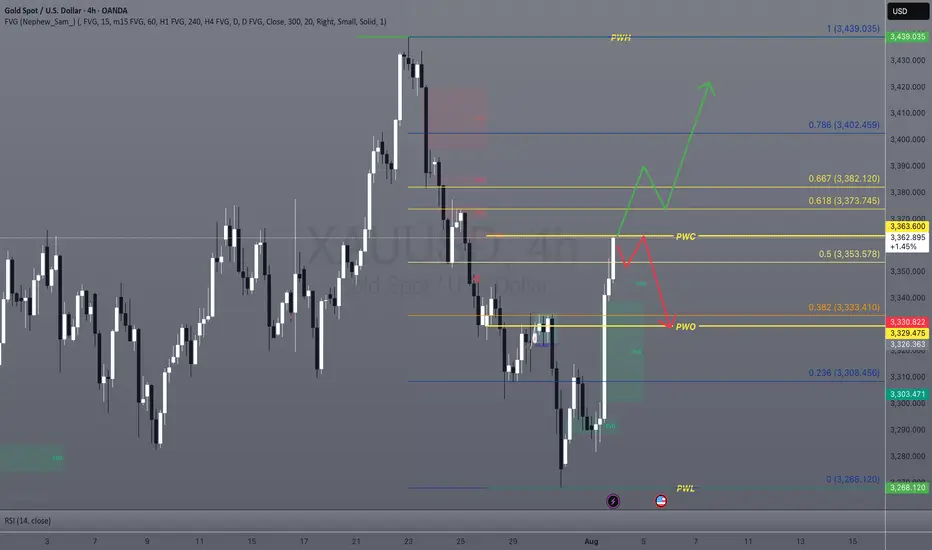
Gold is locked and loaded! A 4H breakout this week could unleashGold Analysis & Trading Plan – First Week of August
Overall Outlook:
Gold is currently consolidating between key levels. A breakout above resistance or a breakdown below support will determine the next move.
⸻
Bullish Scenario (LONG Setup)
• Condition: 4H candle closes above 3364
• Targets:
• First target: 3373
• Second target: 3382
• If 4H closes above 3382, extended targets will be:
• 3392
• 3400
• 3422
⸻
Bearish Scenario (SHORT Setup)
• Condition: 4H candle closes below 3353
• Targets:
• 3333
• 3329
• If 4H closes below 3329, extended targets will be:
• 3319
• 3313
• 3308
⸻
Key Notes
• Focus on intraday trading between these weekly levels as long as price remains within the range.
• Always apply strict risk management.
XAUUSD breaks out – bullish bias returnsGold has bounced from the bottom of the descending channel, initiating a clear upward move with a series of strong bullish candles. On the H2 chart, price has broken above the upper boundary of the medium-term downtrend channel and filled the nearest fair value gap, signaling a resurgence in buying pressure.
Current price action is approaching a previous resistance zone, aligned with recent swing highs. The chart suggests a potential consolidation before further upside, provided that the current bullish structure remains intact.
From a macro perspective, while the stronger-than-expected U.S. PMI data supports the USD in the short term, weak labor market figures and ongoing global geopolitical tensions continue to fuel demand for gold as a safe-haven asset. This environment is helping sustain XAUUSD’s current recovery structure.

Gold Maintains Bullish Momentum – Eyes $3,400📊 Market Summary:
Gold surged past the $3,385 resistance to reach a new high at $3,390, driven by weaker-than-expected ISM Services PMI data. The U.S. dollar softened and Treasury yields dipped, fueling the rally. However, after hitting the peak, some profit-taking emerged, causing gold to pull back slightly and currently trade around $3,383.
________________________________________
📉 Technical Analysis:
• Key Resistance:
$3,390–$3,395 – short-term local high. If this zone breaks, the next target is $3,400+.
• Nearest Support:
$3,380, followed by the previous breakout level at $3,365, both likely to act as support during any pullback.
• EMA 09 (Daily):
Price remains above the 9-day EMA, confirming the continuation of the short-term uptrend.
• Momentum / Volume / Candlestick:
RSI is holding above 60 – bullish. However, a long upper wick near $3,390 suggests short-term selling pressure or hesitation.
________________________________________
📌 Outlook:
Gold is showing bullish momentum, with the uptrend confirmed after breaking above $3,385. If price holds above $3,380, there's a strong possibility of testing the $3,400 level. However, a failure to sustain above this zone could lead to a retest of $3,365.
________________________________________
💡 Suggested Trade Strategy:
🔺 BUY XAU/USD : $3,380–$3,383
🎯 TP: 40/80/200 pips
❌ SL: $3,377

Gold is in very nice bearish opportunity ahead.Gold is in very nice bearish opportunity ahead. The level of 3000$ should be good for testing as a strong support for a next bull run. My tp now after confirmation is in betwwen a zone 3000-3050$.

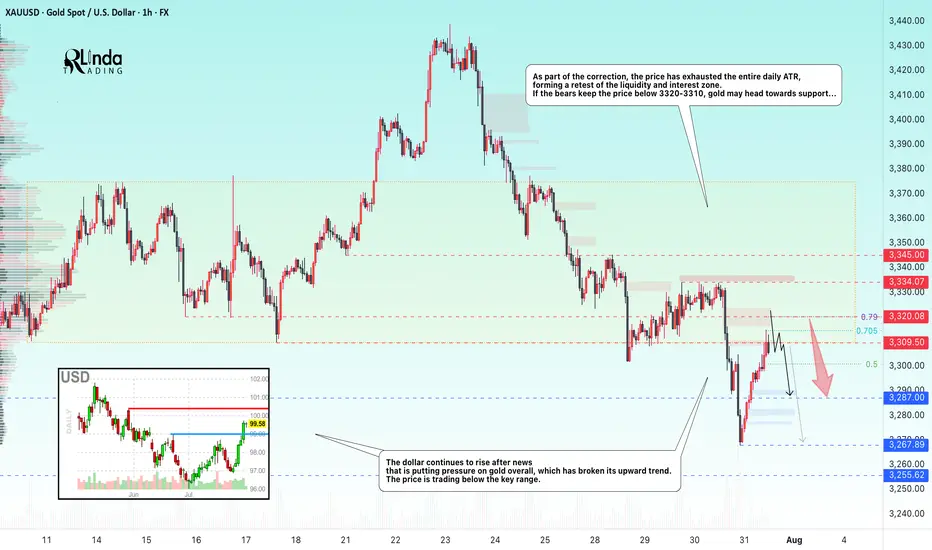
GOLD → Retest of resistance within a bearish runFX:XAUUSD breaks through the upward trend support amid a rallying dollar. Since the opening of the session, the price has been testing the zone of interest, but bears are quite aggressive...
Gold is partially recovering after falling to $3,268, a monthly low caused by the Fed's hawkish tone. The Central Bank kept its rate at 4.25–4.5% (9 votes to 2), highlighting uncertainty due to Trump's tariffs. Markets now estimate the probability of the rate remaining unchanged in September at 58% (previously 35%). The dollar's rise slowed amid concerns about the extension of the US-China trade truce and profit-taking ahead of key US employment data (after strong ADP and GDP reports). The nearest drivers are labor market statistics and trade news, while the technical picture for gold remains bearish.
Technically, on D1, the price is breaking key support zones, including the trend line, which overall only increases selling pressure on the metals market...
Resistance levels: 3310, 3320, 3334
Support levels: 3287, 3267, 3255
As part of the correction, the price has exhausted the entire daily ATR, forming a retest of the liquidity and interest zone. If the bears keep the price below 3320-3310, gold may head towards support...
Best regards, R. Linda!
IM EXPECTING GOLD TO COLLAPSEHere on the post, i shared my SAXO:XAUUSD sell analysis, for further details, see the content of the post. All the best.

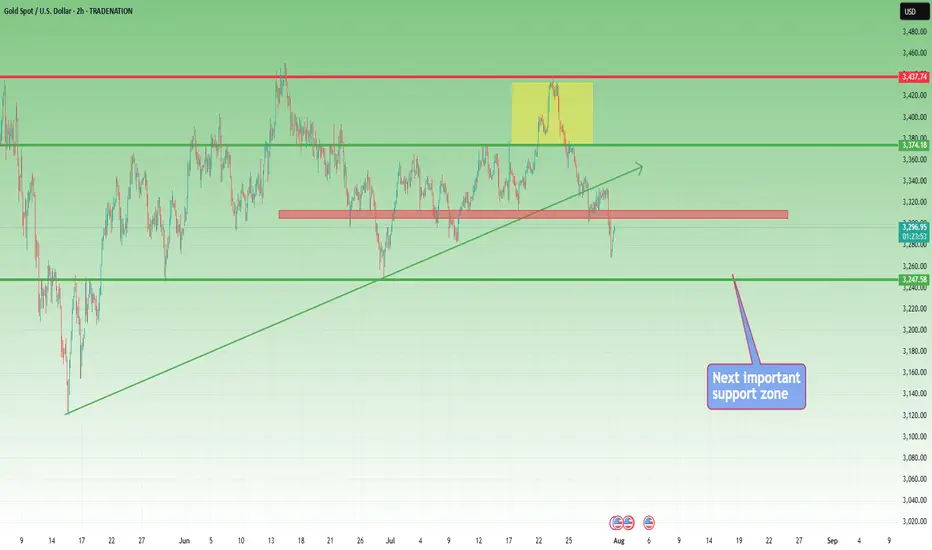
Gold Showing Signs of Reversal After Hitting Key ResistanceHello Guys.
Gold has reached a major resistance zone around 3439–3425, which has already acted as a strong ceiling in the past. The price tapped into this area again, forming a clear divergence, and failed to break higher.
Here’s what stands out:
Divergence signals a weakening bullish momentum at the top.
The price rejected the resistance and is now breaking structure to the downside.
A minor pullback may occur before continuation, as shown in the projected moves.
First target: 3259.792
Second target (if support breaks): 3136.869, a deeper zone for potential bounce or further drop.
This setup hints at a bearish trend building up. Stay cautious on longs unless the price structure changes again.

Gold (XAU/USD) 1H Chart – Trendline Support and Upside TargetGold price is trading above the support trendline around 3,287. A bounce from this level could drive price toward the 3,313 resistance and potentially the 3,333 target. Maintaining support above 3,287 is key for the bullish outlook.

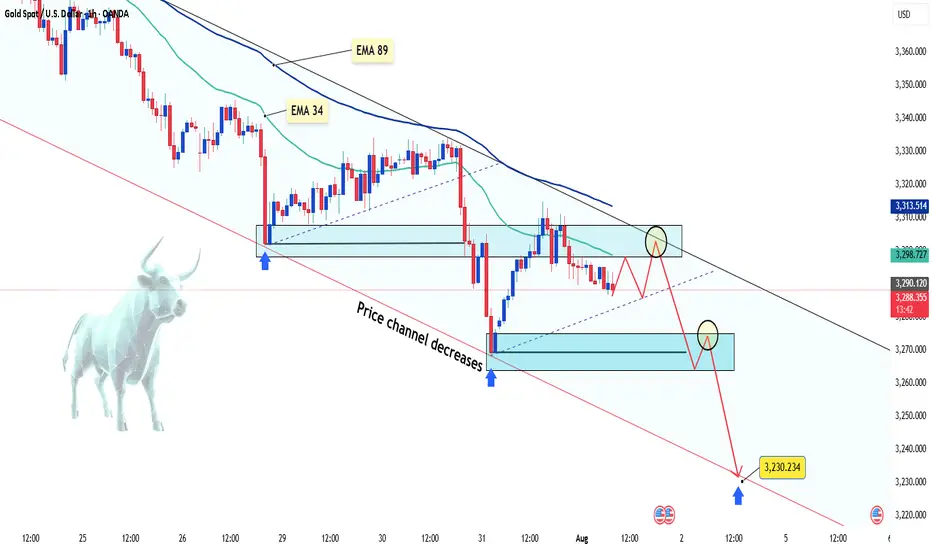
Gold keeps falling – is there more to come?Hello everyone, great to see you again!
Today, gold remains under pressure following a series of strong U.S. economic data releases, which have reinforced expectations that the Federal Reserve will keep interest rates elevated for longer. As a result, the U.S. dollar has strengthened, Treasury yields have climbed, and gold has lost its footing.
On the H1 chart, XAUUSD is clearly trading within a descending price channel. Both the EMA 34 and EMA 89 are acting as dynamic resistance zones. Recent attempts to rally have consistently failed at these levels, mirroring the bearish setup seen before July 29.
Currently, price is retesting a minor resistance area. If this retest fails, the next downside targets lie near 3,270 – and potentially down to 3,230 USD, which aligns with the lower boundary of the price channel.
From my perspective, the bearish momentum is likely to continue.
What about you? How do you think gold will close the day?
GOLD is simply targeting 3600$ in next month In next few weeks the gold can see more rise and pump and we are looking for at least +10% here and targets like 3600$ are not anymore long-term targets and with this tension of war and ... soon that rise and even more will surprise us on the chart.
DISCLAIMER: ((trade based on your own decision))
<<press like👍 if you enjoy💚

XAUUSD (GOLD): Bullish Impulsive Move Up Friday! Wait For Buys!In this Weekly Market Forecast, we will analyze the Gold (XAUUSD) for the week of Aug 4 - 8th.
Gold is bullish on the Monthly, Neutral on the Weekly, Bullish on the Daily.
The aggressive move higher after bad job numbers caused a shift in the market from bearish to bullish on the D1 time frame.
Be wary of the pullback, as that move is likely to be corrected, but that would set up a great long opportunity!
Enjoy!
May profits be upon you.
Leave any questions or comments in the comment section.
I appreciate any feedback from my viewers!
Like and/or subscribe if you want more accurate analysis.
Thank you so much!
Disclaimer:
I do not provide personal investment advice and I am not a qualified licensed investment advisor.
All information found here, including any ideas, opinions, views, predictions, forecasts, commentaries, suggestions, expressed or implied herein, are for informational, entertainment or educational purposes only and should not be construed as personal investment advice. While the information provided is believed to be accurate, it may include errors or inaccuracies.
I will not and cannot be held liable for any actions you take as a result of anything you read here.
Conduct your own due diligence, or consult a licensed financial advisor or broker before making any and all investment decisions. Any investments, trades, speculations, or decisions made on the basis of any information found on this channel, expressed or implied herein, are committed at your own risk, financial or otherwise.

Gold Price Action Update: Neutral to Bearish BiasThis week, apart from my short trade on Tuesday, I’ve maintained a bullish outlook on Gold, suggesting buying the dips with the expectation of a breakout above the 3380-85 zone. I was targeting an acceleration above 3400 and eventually 3440. I followed through with this idea and bought in anticipation of the move.
However, something about Gold's recent price action raised a red flag for me, prompting me to close my buy positions. Let’s break it down:
Starting yesterday morning, the price action became erratic. Initially, we saw the expected breakout, but it was quickly reversed, and the price action turned choppy. Then came a series of quick pumps, followed by quick reversals—each time the market would move up, only to fall back again. As of writing, we’re sitting at 3388.
This kind of erratic movement usually suggests that we’re nearing a top, and even if Gold spikes again above 3400, I don’t want to hold positions in a market that’s so volatile and unsustainable in either direction.
So, I’m out for now, adopting a neutral to bearish stance.
If the price drops below 3370, it would indicate a likely top formation, and at that point, I’ll be looking to sell rallies; till then, wait and see.
Disclosure: I am part of TradeNation's Influencer program and receive a monthly fee for using their TradingView charts in my analyses and educational articles.

XAUUSD Update – Down Continuation to 3250?1. What Happened Yesterday
After an anemic correction that formed a bearish flag, Gold finally broke below 3300 and even dipped under the 3280 support zone — which was my primary downside target. While the move during the day didn’t have enough momentum to reach my second sell limit, I was already in a low-volume short position, so I didn’t miss the move entirely.
2. The Key Question
Has the drop ended, or are we looking at further downside?
3. Why I Expect More Downside
• The overall structure remains bearish.
• The newly formed resistance (previous support) is now the new sell zone.
• If the price drops towards 3280 again, continuation to 3250 becomes very probable.
4. Trading Plan
Selling rallies remains the preferred strategy, especially on spikes into resistance. As long as the price stays below 3335-3340 zone, the bearish outlook remains intact.
5. Conclusion
Sell the rallies. The technical picture still favors downside continuation — no need to overcomplicate it. 🚀
Disclosure: I am part of TradeNation's Influencer program and receive a monthly fee for using their TradingView charts in my analyses and educational articles.