GOLD ROUTE MAP UPDATEHey Everyone,
What a PIPTASTIC finish to the week! 🚀. We tracked the move down with precision durung the week and then rode the momentum right back up.
Yesterday, we confirmed the swing range activation and bounce, and that bullish follow through carried beautifully into today, completing our Bullish Target at 3348. Just perfect execution all around.
BULLISH TARGET
3348 - DONE
BEARISH TARGETS
3328 - DONE
EMA5 CROSS AND LOCK BELOW 3328 WILL OPEN THE FOLLOWING BEARISH TARGET
3305 - DONE
EMA5 CROSS AND LOCK BELOW 3305 WILL OPEN THE SWING RANGE
3289 - DONE
3267 - DONE
We will now come back Sunday with a full multi timeframe analysis to prepare for next week’s setups, including updated views on the higher timeframes, EMA alignments, and structure expectations going forward.
Thanks again for all your likes, comments, and follows.
Wishing you all a fantastic weekend!!
Mr Gold
GoldViewFX
GOLD trade ideas

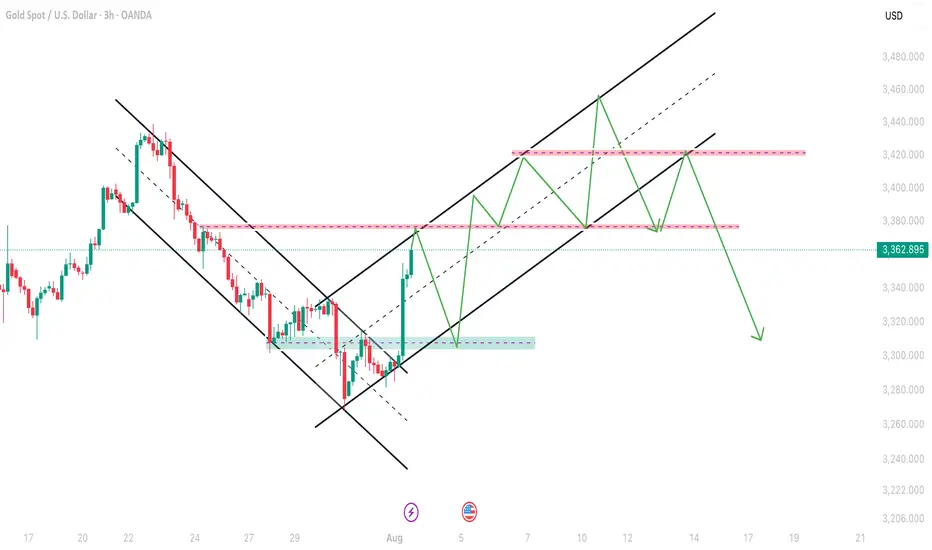
GOLD PRICE: 2 BIG OPTIONS.1. Option 1: Wave 4 of gold price ends, with this scenario, the DXY trend will not be like the chart below, but this week DXY will return to the old bottom and head towards 95-91, gold will increase to complete wave (5).
Price range for the next 3-4 months: 3350-3750.
2. Option 2:
In terms of time, wave (4) has not yet ensured balance. DXY increases and recovers as the chart.
That means we have a gold price range for the next 3-4 months of 3400-3100.

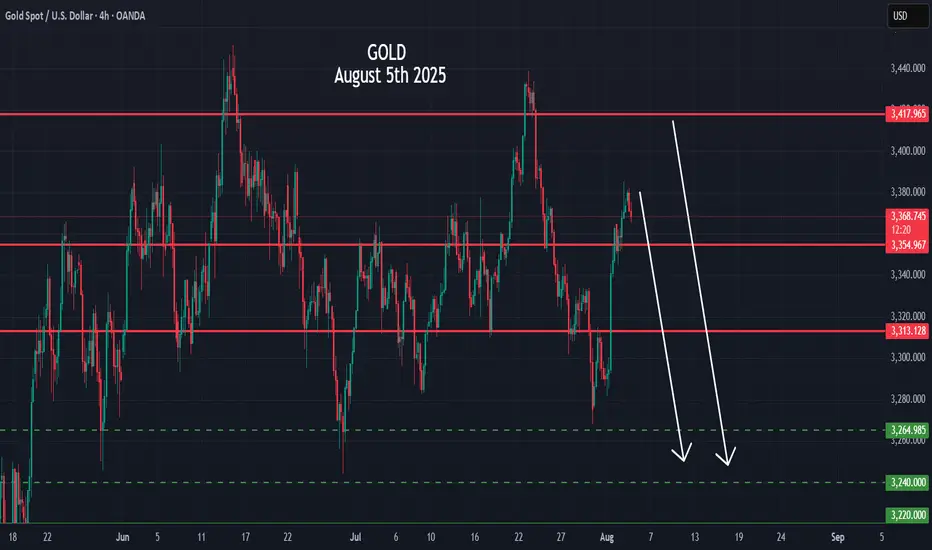
GOLD (XAUUSD): Massive BreakoutGOLD has fallen significantly and closed below an important support level.
The broken structure has now become a strong resistance.
I anticipate further downward movement, with the next support level at 3262.

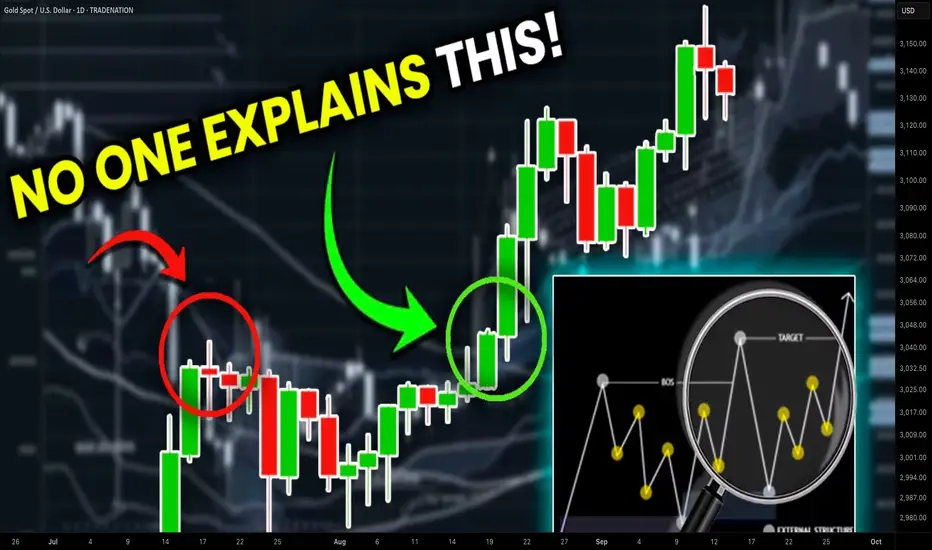
Accurate Price Model for Trading Smart Money Concepts SMC (=
If you trade Smart Money Concepts SMC, there is one single pattern that you should learn to identify.
In this article, you will learn an accurate price model that you can use to predict a strong bullish or bearish movement way before it happens.
Read carefully and discover how to track the silent actions of smart money on any market.
The only thing that you need to learn to easily find this pattern is basic Structure Mapping . After you map significant highs and lows, you will quickly recognize it.
This SMC pattern has 2 models: bullish and bearish ones.
Let's start with a bearish setup first.
Examine a structure of this pattern
it should be based on 2 important elements.
The price should set a sequence of equal lows.
These equal lows will compose a demand zone.
The area where a buying interest will concentrate.
The minimum number of equal lows and lowers highs should be 2 to make a model valid.
Exhausting of bullish moves will signify a loss of confidence in a demand zone . Less and less market participants will open buy positions from that.
At some moment, a demand zone will stop holding. Its bearish breakout will provide a strong bearish signal , and a bearish continuation will most likely follow.
This price model will signify a market manipulation by Smart Money.
They will not intentionally let the price fall, not letting it break a demand zone. A buying interest that will arise consequently will be used as a source of liquidity.
Smart money will grab liquidity of the buyers, silently accumulating huge volumes of selling orders.
Once they get enough of that, a bearish rally will start, with a demand zone breakout as a trigger.
Though, the chart model that I shared above has a strong bullish impulse, preceding its formation, remember that it is not mandatory.
The price may also form a bearish impulse first and for a pattern then.
Each bullish movement that initiates after a formation of an equal low should be weaker than a previous one.
So that the price should set a lower high every time after a formation of an equal low.
Look at a price action on USDCHF forex pair. Way before the price dropped, you could easily identify a market manipulation of Smart Money and selling orders accumulation.
A breakout of a horizontal demand zone was a final bearish confirmation signal.
Let's study its bullish model.
It has a similar structure.
The price should set a sequence of equal highs, respecting a horizontal supply zone.
Each bearish move that follows after its test should have a shorter length, forming a higher low with its completion.
This model will be also valid if it forms after a completion of a bearish impulse.
Weakening bearish movements will signify a loss of confidence in a supply zone, with fewer and fewer market participants selling that.
Its bullish breakout will be an important even that will confirm a highly probable strong bullish continuation.
Smart Money will use this price model to manipulate the market and accumulate buying orders, not letting the price go through a supply zone. They will grab a liquidity of the sellers each time a bearish move follows from a supply zone.
When they finally get enough of a liquidity, a bullish rally will initiate and a supply zone will be broken , providing a strong confirmation signal.
That price model was spotted on GBPJPY forex pair.
Smart Money were manipulating the market, not letting it continue rallying by creating a significant horizontal supply zone.
Selling orders that were executed after its tests provided a liquidity for them.
A bullish breakout of the underlined zone provides a strong bullish confirmation signal.
A breakout and a future rise could be easily predicted once this price model appeared.
Why they do it?
But why do Smart Money manipulate the markets that way?
The answer is simple: in comparison to retail traders, they trade with huge trading orders . To hide their presence and to not impact market prices much, they split their positions into a set of tiny orders that they execute, grabbing the liquidity.
The price model that we discussed today is the example how they do it.
The important thing to note about this pattern is that it efficiently works on any market and any time frame. You can use that for scalping, day trading, swing trading. And it can help you find great investing opportunities.
❤️Please, support my work with like, thank you!❤️
I am part of Trade Nation's Influencer program and receive a monthly fee for using their TradingView charts in my analysis.
Patience Through VolatilityThere's something the market teaches you over time that no book, course, or checklist ever really prepares you for - “how to live with uncertainty” .
It's amazing how quickly the market can make you doubt yourself. You can be doing everything right - following your process, managing your risk, sticking to your plans, and then volatility hits. Suddenly, nothing seems to make sense. The moves feel random. Your setups fail. Your confidence fades. You start questioning not just your trades, but yourself.
You'll have stretches where patience feels like the hardest thing in the world. Watching markets whip up and down without direction, sitting on your hands when you want to trade just to feel in control again, it's exhausting in a different way. It's not the exhaustion of doing too much. It's the weight of doing nothing when your instincts scream at you to act.
That’s the part most people don’t talk about. It’s not the losing trades that break most traders, it’s the feeling of being stuck. The uncertainty of not knowing when the noise will fade. The frustration of watching opportunities slip by without a clear way to take part. It’s the slow grind of sitting through volatility while your discipline quietly wears down, day after day.
Patience isn’t something you can show off. Most of the time, it looks like doing nothing. And often, it feels like falling behind.
Good trading isn't about finding opportunities in every move, it's about knowing when the market favours you, and when it doesn't. It's about understanding your edge and protecting it.
Some environments aren't built for your system, your style, or your strengths. Volatile markets don't offer you clean setups or easy entries. They offer noise, confusion, and temptation.
Most traders don’t struggle because of volatility itself, but because of the impatience it creates. They force trades. They chase moves. They try to squeeze something out of the market simply because the waiting feels unbearable.
But waiting is not a weakness. Sitting still is not inaction. Restraint is a skill.
Your progress won’t always be visible. It won’t always show up on a chart at the end of the day. Sometimes, progress is simply preserving your capital. Sometimes, it’s maintaining your discipline. And sometimes, it’s protecting your mindset so you’re ready when the right opportunities finally come back into focus.
You have to learn to stomach the discomfort of volatility without tying your self-worth to every swing in your account. The noise always feels permanent in the moment. Doubt grows louder. You start questioning your system, your progress, and even yourself. (More on this in a future post.)
That's normal.
What matters is what you do with those feelings. Whether you let them push you into reckless trades just to feel something again, or whether you have the maturity to sit still, protect your capital, protect your mindset, and wait.
There’s no hack for this. No shortcut. Patience is something you earn the hard way - forged in boredom, frustration, and the silence between trades. Patience isn’t about passively waiting; it’s about actively protecting yourself, your energy, your future self from the damage you could cause today.
Not every moment in the market is meant for action. Not every day is meant for progress. Some days, weeks, or even months are simply about survival. Some seasons are for growth, and others are just for holding on. Knowing the difference is what keeps you in the game long enough to eventually see the rewards.
The market will calm. Patterns will return. Opportunities will align. Your edge will reappear. The chaos always fades. The clarity always returns. When it does, you want to be ready - not emotionally drained, not financially wrecked, and not scrambling to recover from the mistakes impatience forced on you.
But if you lose patience and start chasing just to feel active, you risk more than money. You risk undoing the very discipline you’ve worked so hard to build.
Volatility will always test you. That's its nature. Patience will always protect you. That's your choice.
If you’re in one of those stretches right now - high volatility, failing setups, doubt creeping in; remind yourself this is part of the process. It’s normal, and it’s not the time to force progress.
Let the market burn itself out.
If you can do that, you’ll find yourself ahead, not because you forced results, but because you endured the pain when others couldn’t.
The rewards won’t come from predicting the next move. They’ll come from knowing you didn’t let the storm in the market create a storm within you.
Trust that clarity will return. Your only job is to make sure you’re still here when it does.
There’s strength in waiting. There’s wisdom in restraint.
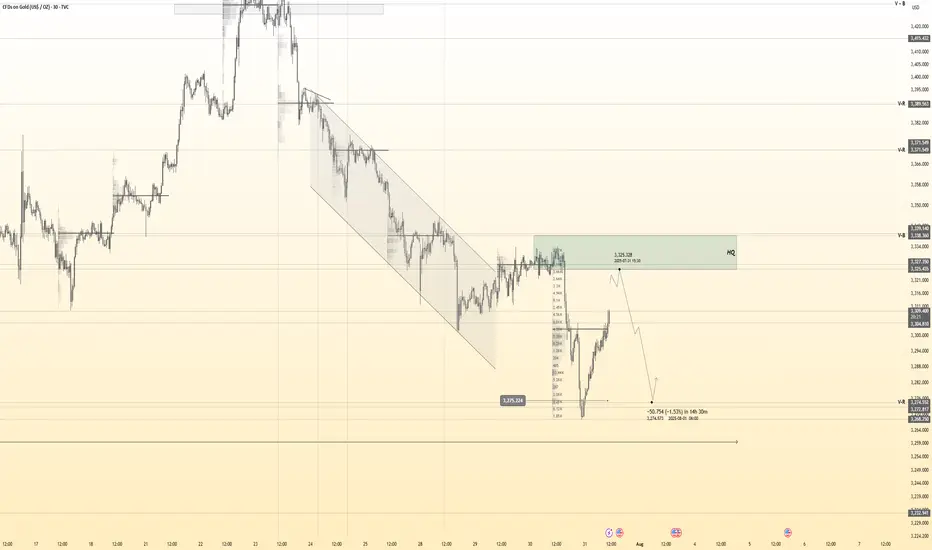
Gold can reach resistance area and then continue to fallHello traders, I want share with you my opinion about Gold. Over an extended period, the price action of Gold has been contained within a large descending triangle, a pattern characterized by a series of lower highs testing a descending resistance line and a relatively flat support base. The major seller zone around the 3415 resistance level has consistently capped upward rebounds, establishing a clear downward pressure on the asset. The most critical recent development has been a decisive breakdown, where the price broke below a key ascending trend line and, more importantly, below the horizontal support at 3310. This structural break has shifted the immediate market dynamics, turning the former support area of 3310 - 3320 into a new ceiling of resistance. The primary working hypothesis is a short scenario based on the principle of a breakdown and retest. It is anticipated that the price will attempt a corrective rally back towards this new resistance area around 3310. A failure to reclaim this level, confirmed by a strong rejection, would validate the breakdown and signal the continuation of the larger downward trend. Therefore, the tp for this next bearish leg is logically placed at the 3240 level. This target represents a significant area of potential support and a measured objective following the resolution of the recent consolidation. Please share this idea with your friends and click Boost 🚀
Disclaimer: As part of ThinkMarkets’ Influencer Program, I am sponsored to share and publish their charts in my analysis.

My first take on XAUUSDI see this last fall as a very clear sweep of liquidity (the recent lows. After that i see an impulsive push away from this zone giving me a change of character. Left behind is an FVG on hopurly chart that aligns within the kill zone on my Fibonacci tool. and that is where i would enter. I would expect price to mitigate this FVG. Another confluence is that we created many IFVG's on the way up showing balanced price action. Only one more confluence i would have liked is a HTF order block from the liquidity sweep but only have one on the 5 minute. i will monitor. First tp is that internal liquidity from the move, second tp is the external liquidity where we have had consolidation and a few failed attempts to break above this opening gap fvg. thanks for looking. any comments welcome,

Gold 30Min Engaged ( Bearish Reversal Entry Detected )Time Frame: 30-Minute Warfare
Entry Protocol: Only after volume-verified breakout
🩸Bearish Reversal - 3325
➗ Hanzo Protocol: Volume-Tiered Entry Authority
➕ Zone Activated: Dynamic market pressure detected.
The level isn’t just price — it’s a memory of where they moved size.
Volume is rising beneath the surface — not noise, but preparation.
🔥 Tactical Note:
We wait for the energy signature — when volume betrays intention.
The trap gets set. The weak follow. We execute.
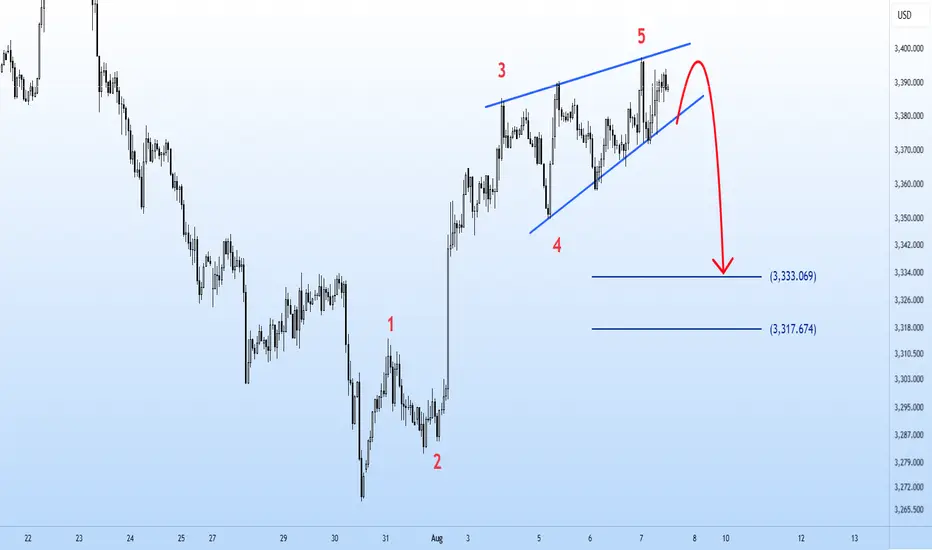
A great opportunity to sell gold!Gold Analysis Short and Medium Timeframe Elliott Wave Analysis Style The gold market has completed five upward waves and is currently at the end of the upward wave. Given the formation of the corner market pattern, it could enter a reversal and decline towards $3,333.
continue to maintain gold purchase, 3400⭐️GOLDEN INFORMATION:
Gold prices edged higher on Monday, supported by growing expectations of a Federal Reserve rate cut following last Friday’s disappointing U.S. Nonfarm Payrolls report. XAU/USD is trading around $3,375, up 0.39% on the day.
Speculation over a potential policy shift has strengthened, with markets now pricing in an 87% chance of a rate cut at the Fed’s September 17 meeting — a boost for the non-yielding yellow metal.
Last week’s labor data revealed early signs of weakness in the job market. The U.S. Bureau of Labor Statistics (BLS) revised May and June payrolls down by a combined 258,000 jobs, reinforcing dovish remarks from Fed Governor Christopher Waller, who downplayed tariff-driven inflation and emphasized concerns about the Fed’s full employment mandate.
⭐️Personal comments NOVA:
Uptrend, gold price is maintaining stability. Heading towards 3400, before the expectation of interest rate cut is becoming more and more obvious.
⭐️SET UP GOLD PRICE:
🔥SELL GOLD zone: 3415- 3417 SL 3422
TP1: $3405
TP2: $3394
TP3: $3380
🔥BUY GOLD zone: $3311-$3313 SL $3306
TP1: $3325
TP2: $3338
TP3: $3350
⭐️Technical analysis:
Based on technical indicators EMA 34, EMA89 and support resistance areas to set up a reasonable BUY order.
⭐️NOTE:
Note: Nova wishes traders to manage their capital well
- take the number of lots that match your capital
- Takeprofit equal to 4-6% of capital account
- Stoplose equal to 2-3% of capital account

Gold next prediction Aug 4 onwardsAs you can see in this chart gold was moving in a downtrend channel and after a big breakout in Non-Farm Gold moves to 3362 so now it will make a new Bullish channel in which first hurdle will be 3374-3380 and then can retrace till 3H and 4H chock point and then can continue to bullish side overall move can be done upto 3452-3460 which is last resistance of the market as my analysis this can be plan A.I will update about Plan B in my next analysis.
Crystal Ball Forecast for Gold (XAUUSD)🔮 Crystal Ball Forecast for Gold (XAUUSD)
Current Price: 3372
Medium-Term Direction: 🔻 DOWN
✅ My Forecast: GOLD WILL GO DOWN from 3372
🔍 Why? (Technical Reasons Supporting Bearish Outlook)
1. Gann Price Vibration (From recent high ~3385)
3372 = 45° level – key resistance level
Price rejected at 3375–3385 zone multiple times
If 3375 holds as resistance, next vibration levels:
3335 (Gann 45° down)
3284 (Gann 90° down)
3250 (Gann 120° down)
2. Elliott Wave
Looks like Wave 5 (ending diagonal) completed at 3385
Current price at 3372 = classic "after top" trap zone
Next structure likely forming ABC correction or new bearish impulse
Projection:
Wave A → 3335
Wave C → 3280–3250
3. Price Action + Candle Behavior
Strong upper wicks around 3375–3380
Lower highs forming = distribution pattern
MACD & RSI divergence visible on 4H/1D
📉 Medium-Term Bearish Targets
Target Price Reason
3335 Gann 45° down, Wave A low
3284 Gann 90° down, Wave C
3250 Gann 120°, Cycle
3183 Gann 180°, major support
📌 Summary Forecast
✳️ Gold is topping out.
✳️ Bearish move toward 3280–3250 is highly likely.
✳️ Best entry = on rejection from 3375–3380 zone
✳️ Stop = above 3390
✳️ Hold short for 2–3 weeks or until target reached
GOLD LAST LIQUDITY GRAB SELL SELL SELLI have take another SELL (as seen on the chart)
GOLD just came to test SUPPLY/DEMAND AREA which work well as a LIQUIDITY GRAB/SL HUNT before DUMP HEAVILY
Stay alart gold at the moment looks good for sell gives very good risk/reward
Thanks

(Gold) Technical Analysis – Buy-Side Correction in PlayGold is currently undergoing a correction on the buy side, with price action suggesting the potential for further upside. The market is showing bullish momentum amid rising global uncertainty.
Dovish Fed Expectations: Increasing speculation around potential Fed rate cuts, along with discussions about leadership changes (including the possible replacement of Kugler and Powell), is contributing to a more accommodative outlook. Geopolitical & Trade Tensions: Continued escalation of global trade conflicts is boosting demand for safe-haven assets like gold, adding to bullish pressure.
If the price holds above the 3370–3380 support zone, bullish continuation toward 3420/3440 is likely in the short term.
You May find more details in the chart.
Ps; Support with like and comments for better analysis

Gold Is Conquering New Highs!Hello everyone, what do you think about XAUUSD?
Gold has had an impressive week of growth, currently approaching its historical peak at 3,380 USD/ounce.
This is a clear sign of the precious metal's sustained strength amidst a volatile market. Weak U.S. employment data, along with expectations that the Federal Reserve (Fed) may cut interest rates in September, have weakened the USD, which in turn has propelled gold to new heights.
From a technical standpoint, gold is trading in an upward channel and continuously recovering from solid support levels, indicating strong buying momentum. Notably, we’ve seen a bearish crossover at the EMA 34 and 89 lines, along with a break below the previous uptrend line – both of which strengthen the current upward move.
If there is any pullback before the next leg up, Support 1 (which aligns with the lower boundary of the upward channel and the EMA lines) will be an important area to watch. This could be the ideal zone for potential trade setups.
Looking ahead, the next resistance target is around 3,440 USD. If this level is broken, nothing will hold gold back from pushing even higher, possibly heading toward the psychological 3,500 USD level.
What do you think? Will XAUUSD continue its breakout this week? Drop your thoughts in the comments below!

Gold’s heating up – Riding the wave or waiting for the dip?Hey everyone! So, what’s your take on XAUUSD right now?
Gold’s been on a tear lately – yesterday it kept pushing higher and is now chilling around $3,376.
The move’s mostly driven by hopes that the Fed might ease up soon, especially with recent U.S. data showing signs of slowing down.
From a chart perspective, it’s looking like we might be at the beginning of a fresh bullish wave. There’s a nice bullish confluence happening at the EMA 34 and 89, plus we’ve broken above previous resistance – both giving that upward momentum some real backing.
If price pulls back before another push, I’m keeping my eyes on the Fibo 0.5–0.618 zone. That area also lines up with the EMAs and old resistance, so it could be a sweet spot for a buy setup if things line up right.
Personally, I’m leaning bullish today.

GOLD: $4000 on the way! Bulls has the controlGold is on the way hitting a record high since the global tension rising we can see gold creating another record high. Please note that it is a swing trades and may take weeks and months to hit the target or it may not even reach the target itself. This is prediction only so do your own due diligence.
GOLD Potential Bullish Fallowing the PullbackGold is currently forming a trading range, with recent price action indicating a test of support, which may mark the end of the recent pullback. Yesterday, gold retraced toward the 3391 level, showing signs of short-term recovery.
Key Market Focus
The market is closely watching developments around the Federal Reserve appointment, including the potential replacement of Chair Powell. Trade-related comments from Donald Trump are also creating uncertainty. These geopolitical and macroeconomic factors may trigger a new correction or volatility phase in gold.
Resistance: 3400 / 3425
Support: 3355 / 3350
Price action confirmed a false breakout to the downside, with strong buying interest near the 3350–3355 support zone. If the price holds above this support, it strengthens the case for a bullish continuation. A break and close above 3400 could pave the way toward 3425 and potentially higher Growth.
You may find more details in the chart.
Trade wisely Best of Luck Buddies.
Ps: Support with like and comments for better analysis Thanks

Gold next move (Read Description). Hello, Traders.
As you see gold has changed its direction after the NFP News. It was in down trend after the NFP News its flying to the my moon.
Gold is just flying and making breakouts of resistance areas. In my view gold wants to fly and it wants to hit buy side liquidity and then we can see the waterfall.
Gold can continue the trend and if price pullbacks it can touch the area 3365 - 3353 and then can fly.
Don’t trade against the trend, analyse the market before opening the trades.

Gold's Bullish Momentum: Heading Towards Historic Highs?Hey everyone, it's Alex here!
Yesterday, XAUUSD continued its upward trend and is now trading around 3.375 USD.
The price increase of gold is mainly driven by the bargain-hunting sentiment from speculators. After a slight drop in gold prices in the morning, buy orders were quickly triggered, taking advantage of the lower prices. Coupled with the weakening USD, this opened the door for a strong buying pressure on gold.
From a technical perspective, the current trend shows the beginning of a new bullish wave within a clearly defined uptrend channel. Notably, the EMA 34 and EMA 89 are converging closely, along with the breakout of previous resistance, which further increases the likelihood of the ongoing bullish momentum.
Regarding the outlook, I prefer buying in line with the prevailing trend. As long as the price holds above the newly established support (confirmed by previous resistance), the next target will be the upper boundary of the price channel, around 3,435 USD.
This is a key level that will determine whether the upward trend continues or if the market will experience a correction. It all depends on how the market reacts at that moment.
What do you think about the current gold trend? Feel free to share your thoughts in the comments!

Will gold break out of its range-bound trading on August 7th?
📌 Core Logic: High-level fluctuations, be wary of a pullback risk
News support for gold prices
Expectations of a Fed rate cut: Weak US economic data (employment, services) reinforce expectations of a rate cut, putting pressure on the US dollar (around 98.7), benefiting gold.
Safe-haven demand: Trump’s policy uncertainty (tariffs, personnel changes) has increased market risk aversion, and gold has been sought after as a safe-haven asset.
Key Technical Signals
Resistance: 3390-3400 (nearly two-week high, bullish risk zone; a breakout targets 3420-3450).
Support: 3370 (short-term bull-bear boundary), 3360-3350 (key support for pullbacks).
Short-term Trend:
4-Hour Chart: Price is under pressure after approaching the acceleration line, indicating a high risk of chasing higher prices.
30-minute chart: Double top resistance at 3390. If it fails to break through, it may retest 3370. A break below 3370 signals weakness, with a target of 3350.
🎯 Today's Trading Strategy
1. Short Opportunity (Priority)
Entry Point: 3385-3395 (Test short position with a small position)
Stop Loss: 3402 (Short position expires if it breaks through 3400)
Target: 3370 → 3360 (If it breaks below 3360, hold to 3350)
2. Long Opportunity (Buy low after a pullback)
Entry Point: Go long if it stabilizes at 3360-3350
Stop Loss: 3345 (Prevent false breakouts)
Target: 3380-3390 (Hold if it breaks through 3400)
⚠️ Key Market Signals
If the Asian and European sessions continue to fluctuate above 3380, the US session may see another push towards 3400, but avoid chasing long positions. Wait for shorting opportunities at higher levels. If it quickly breaks below 3370, then turn short-term bearish and follow through to 3360-3350.
If it stabilizes at 3400 → Set stop loss for short position and switch to long position if it stabilizes on a pullback, with target at 3420-3450.

Gold Reverses After Hitting Resistance–Bearish Correction Ahead?GOLD – Market Overview
Gold reached our resistance target perfectly, rallying nearly $50 from 3349 to 3400, as previously projected.
Now, price has reversed from the resistance zone and is stabilizing below 3380, which supports a potential bearish correction toward 3365.
A break below 3365 would likely extend the move down to 3349.
For bullish momentum to resume toward 3402, we need a clean break above 3385.
Pivot Line: 3380
Support: 3365 – 3349
Resistance: 3391 – 3402
previous idea:

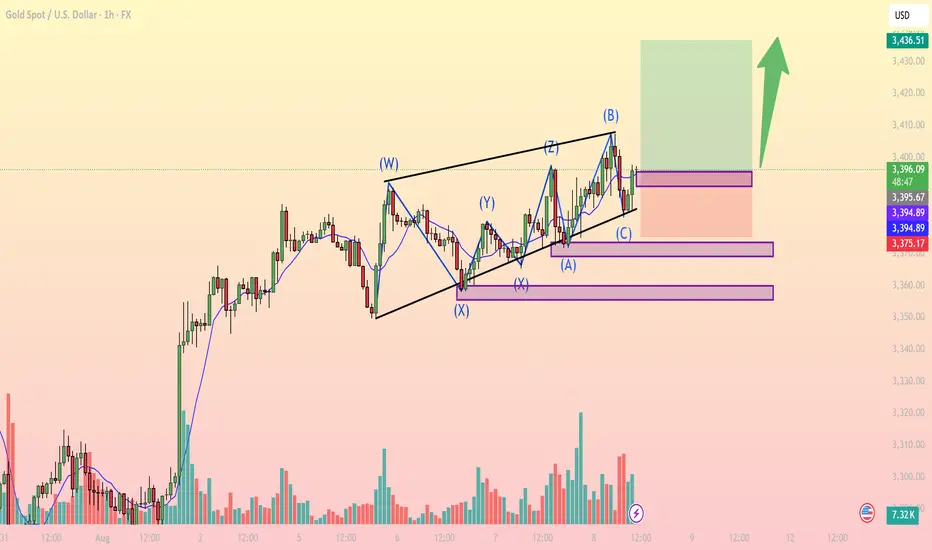
Gold completes corrective structureXAUUSD August 8: Gold completes corrective structure – Buy opportunity on breakout
On the 1H chart, Gold (XAUUSD) has been consolidating within a complex WXYXZ corrective pattern following the strong bullish rally from August 1st. The recent (A)(B)(C) correction within wave Z appears to have completed, with price currently bouncing from a key demand zone around 3,394 – 3,395 USD.
Key bullish signals:
Corrective pattern completed: Wave (C) touched the lower trendline and showed a bullish reaction, suggesting end of the correction.
EMA bounce: Price is finding support from the short-term EMA, indicating a potential return of bullish momentum.
Rising volume: Especially after testing the 3,375 support zone, buying volume has increased, confirming accumulation.
Fibonacci confluence: The 3,394 level aligns with the 61.8% retracement of the previous bullish leg – a strong support zone for long entries.
Important price levels:
Immediate support: 3,394 – 3,395 (ideal buy zone).
Stronger support: 3,375 (stop-loss placement).
Resistance / Take Profit: 3,436 (previous high and supply zone).
Suggested Trading Strategy:
Bias: Long (Buy)
Entry: 3,395
Stop-loss: 3,375
Target: 3,436
Risk/Reward Ratio: ~1.99 – solid for an intraday setup.
Note: If price breaks below 3,375 with high volume, consider exiting early to avoid deeper downside toward 3,333.
Conclusion: Gold is likely resuming its uptrend after a complex corrective phase. This presents a potential long opportunity with a favorable risk/reward ratio if executed properly within the marked levels.
Follow for more high-quality trading setups – and don’t forget to save this idea if it fits your trading plan.